

Abstract
We previously developed a software package called ABLe (Analysis of Brain Lesions) which characterizes brain lesions in terms of lesion volume and intersection with cytoarchitecture (e.g. Brodmann areas). Since our previous publication, there have been significant improvements to this software package which utilize methods standard to the neuroimaging community. These features include spatial normalization to the MNI template brain (standard of the International Consortium for Brain Mapping), and use of the Volume Occupancy Talairach Labels (VOTL) and Automated Anatomical Labeling (AAL) atlases for full brain quantification of structures impacted by the lesion. Methods for multi-subject studies including lesion-symptom mapping proposed by Bates et al have been extended in ABLe to produce an exploratory analysis summarizing correlations between subjects with overlapping lesions and behavioral deficit. A subset of data from an ongoing traumatic head injury study correlating deficit with brain anatomy is used to demonstrate the power of this software package.
Keywords: Brain lesion, cytoarchitecture, Brodmann areas, computer software, prefrontal cortex
1. INTRODUCTION
The characterization of lesion location in the brain is an important step in studying brain function. Putative brain centers or networks that control motor, sensation and cognition can be assessed by correlating deficits with lesion location across a group of subjects. Originally, autopsies were used to confirm brain lesion location otherwise estimated by entry site using skull films. Now magnetic resonance imaging (MRI) and computed tomography (CT) scans are used for this analysis because these methods allow for in-vivo analysis of brain lesions. Because cytoarchitecture regions (i.e. Brodmann areas) are thought to represent functionally distinct brain regions, lesion location is often characterized by which regions are involved. As yet, there is no way to directly parcellate Brodmann areas on imaging and therefore, estimates must be made.
Previous techniques for characterizing lesion location on tomographic images (e.g. MRI or CT) involved placing an overlay of a template (e.g. see the template system designed by Damasio and Damasio, [1]) on top of the tomographic film. This template interpolates the Brodmann areas (BAs), originally determined by Brodmann (1909), on the surface of the brain, to 11 axial image slices. While this is a relatively straight forward method of detecting where the lesions intersect functional areas, it is limited by the correspondence of the template to the individual brain. There are many limitations to this technique. First, considerable inter-individual brain variation exists, so that the templates may poorly overlap. In addition, the imaging plane orientation may not correspond to that of the template.
For these reasons, our group previously developed software which addresses these limitations and is easy to use. This software, known as ABLe (Analysis of Brain Lesions) first published in 2002 [2], has already been used in several studies [3,4]. ABLe 1.0 was designed to be user-friendly, requiring little sophistication with computing by the user. The design focus was to standardize a method of brain lesion processing for potentially large numbers of MRI or CT scans by a trained technologist familiar with normal and pathologic neuroanatomy. In ABLe 1.0, a digitized brain atlas was derived from the Damasio templates described above and used to determine regions affected by the lesion. This atlas is only defined on the cortex; therefore internal brain structures, such as the basal ganglia are not included. The BAs are defined on 11 axial slices, approximately 1cm apart. If a small lesion lies in between these slices it may not be detected.
Since the publication describing ABLe 1.0, the VOTL [8] and AAL [9] atlases have been added to ABLe in order to gain full brain coverage. In addition, several image processing and lesion visualization techniques common to the neuroimaging community have been integrated into this single software package. The purpose of this article is to provide a detailed description of these methods to the scientific community.
A small number of other software packages have also been developed to characterize brain lesions using tomographic images and digital atlases. These include MRIcro [5], Brainvox [6] and BRAID [7]. While each program has its strengths and weaknesses, they each address the problem of analyzing brain lesions across multiple subjects. A brief analysis of the merits of these programs compared with ABLe is included in the Discussion section.
2. COMPUTATIONAL METHODS
Since an article describing the methods of ABLe 1.0 already exists [2], this section will describe only the development of functions new to ABLe and available in version 2.3. Figure 1 shows a block diagram of the processing steps for lesion localization in a single subject.
Figure 1.
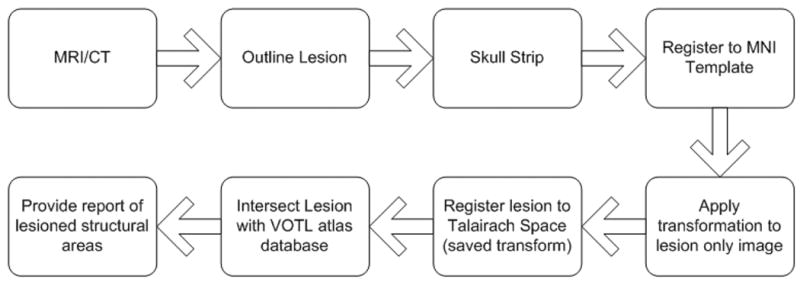
Block diagram depicting processing steps for lesion localization of a single subject’s MRI or CT scan. The lesion is manually outlined slice by slice. The brain is automatically skull stripped allowing for a more accurate spatial normalization. The brain is then automatically registered to the MNI Template brain. The transformation matrix is saved and applied to an image of the lesion only. If the AAL atlas option is chosen, the intersection of the lesion with the AAL atlas is determined and a report is produced. If the VOTL atlas option is chosen, another spatial transformation is applied, which maps the MNI template space to the Talairach space of Talairach/Tournoux 1988. The lesion image is compared to the VOTL atlas database and anatomic structures that intersect the lesion are reported.
Because the VOTL and AAL atlases were based on the coordinate systems of Talairach and Tournoux [10] and the MNI template brain (standard of the International Consortium for Brain Mapping) respectively, the subject’s MR image is spatially transformed (normalized) to these coordinate systems. This spatial transformation is applied to a binary image representing the traced lesion in order to determine structures intersected by the brain lesion.
2.1 Lesion Localization with VOTL
As seen in Figure 2, ABLe 2.3 allows the user to choose either the whole brain VOTL atlas, the whole brain AAL atlas, or the 11 slice D-P (Damasio and Patronas) atlas. In addition, the user can define the lesion either by manual tracing (slice-by-slice), or by loading in a lesion mask obtained from another software program (e.g. MRIcro output in ANALYZE format). Once the lesion is defined, the volume of the lesion is computed, displayed and stored for use in a summary report.
Figure 2.
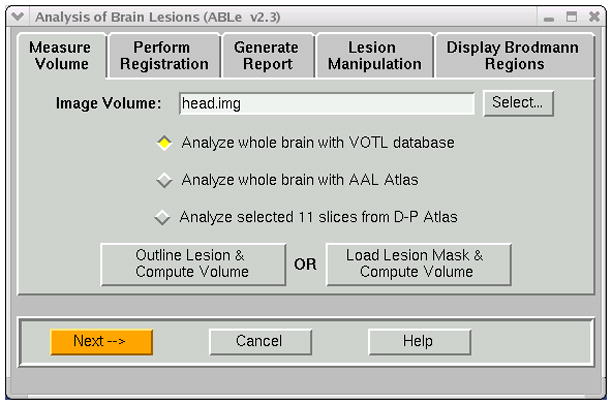
Measure Volume notebook tab of ABLe. User can select atlas and method of defining the lesion.
The brain is automatically skull stripped in order to improve the accuracy of spatial normalization to the MNI template brain. Any gross mis-registration may cause the reporting of structures not actually intersecting the lesion and/or under report structures that are intersecting the lesion.
For MR images, BET [11] is used to deskull the brain. Since this method is not effective on CT images, we use an unpublished automated method that we developed. In this method, the CT brain image is thresholded in a manner which makes the skull appear black, and then the BET algorithm is automatically applied. In ABLe 2.3, the input brain is automatically registered to the T1 MNI brain using AIR 3.08 [12]. There are several known algorithms for effective spatial normalization and this method was chosen due to its robustness when using deskulled brains and its performance, or speed with respect to other methods. Options available for this registration are depicted in Figure 3 and include the ability to exclude the lesion from the registration process, as the template brain contains no corresponding lesion area. There is also an option for manual spatial normalization via placement of Talairach landmarks such as the anterior/posterior commisure. However, automated spatial normalization is the default and has demonstrated robustness across modalities (e.g. CT, MRI) and imaging scanners.
Figure 3.
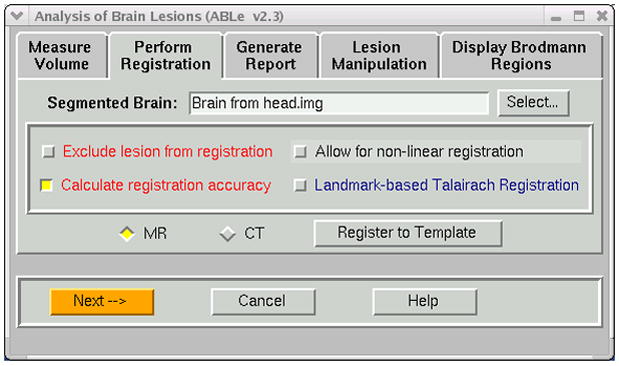
Options available during the registration process include the ability to exclude the lesioned region from the registration process. In addition, one can use landmarks to guide the registration.
The image registration accuracy is determined by qualitative as well as quantitative means. As suggested by Hill et al [13], the most practical method of estimating registration accuracy for a single patient may be to visually inspect the images. This paper suggests that color overlays and difference images classify the registration as a success or failure. ABLe uses a color overlay method to qualitatively describe the registration accuracy, where the subject’s scan is displayed in color over a gray scale template image. For the quantitative measurement, we considered the overlap of voxels between the registered subject brain and the MNI brain template. Both of these images have been deskulled, so corresponding voxels in which one voxel is zero while the other is non-zero indicates mis-registration. The estimate of registration accuracy reported is determined by the following equation:
| (1) |
If the VOTL atlas is chosen, a second spatial transformation is automatically performed which optimally brings the brain into the space of the brain atlas published by Talairach/Tournoux [7]. This piece-wise linear affine transformation was determined by manually selecting the anterior commisure, posterior commisure, anterior/posterior, superior/inferior and left right extents of the T1 MNI single subject brain and applying the transformation described by Talairach/Tournoux. This transformation was saved and is applied as part of the automated registration process in ABLe.
The VOTL atlas database was provided by Jack Lancaster et al at UTHSCSA. We developed a tool which queries this database and returns a list of anatomical structures given a file containing a list of Talairach coordinates. Regions of interest representing anatomic structures were generated based on the report of this program. The efficacy of the transformation into Talairach space may be assessed by overlaying regions of interest, representing Brodmann areas, onto the transformed brain (Figure 4).
Figure 4.
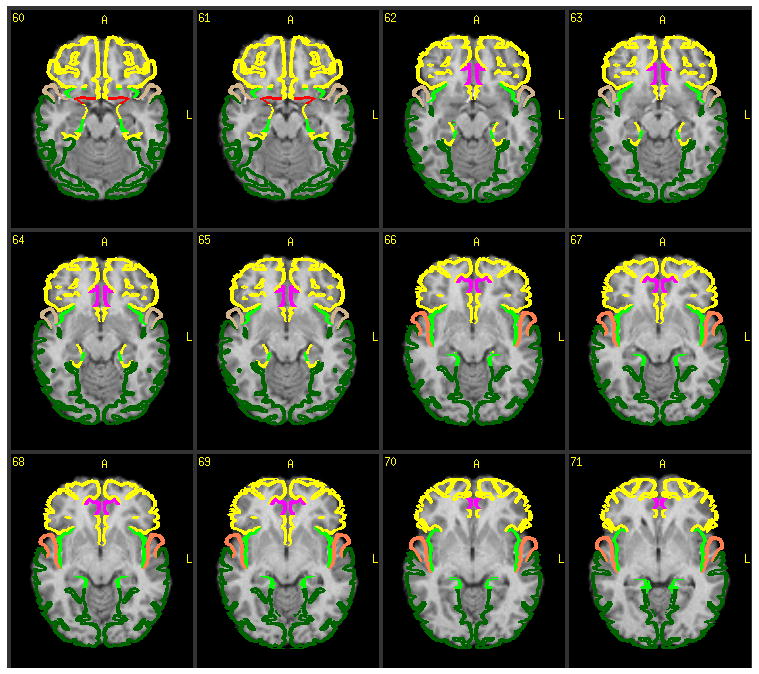
Colored regions of interest representing Brodmann areas are overlaid on top of the subject’s de-skulled MRI. This feature is part of the registration accuracy assessment portion of ABLe 2.3.
The above two transformations required to bring the input brain into Talairach space are applied to the binary image mask representing the traced lesion. Pixel locations in this lesion mask, which is in Talairach space, are sent to the VOTL database to determine anatomic regions intersected by the lesion. These results are reported in a hyperlinked web page as well as an ascii file formatted for excel spreadsheets or a SPSS database.
2.2 Lesion Localization with AAL
If the AAL atlas is chosen, the second spatial transformation into the space of Talairach/Tournoux is not required. This is because the AAL atlas was created on the MNI single-subject brain.
An image representing the AAL atlas was provided by Dr. Tzourio-Mazoyer et al. at Groupe d’Imagerie Neurofonctionnelle, Caen Cedex, France. Each voxel in the image has a value which corresponds to an anatomical structure. This image is spatially aligned with the T1 MNI template brain and also the transformed lesion image. ABLe analyzes the overlap between the transformed lesion image and the AAL image and determines the percentage of each AAL region intersected by the lesion. These results are reported in a hyperlinked web page as well as an ascii file formatted for excel spreadsheets or a SPSS database.
In order to assess the accuracy of the ABLe process, including spatial normalization to a chosen atlas, we had a neuroradiologist (JAB) manually place 1cm diameter spherical synthetic lesions on eloquent cortical areas such as Broca’s (pars triangularis, pars opercularis) and the primary motor cortex “hand knob” on the native CT scans of 8 subjects. We then ran the ABLe procedure using both the VOTL and AAL atlases, to determine the frequency with which these eloquent cortical areas were reported. These results are shown in section 3.1.
2.3 Group Analyses
2.3.1 The Single Group Analysis option of ABLe allows one to answer the question, “Where do at least a certain number of patients (e.g. 8 out of a total of 15) have concurrent lesion location? The Single Group Analysis, shown in Figure 5, reports anatomic structures taken up by overlapping lesions across a group of subjects defined a priori by the investigator. This grouping is typically based on a patient deficit common to all subjects. The anatomical structures reported are based on the choice of atlas made by the user (e.g. VOTL or AAL). Seen in Figure 5 is the option to select the minimum number of subjects that must share a common lesion location. An image map representing overlapping lesions is displayed in color on top of a standard MR image along with the html report of structures. The reports provided by ABLe for these group analyses are discussed and displayed in the Samples of Program Runs section.
Figure 5.

Lesion Manipulation tab allows for analysis of group(s) of patients. Single or two group analysis of a priori groups are possible. A behavior analysis module allows for data driven methods of correlating lesion location with measured deficit.
2.3.2 The Two Group Analysis option is provided to answer the question of double dissociation. In this case, it is known a priori that one patient group shows a specific behavioral deficit “A”, while another group does not show deficit “A” but shows deficit “B”. The first group does not show deficit “B”. For example, one group of patients shows a language deficit in the production of words but has no deficit in language comprehension and another group has no problem with the production of words but has a deficit in language comprehension. We might expect that most of the first group has a lesion in Broca’s area and not in Wernicke’s area and in the second group the opposite might be true. The Two Group Analysis module in ABLe allows the user to specify a minimum number of subjects in each group. The program will determine areas where this minimum number of subjects in group 1 have a lesion and less than the minimum number in group 2 have the lesion. This module will also determine areas where a specified minimum number of patients in group 2 have a lesion and less than the minimum number in group 1. Finally areas where both group 1 and 2 have overlapping lesions are determined. These three image maps which show overlapping lesions on top of a standard MR image are presented along with the html report of structures.
2.3.3 The Behavior Analysis option is an exploratory method of determining correlation between behavioral deficit and lesion status. This technique does not require a priori knowledge of deficit groups as in the methods described above. The Behavior analysis module is an extension of the “Voxel Based Lesion-Symptom Mapping” methods of Bates et al [14]. One must provide ABLe with a text file containing a matrix of behavioral test values. The columns represent the behavioral test scores, while the rows represent the patients. In addition to this file, a group of lesion images, created for each subject by using the Save Lesion Image option in ABLe 2.3, is required. ABLe uses this text file and these lesion images to automatically determine for each voxel, a group of patients that have a lesion and another group that do not have a lesion at this voxel location (see Appendix).
T-tests (one for each behavioral test) are performed for each voxel to see if the behavioral scores for the subjects with a lesion at this voxel location perform significantly worse than patients without a lesion there. A table is produced showing the Talairach coordinates of areas (cluster of voxels) where there is a difference in behavioral score. The user can determine the t-value below which no clusters should be included. Since multiple behavioral tests are analyzed, this table reports the t-values for all behavioral tests for the cluster at this location. A summary report of all structures putatively involved in a given behavior is also generated.
3. SAMPLES OF PROGRAM RUNS
3.1 Single Subject Analysis
In order to demonstrate the results of individual analysis of brain lesions with ABLe 2.3, a MRI scan from a normal volunteer was processed. Figure 4 demonstrates the efficacy of the spatial normalization, or registration process by applying color coded graphics representing Brodmann Areas overlaid on the subject’s registered MRI scan.
If the VOTL atlas is chosen, the web report displays a hierarchical listing of anatomic areas intersected by the lesion as shown in Figures 6A and 6B. The VOTL report is hierarchical and mimics the hierarchical structure of the VOTL database which goes from hemisphere down to cytoarchitecture (Brodmann Areas). If the AAL atlas is chosen, a table displaying the percentage of involvement of the AAL regions is generated.
Figure 6.

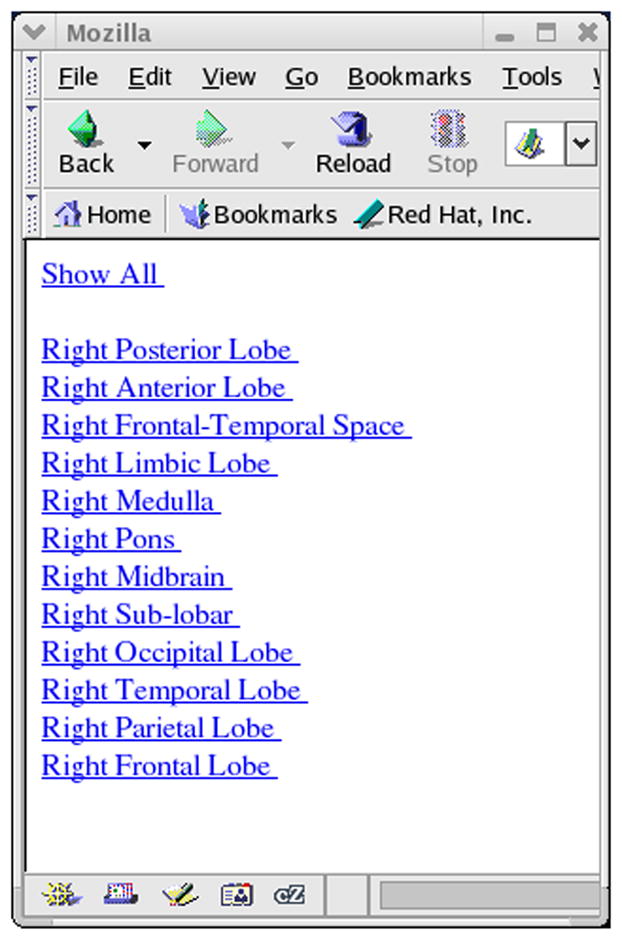
A) Web based report showing lesioned brain areas (VOTL atlas option). Clicking on the hyperlink labeled Right, brings up the hierarchical list of brain structures shown in Figure 6B.
We analyzed the accuracy of the method by placing 1cm spherical synthetic lesions in eloquent cortical areas. Table 1 illustrates the accuracy of the ABLe method. Brain regions as reported by ABLe using both AAL and VOTL atlases are listed for these synthetic lesions. As expected, Broca’s areas (inferior frontal gyrus) and BA 44/45 are involved. Also as expected, the motor cortex (precentral gyrus, BA 4) is involved.
Table 1.
The table illustrates the accuracy of the ABLe method. A neuroradiologist (J.A.B.) placed 1cm spherical synthetic lesions over Broca’s area and the primary motor cortex on the CT scans of 8 subjects. ABLe reports corresponding brain regions from the VOTL and AAL atlases. The report shows good agreement between the synthetic lesion placement and ABLe’s anatomic lesion labeling across these subjects.
| AAL regions | Percent of Subjects | VOTL (BAs) | Percent of Subjects |
|---|---|---|---|
| Precentral | 100% | BA 4 | 100% |
| BA 6 | 62.5% | ||
| Postcentral | 75% | BA 3 | 75% |
| Inferior Frontal Opercularis | 75% | BA 44 | 75% |
| Inferior Frontal Triangularis | 100% | BA 45 | 100% |
| Inferior Frontal Orbital | 37.5% | BA 47 | 50% |
| Insula | 87.5% | BA 13 | 100% |
| Rolandic Operculum | 12.5% | BA 46 | 12.5% |
3.2 Single Group Analysis
A subset of CT images of subjects in the Vietnam Head Injury Study-Phase III was used to describe the group analysis options. This study was conducted at the National Naval Medical Center (Principle Investigator, J.G.). Many of these patients have unilateral lesions on either the left or right side of the brain and predominately in the frontal lobe.
Among other tasks, these patients were administered the Delis-Kaplan battery of executive function tests [15]. 10 of these patients were grouped based on low test scores on the Trail Making test. This test is a number-letter switching task where motor speed is controlled. The patient must draw a line from the letter “A” to the number “1” and then continue the line to the letter “B”, then the number “2”, etc. The 10 patients took significantly longer to complete the task than the mean time for normal subjects. The lesions of these patients were used in the Single Group Analysis that is part of the Lesion Manipulation tab in ABLe 2.3. Figure 7 shows the fused image output from this module. The areas shown in color represent overlap in lesions from multiple patients. The color scale represents the number of patients showing lesions at that location with yellow indicating a greater number of patients than orange. This module also produced an html report indicating the anatomic structures involved. The report for this analysis shows that Brodmann areas 10 and 32 are involved for many of these subjects who tested poorly. This agrees with previous studies of executive functions [16].
Figure 7.
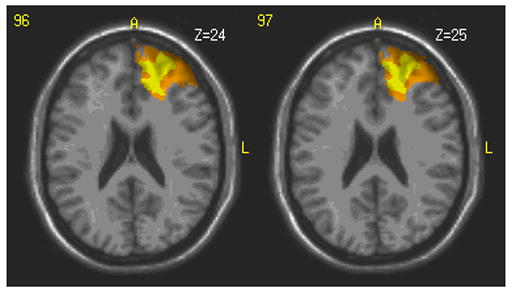
Regions shown in color represent areas where multiple patients within the selected group have a lesion. The yellow color indicates a larger number of patients with a lesion at that location. This location involves left hemisphere Brodmann areas 10 and 32.
3.3 Behavior Analysis
To demonstrate the use of the Behavior Analysis module in ABLe 2.3, we have chosen a subset of the 10 patients mentioned above and 4 patients from a group that did not show deficit in the Delis number-letter switching task. The Delis number-letter switching task as well as two other behavioral task scores was input into the Behavior Analysis module along with the lesion images. The two other behavioral tests involved visual scanning and auditory processing and were thought to be independent of the number-switching task. Figure 8 shows a section of the generated report in tabular form. In this report, the coordinates (Tal_x, Tal_y and Tal_z) represent a 3-dimensional location in Talairach space from a cluster of voxels. This location represents the most inferior location of the cluster and does not represent its centroid because the centroid is not guaranteed to have the same t-value. A group of patients with lesions at this location performed poorly on the Delis trail making task compared to patients who do not have a lesion at that location. The colorized image, seen in Figure 9, is generated by ABLe to show where these clusters are located on a MR image in MNI space (single-subject MNI template). The behavioral scores for two other neuropsychological tests were also included just to show that any number of tests can be analyzed simultaneously and that these areas are not shown to be as involved in the other behavioral tasks.
Figure 8.
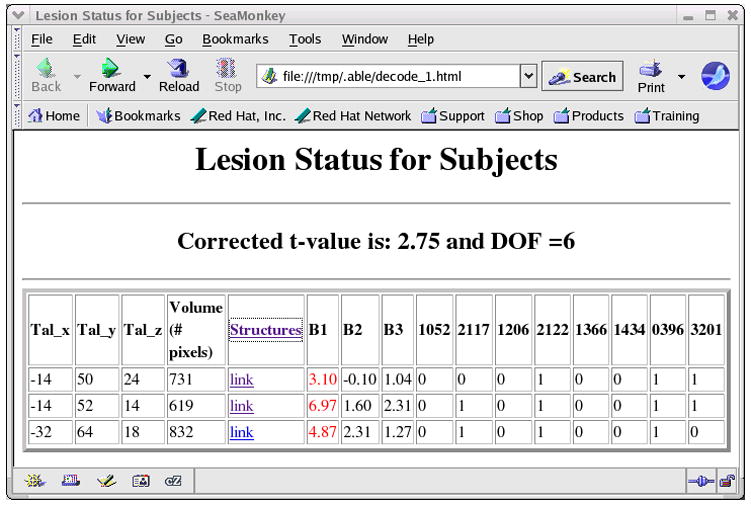
Table showing Talairach coordinates of areas on the lesion where subjects had overlapping lesions and also scored significantly worse on the number-switching task (B1) compared to patients who did not have a lesion at that location.
Figure 9.
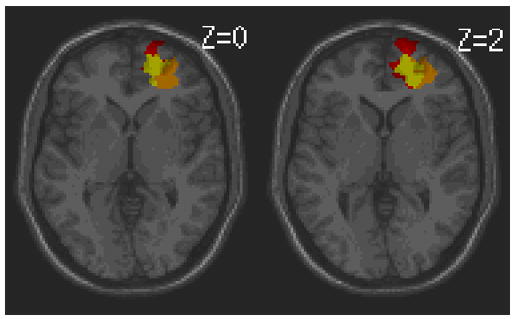
Colorized image corresponding with the report in Figure 8. The three colored areas illustrate the anatomic location where subjects with overlapping lesions performed poorly on the Delis trail making task. The slice position in Talairach space is provided.
In this example, the lesions were analyzed in the AAL atlas mode. Selecting the Structures link in the html report produces a summary report as shown in Figure 10 which lists all AAL regions putatively involved in the behavioral deficit. In this summary report, the percentage of each AAL region is reported as well as the maximum T-values and maximum effect sizes (Cohen’s d) [17] in the region. Small effects (0.2 < d < 0.5) will be seen in green, medium effects (0.5 < d < 0.8) will be seen in magenta and large effects (d > 0.8) in blue.
Figure 10.

Summary report showing all areas putatively involved in the Behavior 1 deficit. The fraction of the AAL region is listed as well as the maximum t-value in that region. Cohen’s d is reported as an effect size measure. The blue color indicates a large effect size.
4. DISCUSSION
The Analysis of Brain Lesions (ABLe) program is a semi-automated method of characterizing brain lesions. In certain situations it is not advisable for a patient to have an MRI as is the case when a patient has an intracranial metal plate or retained metal in the brain from shell fragments. In this situation, x-ray computed tomography (CT) images of the brain can be safely acquired. ABLe supports both MRI and CT scans.
Since the time of the original publication [2], ABLe has been enhanced by adding methods requested by the clinical neuroscience user community. These include spatial normalization to the MNI template brain, and use of the VOTL and AAL brain atlases. The level of group analysis has been supplemented by allowing for two-group (double dissociation) and behavioral analysis, an extension of the work performed by Bates et al [14]. An advantage of the two group analysis is that a control group (patients with brain lesions but with a different deficit from the primary group of interest) can be included in the lesion analysis as suggested by Rorden et al [18]. An advantage of the Behavioral Analysis module is that it can be used in an exploratory analysis. One does not need a priori knowledge of a deficit from a group of patients as was required for the Single Subject Analysis.
The modularity of the ABLe program has allowed for additional improvements such as the importation of lesion masks created from 3rd party software (e.g. MRIcro). This modularity will support future additions to ABLe which may include probabilistic brain atlases as described by Eickhoff et al [19], and a method of hierarchical clustering to group patients with similar Brodmann area involvement.
The techniques described herein improve previous methods of brain lesion analysis. In the not so recent past, a template of brain structures printed on a transparency was overlaid on a MRI film to assess which structures intersect with the brain lesion. Inaccuracies were caused by the fact that the size of the brain and its orientation in the MRI scan was often different from the template on the transparency. In recent years, other software packages have also been developed to characterize brain lesions using digital atlases. MRIcro is widely available and allows the user to trace lesions either on the subject’s brain image or directly on the template brain image. Tracing on the subject’s brain requires this image to be spatially normalized. This spatial normalization process is not part of MRIcro and the user is suggested to perform this operation using the SPM software package [20]. This process is available for MRI and not CT data. On the other hand, tracing the lesion directly on the MNI template brain removes the step of spatial normalization but requires more expertise of the user and may incorporate more bias than direct tracing on the native MRI. ABLe incorporates the spatial normalization process with the click of a single button and allows for both MRI and CT image data. MRIcro allows for group analysis by subtracting overlapping lesions from a control group with overlapping lesions from a group that has a deficit of interest. ABLe performs a similar operation in the “Two Group Analysis” mode. In addition, ABLe provides data driven group analysis via an extension of the voxel based lesion symptom-mapping method (Behavior Analysis module in ABLe). ABLe has the choice of 3 digital atlases and contains reporting features, including percentage of structures intersected by the lesion which are available in html or ascii text format for spreadsheet use. ABLe has improved visualization allowing for the user to see the spatially normalized MRI containing the lesion with a Brodmann area overlay. The user may choose to overlay all Brodmann areas at once or select from a list.
The Brainvox package, published in 1997 [6] was designed to be interactive 3-D brain imaging software to investigate subjects with acquired lesions. Like ABLe, this software has a point and click graphical user interface and includes a slice/contour based tracing module for delineation of the lesion. Based on manually defined anatomic landmarks, the software transfers the tracings from the subject brain to a template brain. Brainvox supports superposition of lesions from a group of subjects in a common space. This is similar to ABLe’s single group Analysis module. With their MAP-3-NP module, Brainvox shows the probability that a lesion is associated with a deficit. ABLe supports the voxel based lesion-symptom mapping (VLSM) method for this form of statistical analysis. Brainvox was developed on the SGI UNIX system and is not widely available. ABLe software is supported on SGI as well as Linux, Mac OSX and Sun Solaris platforms and is widely available to researchers. The importance of the development of Brainvox should be stated as it paved the way for analyzing brain lesions with digital images using group lesion overlay as well as lesion-deficit probabilistic associations.
A software and database system known as BRAID (Brain Image Database) [7] was developed for the clinical purpose of understanding brain structure-function relationships (e.g. anatomic correlates of deficit). Like ABLe, the input to BRAID is manually delineated lesions on MRI scans which are then registered to the Talairach coordinate system. These lesion volumes are computed with proprietary software and the registration is performed outside of BRAID. ABLe contains both of these functions as part of an integrated package. Both BRAID and ABLe have several digital atlases to choose from and compute lesion fraction per anatomic structure. ABLe also computes percentage of the structure intersected by the lesion. BRAID visualizes the lesion on top of the atlas. ABLe includes the high resolution MRI as well as the atlas in this visualization. The BRAID supports statistical lesion-deficit reporting via contingency testing with a chi-squared test, whereas ABLe utilizes the voxel based lesion-symptom mapping method. The BRAID system is not widely available for researchers.
While there is some overlap in the functionality of these programs, we believe that ABLe has a richer feature set allowing the researcher flexibility in defining the lesion, choosing a brain atlas, and performing a series of group analyses.
There are certain limitations associated with semi-automated lesion analyses. Tracing lesion margins is difficult because these borders may be poorly defined. Manual tracing also introduces intra/inter-user variability. Automation in lesion delineation is difficult because in CT, lesions often have overlapping intensity values (i.e. Hounsefiled units) with cerebral spinal fluid and may be connected with ventricles making their automatic segmentation complex. A suggestion is to have the same 1 or 2 individuals perform the ABLe analyses. These individuals could be technologists with experience in neuroanatomy.
Imperfect image registration (spatial normalization) to a brain template may cause inaccuracies in the fraction of structures reported as intersecting with the lesion. Individual variation can also cause a misclassification of intersecting structures. These include the fact that the location and extent of cytoarchitectural structures may differ among individuals. There is some evidence that this may be more prominent in some structures such as frontal association areas [19]. Our results from placing 1cm diameter spherical synthetic lesions in Broca’s area and the primary motor cortex (Table 1) demonstrate the accuracy of the ABLe method. However, while one of these lesions was placed on the precentral gyrus, the postcentral gyrus and BA 3 are reported. This is because the border of the pre- and post-central gyrus is variable across subjects and the AIR registration process used in ABLe is a 12 parameter linear fit which does not warp each gryal pattern to match the template. The reporting of BA 3 represents one of the limitations of the method. However, while there are 64 regions in the AAL atlas and 47 Brodmann areas, only the structures listed below were reported by ABLe. This demonstrates the accuracy of our neuroradiologist in finding Broca’s area and the primary motor strip on CT images as well as the total ABLe process of spatial normalization to the MNI target brain and integration of the VOTL and AAL atlases.
In cases of brain tumors or ex vacuo phenomena with stroke, the lesion may deform the normal brain anatomy via a mass effect. Under these circumstances, displaced brain structures will not be aligned with their corresponding location on the brain atlas, thus introducing error in the reporting of structures or percentage of structures intersecting the lesion. In these situations, incorporating methods of atlas deformation such as those developed by Cuadra et al [21] may improve the accuracy of our method. Nevertheless, ABLe 2.3 provides an improved technique to semi-automatically characterize human brain lesions in MRI and CT scans.
A primary design goal of the ABLe software was user friendliness. This was accomplished by developing a graphical user interface (GUI) that simplifies the lesion characterization workflow from lesion definition to final summary report. The ABLe GUI was developed using ImageScript, which is an extension of the TCL/TK scripting language and serves as the MEDx API. In addition, several functions in ABLe were coded in the C and C++ programming languages and have been compiled on Linux and Solaris platforms. The ABLe software is available for researchers to use as it is a module in the MEDx image analysis and visualization software package, which has worldwide distribution. The development of ABLe is ongoing as a collaborative project with several institutes at the National Institutes of Health. Improvements to this program based on recommendations from the community are welcome via the following list serv (https://list.nih.gov/archives/able-l.html).
Acknowledgments
The authors would like to thank Robert Steagall of Medical Numerics, Inc. for his work on integrating the VOTL database into the MEDx visualization and analysis software and thereby making it accessible to the ABLe 2.3 program.
APPENDIX
As part of the Behavior Analysis module, ABLe automatically determines which subjects have a lesion at a given pixel and which do not. This is accomplished by summing the individual lesion images onto a single image. The summing is done in such a way that decoding of this summed image can produce a list of subjects with and without a lesion independently for each voxel. One starts with a blank base image with the same matrix size as the lesion images (e.g. 91×109×91). The lesion image of the first subject is added to the base image such that the pixel intensity where there is lesion is 20 (or 1) and 0 everywhere else. When the lesion image of the second subject is added, the pixel intensity where there is lesion is 21. The pixel intensity of the lesion in the third subject is 22. Finally the pixel intensity of the nth lesion is 2n−1 where n is the subject number. Once the lesion images for all subjects are added to the base image, a bit string is reported for each voxel based on the binary representation of the pixel intensity. For example, if the pixel intensity in the base image is 13, the bit string (or binary representation) for 13 is 1101. This indicates that the first subject as well as the third and fourth subjects have a lesion at this location. Since the second bit from the right is 0, the second subject does not have a lesion at this location. By supporting multiple base images, we can circumvent the problem of running out of bits (e.g. 32 on a 32bit machine).
Footnotes
Publisher's Disclaimer: This is a PDF file of an unedited manuscript that has been accepted for publication. As a service to our customers we are providing this early version of the manuscript. The manuscript will undergo copyediting, typesetting, and review of the resulting proof before it is published in its final citable form. Please note that during the production process errors may be discovered which could affect the content, and all legal disclaimers that apply to the journal pertain.
References
- 1.Damasio H, Damasio A. Lesion Analysis in Neuropsychology. Oxford University Press; New York, Oxford: 1989. [Google Scholar]
- 2.Makale M, Solomon J, Patronas N, Danek A, Butman J, Grafman J. Quantification of Brain Lesions Using Interactive Automated Software. Behavior Research Methods, Instruments, and Computers. 2002;34(1):6–18. doi: 10.3758/bf03195419. [DOI] [PubMed] [Google Scholar]
- 3.Mah L, Arnold M, Grafman J. Impairment of social perception associated with lesions of the prefrontal cortex. The Americal Journal of Psychiatry. 2004;161:1247–1255. doi: 10.1176/appi.ajp.161.7.1247. [DOI] [PubMed] [Google Scholar]
- 4.Wood J, Tierney M, Bidwell L, Grafman J. Neural correlates of script event knowledge: A neuropsychological study following prefrontal injury. Cortex. 2005;41:796–804. doi: 10.1016/s0010-9452(08)70298-3. [DOI] [PubMed] [Google Scholar]
- 5.Rorden C, Brett M. Stereotaxic display of brain lesions. Behavioural Neurology. 2000;12:191–200. doi: 10.1155/2000/421719. [DOI] [PubMed] [Google Scholar]
- 6.Frank R, Damasio H, Grabowski TJ. Brainvox: an interactive, multimodal visualization and analysis system for neuroanatomical imaging. NeuroImage. 1997;5(1):13–30. doi: 10.1006/nimg.1996.0250. [DOI] [PubMed] [Google Scholar]
- 7.Herskovits E, Megalooikonomou V, Davatzikos C, Chen A, Bryan RN, Gerring J. Is the Spatial Distribution of Brain Lesions Associated with Closed-Head Injury Predictive of Subsequent Development of Attention-Deficit/Hyperactivity Disorder? Analysis with Brain-Image Database. Radiology. 1999;213:389–394. doi: 10.1148/radiology.213.2.r99nv45389. [DOI] [PubMed] [Google Scholar]
- 8.Lancaster JL, Woldorff MG, Parsons LM, Liotti M, Freitas CS, Rainey L, Kochunov PV, Nickerson D, Mikiten SA, Fox PT. Automated Talairach Atlas labels for functional brain mapping. Human Brain Mapping. 2000;10:120–131. doi: 10.1002/1097-0193(200007)10:3<120::AID-HBM30>3.0.CO;2-8. [DOI] [PMC free article] [PubMed] [Google Scholar]
- 9.Tzourio-Mazoyer N, Landeau B, Papathanassiou D, Crivello F, Etard O, Delcroix N, Mazoyer B, Joliot M. Automated Anatomical Labeling of Activiationsin SPM Usinga Macroscopic Anatomical Parcellation of the MNI MRI Single-Subject Brain. NeuroImage. 2002;15:273–289. doi: 10.1006/nimg.2001.0978. [DOI] [PubMed] [Google Scholar]
- 10.Talairach J, Tournoux P. Co-planar stereotaxic atlas of the human brain. Thieme; New York: 1988. [Google Scholar]
- 11.Smith S. Fast robust automated brain extraction. Human Brain Mapping. 2002;17(3):143–155. doi: 10.1002/hbm.10062. [DOI] [PMC free article] [PubMed] [Google Scholar]
- 12.Woods RP, Grafton ST, Watson J, Sicotte NL, Mazziotta JC. Automated image registration: II. Intersubject validation of linear and nonlinear models. Journal of Computer Assisted Tomography. 1998;22:153–165. doi: 10.1097/00004728-199801000-00028. [DOI] [PubMed] [Google Scholar]
- 13.Hill D, Batchelor P, Holden M, Hawkes D. Medical image registration. Physics in Medicine and Biology. 2001;46:R1–R45. doi: 10.1088/0031-9155/46/3/201. [DOI] [PubMed] [Google Scholar]
- 14.Bates E, Wilson S, Saygin A, Dick F, Sereno M, Knight R, Dronkers N. Voxel-based lesion-symptom mapping. Nature Neuroscience. 2003;6(5):448–450. doi: 10.1038/nn1050. [DOI] [PubMed] [Google Scholar]
- 15.Delis DC, Kaplan E, Kramer JH. Delis-Kaplan Executive Function System examiner’s manual. San Antonio, TX: The Psychological Corporation; 2001. [Google Scholar]
- 16.Sylvester CY, Wager TD, Lacey SC, Hernandez L, Nichols TE, Smith EE, Jonides J. Switching attention and resolving interference: fMRI measures of executive functions. Neuropsychologia. 2003;41(3):357–70. doi: 10.1016/s0028-3932(02)00167-7. [DOI] [PubMed] [Google Scholar]
- 17.Howell D. Statistical Methods for Psychology. 5. Brooks/Cole Pub Co; 2001. [Google Scholar]
- 18.Rorden C, Karnath H. Using human brain lesions to infer function - a relic from a past era in the fMRI age? Nature Reviews Neuroscience. 2004;5:813–819. doi: 10.1038/nrn1521. [DOI] [PubMed] [Google Scholar]
- 19.Eickhoff S, Stephan K, Mohlberg H, Grefkes C, Fink G, Amunts K, Zilles K. A new SPM toolbox for combining probabilistic cytoarchitectonic maps and functional imaging data. NeuroImage. 2005;25:1325–1335. doi: 10.1016/j.neuroimage.2004.12.034. [DOI] [PubMed] [Google Scholar]
- 20.Frackowiak RSJ, Friston KJ, Frith C, Dolan R, Friston KJ, Price CJ, Zeki S, Ashburner J, Penny WD, editors. Human Brain Function. 2. Academic Press; 2003. [Google Scholar]
- 21.Cuadra MB, Pollo C, Bardera O A, et al. Atlas-Based Segmentation of Pathological MR Brain Images Using a Model of Lesion Growth. IEEE Transactions on Medical Imaging. 2004;23(10):1301–1314. doi: 10.1109/TMI.2004.834618. [DOI] [PubMed] [Google Scholar]