

Abstract
CREM belongs to the ATF/CREB family of basic leucine zipper transcription factors. We previously showed that PTH induces ICER (inducible cAMP early repressor) in osteoblasts. ICER proteins, which are transcribed from the P2 promoter of the CREM gene, act as transcriptional attenuators. The objective of this study was to determine whether the Crem gene plays a role in the response of bone to intermittent PTH. Adult Crem knockout (KO) and wild type (WT) male mice were given daily subcutaneous injections of vehicle or hPTH(1–34) (160 μg/kg) for 10 days. Bone mineral content and density (BMC and BMD, respectively) were measured in femur and tibia by dual energy X-ray absorptiometry (DEXA). Bone morphometry was analyzed by X-ray computed microtomography (microCT) and histomorphometry. Serum bone turnover markers were measured. In vitro osteoclast formation assays were performed in bone marrow cultures treated with PTH or the combination of RANKL and M-CSF. KO mice had slightly higher basal bone mass than wild type mice. PTH treatment increased tibial BMC and BMD to a greater extent in WT mice compared to KO mice. PTH increased both cortical area and trabecular bone area in WT but not in KO femurs. PTH increased the bone formation rate and percent osteoblast surface to the same extent in femurs of WT and KO mice but increased osteoclast parameters and calvarial porosity to a greater extent in KO mice. PTH increased serum osteocalcin levels to the same extent in WT and KO mice. PTH-induced osteoclast formation was 2-fold greater in bone marrow cultures from KO mice. Collectively, our data suggest that the Crem deficiency in mice alters the response of bone to intermittent PTH treatment such that osteoclastogenesis is increased. Crem gene may specify the anabolic response to intermittent PTH treatment by restraining PTH-induced osteoclastogenesis.
Keywords: osteoblast, osteoclast, bone resorption, bone mass acquisition, PTH, CREM, ICER
INTRODUCTION
CREM belongs to the CREB/CREM/ATF family of basic leucine zipper transcription factors that bind to cAMP response elements (CREs) in the regulatory regions of cAMP-responsive genes (1). CREM transcription factors play an important role in a variety of physiological systems including cardiac function (2,3), circadian rhythms (4) and locomotion (5). However, CREM is most notable for its role in fertility as male CREM deficient mice have a block in the maturation of sperm (6,7).
The structure and regulation of the Crem gene are highly complex. Crem contains four known promoters encoding a variety of alternatively spliced transcripts that are expressed in a tissue-specific pattern during development and postnatal life (1,8). CREM factors can function as either activators or inhibitors of transcription depending on whether or not they contain specific domains for transactivation and serine phosphorylation (1). The most upstream of Crem’s four promoters (P1) is thought to be constitutively active (9). By contrast, the intronic P2 promoter located near the 3’ end of the Crem gene directs the transcription of four inducible products collectively called ICER (4). Recently, two newly-identified promoters, P3 and P4, have been shown to direct expression of Crem isoforms in testes (8).
The well-described anabolic effect of intermittent PTH on bone mass acquisition has been documented in rats (10), mice (11), monkeys (12) and humans (13). These observations have been pivotal to the development of PTH as an anabolic therapy for treating osteoporosis (14). However, the cellular and molecular mechanisms underlying the anabolic effect of PTH on bone are still unresolved. Cells of the osteoblast lineage contain PTH receptors and serve as the primary target cells of PTH signaling in bone (15). Although PTH activates both the cAMP-protein kinase A (PKA) and PKC pathways in osteoblasts, cAMP-PKA signaling has been shown to be critical for the anabolic effect of PTH on bone mass acquisition (16,17). It is shown that the time course of RANKL and OPG expression is different between acute and sustained PTH treatment in mice (18). This suggests that the anabolic effect of intermittent PTH on bone may be related to the kinetics of gene expression in response to PTH.
We previously showed that PTH induces ICER expression in osteoblasts in vitro and in vivo (19). The induction is rapid and transient and highly restricted to agents that signal through the cAMP-PKA pathway (20). ICER proteins contain a DNA binding domain but they are devoid of transcriptional activation and phosphorylation domains (4). Thus, ICER proteins function as powerful transcriptional repressors by binding to CREs and blocking their access to transcriptional activators. The availability of Crem KO mice provided a model to test the hypothesis that CREM/ICER factors play a role in regulating PTH responses in bone.
MATERIALS AND METHODS
Animals
Crem KO mice were previously developed in a mixed genetic background (129Sv/C57BL/6) and kindly provided by Dr. Gunter Schutz (7). This model should have a disruption of all functional CREM isoforms. All animal care protocols were reviewed and approved by the University of Connecticut Health Center Animal Care Committee. We established heterozygous KO breeding units to generate WT and KO littermates. Because the litter sizes were small, we also established homozygous KO-heterozygous KO and WT-WT breeding units to generate additional experimental animals. In both cases, the results were similar and data from all breeding units were pooled. WT and KO male mice were given daily subcutaneous injections of vehicle (1 mg/ml BSA in acidified with 0.01 M acetic acid) or 160 μg/kg body weight of hPTH(1–34) (Bachem, Torrance, CA) dissolved in the same vehicle. There were 20-24 mice per group for the measurements of bone BMD and bone morphometry by microCT, 13–16 per group for static histomorphometry and 8–9 per group for dynamic histomorphometry. For dynamic histomorphometry, mice were given intraperitoneal injections of calcein (10 mg/kg) and xylenol orange (90 mg/kg) six days and two days, respectively, prior to sacrifice.
Bone density and morphometry
Bone mineral content (BMC) and bone mineral density (BMD) of whole dissected femurs and tibiae were measured by DEXA using a PIXImus densitometer (GE-Lunar, Madison, WI). Morphometry of calvaria and the trabecular and cortical compartments of femurs was quantified using conebeam X-ray computed microtomography (μCT40, Scanco Medical AG, Bassersdorf, Switzerland). Serial tomographic images were acquired at 55 kV and 145 μA, collecting 1000 projections per rotation at 300 msec integration time. Three-dimensional images were reconstructed using standard convolution back-projection algorithms with Shepp and Logan filtering, and rendered within a 12.3 mm field of view at a discrete density of 578,704 voxels/mm3 (isometric 12-μm voxels). Segmentation of bone from marrow and soft tissue was performed in conjunction with a constrained Gaussian filter to reduce noise, applying density thresholds of 350 mg/cm3 and 260 mg/cm3 for the cortical and trabecular compartments of the femur, respectively, and 330 mg/cm3 for calvaria. Volumetric regions for trabecular analysis were selected within the endosteal borders of the distal femoral metaphysis to include the secondary spongiosa located 960 μm (~6% of length) from the growth plate and extending 1 mm proximally. Trabecular morphometry was characterized by measuring the bone volume fraction (BV/TV), trabecular thickness (TbTh), trabecular number (TbN), and trabecular spacing (TbSp). Cortical morphometry was quantified and averaged for fifty serial cross-sections (600 μm) extending distally from the diaphyseal mid-point between proximal and distal growth plates. Cortical measurements included average cortical thickness, cross-sectional area of cortical bone, sub-periosteal cross-sectional area, and marrow area. Calvarial morphometry was quantified and averaged for ten serial cross-sections (120 μm) within the central coronal plane of the parietal bones, transverse to the sagittal suture. Calvarial thickness and porosity (marrow space) were measured within the central third (~2100 μm length) of each half of the parietal arch between the sagittal and squamous sutures (Figures 6A and B).
Figure 6.
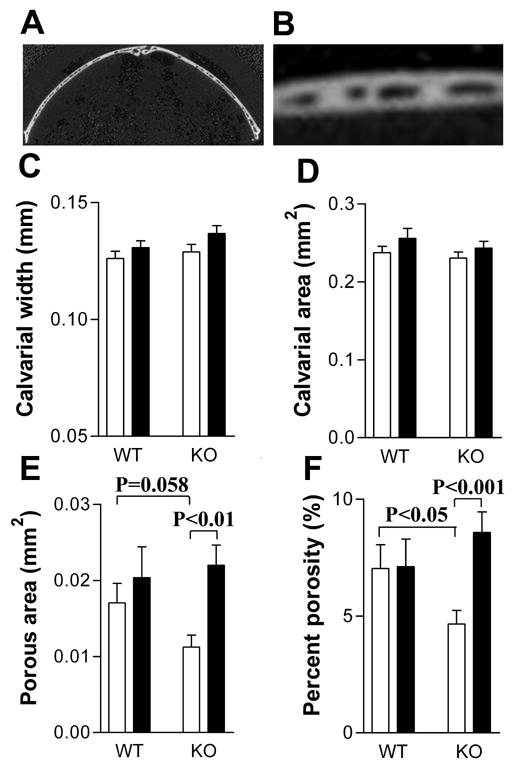
PTH increased calvarial porosity in CREM KO mice. Calvarial parameters in the mice shown in Figure 1 were measured by microCT. (A) A coronal section of the parietal bone, transverse to the sagittal suture; (B) Higher magnification of the center part of the left side of the section shown in (A) to show the porous spaces measured; (C) Calvarial thickness; (D) Calvarial area; (E) Calvarial porosity; (F) Percent calvarial porosity. Data are expressed as Mean ± SEM. White bars represent vehicle-treated mice. Black bars represent PTH-treated mice. Data were analyzed by two-way ANOVA followed by individual t-tests.
Histomorphometry
Static and dynamic histomorphometry were performed as described previously (21). All static and dynamic parameters were measured according to the Report of the American Society of Bone and Mineral Research Histomorphometry Nomenclature Committee (22).
Serum bone turnover markers
Serum osteocalcin was measured by radioimmunoassay using a goat anti-mouse osteocalcin antibody as previously described (23). The C-terminal telopeptide of α1(I) collagen was measured by an enzyme-linked immunosorbent assay (ELISA) using a RatLaps kit (Nordic Bioscience Diagnostics, A/S).
Osteoclast formation in bone marrow cultures
Femurs and tibiae from 10- to 11-week-old mice were dissected from surrounding tissues. The epiphyseal growth plates were removed and marrow collected by flushing with serum free α-modified essential medium (α-MEM) containing 100 U/ml penicillin and 100 μg/ml streptomycin with a 25-gauge needle. Cells were cultured in α-MEM containing 10% heat inactivated fetal bovine serum (HI-FBS). For PTH treatment (100 ng/ml), cells were plated in 48-well dishes at 1 x 10⁶ cells/well. For M-CSF and RANKL (each at 30 ng/ml) treatment, cells were plated in 48-well dishes at 2.5x10⁵ cells/well. The medium was changed on day 3. Osteoclast formation was measured at each time point as the number of tartrate resistant acid phosphatase (TRAP) positive cells containing 3 or more nuclei as previously described (24).
CFU-GM assay
Bone marrow cells were plated at 50,000 cells per dish (35 x 10 mm cell culture dish with a 2 mm grid, Nalge Nunc International) in 1 ml 1.5% methylcellulose supplemented with 20% HI-FBS, and 1.0 ng/ml GM-CSF (R&D System, Minneapolis, MN). After 6 days, CFU-GM colonies (>40 cells) were counted.
Statistics
Data was analyzed with t-tests or two-way ANOVA followed by Bonferroni post-tests or paired t-tests as indicated in the text and individual figure legends.
RESULTS
Eleven- to twelve-week-old male Crem KO and WT mice were treated with PTH or vehicle once daily for ten days and measurements were made one day after the final dose. There was no difference in body weight between KO mice and WT mice at the beginning of the experiment. PTH treatment resulted in a small but significant increase in body weight in both genotypes, from 26.7 ± 2.0 to 27.3 ± 1.8 g in WT and 26.7 ± 2.0 to 27.7 ± 2.1 g in KO mice (p<0.05 for both groups, paired t-test). There was no weight change in vehicle-treated mice (not shown).
We first examined differences between vehicle-treated WT and KO mice as evidence of a basal bone phenotype (Figures 1A–D). Vehicle-treated male KO mice showed a trend toward higher BMC in femur (Figure 1A, p = 0.09) and significantly higher BMC in tibiae (Figures 1B) compared to the vehicle-treated WT mice. Baseline BMD was not different between KO and WT femurs (Figure 1C) but was significantly greater in KO tibiae (Figure 1D). These data suggested that Crem KO mice might have higher basal long bone mass. The response of WT and KO bones to the PTH was expressed as the percent increase in BMC and BMD compared to vehicle-treated animals of the same genotype (Figures 1E–H). The effect of PTH on BMC was greater in femurs and tibiae of WT mice (Figures 1E and F, respectively). The effect of PTH on BMD was also higher in tibiae of WT mice (Figure 1H), and a similar trend was observed for the effect of PTH on femural BMD (Figure 1G, p=0.09). These data suggested that Crem KO mice had a blunted response to PTH.
Figure 1.

CREM deficiency blunted the PTH-induced increase in BMC and BMD of femur and tibia. Mice (20–24 per group) were given daily injections of vehicle or 160 μg/kg body weight of hPTH(1–34) dissolved in vehicle for 10 days. BMC and BMD were determined by DEXA one day after the last injection. A–D show data for vehicle-treated mice: (A) Femoral BMC; (B) Tibial BMC; (C) Femoral BMD; (D) Tibial BMD. E–H show data for the percent increase of BMC or BMD in response to PTH treatment in KO and WT mice. (E) Femur BMC; (F) Tibia BMC; (G) Femur BMD; (H) Tibia BMD. Data are expressed as Mean ± SEM. White bars represent WT mice. Black bars represent KO mice.
To further analyze the response of Crem KO mice to PTH, cortical bone morphometry of femurs was analyzed by microCT (Figure 2). PTH treatment enhanced femoral cortical thickness, cortical area and subperiosteal area in WT mice (Figures 2A, B and C, respectively), but these changes were not seen in KO mice. Interaction analysis by two-way ANOVA indicated that WT and KO mice responded significantly different to PTH in cortical area (p=0.01) and subperiosteal area (p=0.01) and had a trend to respond differently to PTH in bone marrow area (p=0.08). PTH did not alter femoral bone marrow area in either genotype (Figure 2D). Thus, the increase in cortical area in WT femurs was caused periosteal by expansion but this did not occur in KO femurs. We noted that vehicle-treated KO femurs were bigger than WT femurs, having greater cortical area, subperiosteal area and bone marrow area than WT femurs (Figures 2B, C and D, respectively).
Figure 2.
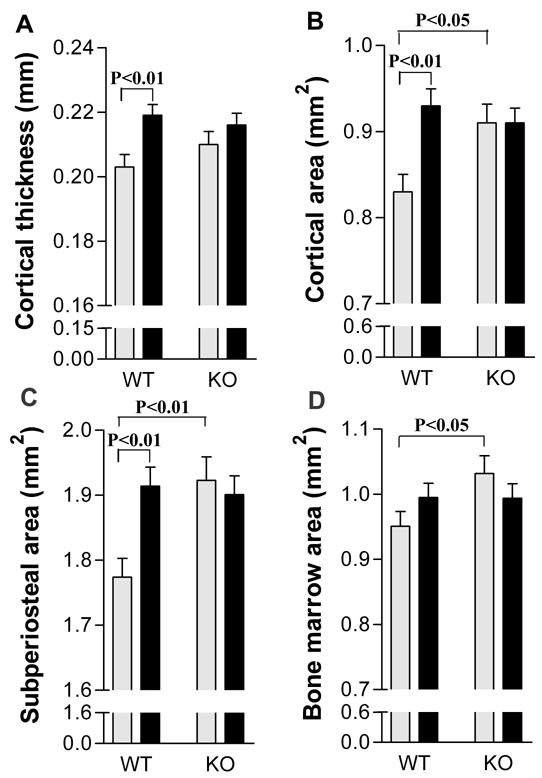
CREM deficiency blunted the PTH-induced increase in cortical area by preventing periosteal expansion. Cortical parameters in femurs from the same mice used for Figure 1 were determined by microCT. (A) Cortical thickness; (B) Cortical area; (C) Subperiosteal area; (D) Marrow area. Data are expressed as Mean ± SEM. Grey bars represent the vehicle-treated groups. Black bars represent the PTH-treated group. Data were analyzed by two-way ANOVA followed by individual t-tests.
As shown by histomorphometry, PTH significantly increased trabecular bone area in WT femurs but not in KO femurs (Figures 3A). PTH significantly increased trabecular thickness in both genotypes (Figure 3B) but to greater extent in WT (26.3%) than in KO (14.2%). PTH did not affect trabecular number and spacing in either genotype (Figures 3C and D, respectively). MicroCT analysis of femurs showed similarities and differences in the pattern of response. PTH treatment resulted in a significant increase in femoral trabecular bone volume in WT but not in KO mice (Figure 3E). PTH caused an increase in trabecular thickness in both genotypes but in slightly greater extent in WT (18.4%) than in KO (14.6%) mice (Figure 3F). In addition, PTH caused a small but significant decrease in trabecular number in both genotypes but to greater extent in KO (6.9%) than in WT mice (4.7%) (Figure 3G). There was also a significant increase (8.1%) in femoral trabecular spacing in KO but not in WT mice (Figure 3H). The effect of PTH on trabecular parameters in vertebrae showed a similar pattern of response (not shown).
Figure 3.

CREM deficiency blunted the PTH-induced increase in femoral trabecular bone volume. Trabecular parameters in femur were analyzed by static histomorphometry (A–D) or microCT (E–H). For microCT, the bones were the same as those shown in Figures 1 and 2. For static histomorphometry, a subset of the bones shown in Figures 1 and 2 were used (n=13–16). Trabecular bone area per total tissue area (BA/TTA); Trabecular bone volume per tissue volume (BV/TV); Trabecular thickness (TbTh); Trabecular number (TbN); Trabecular spacing (TbSp). Data are expressed as Mean ± SEM. White bars represent the vehicle-treated groups. Black bars represent the PTH-treated group.
To determine whether the blunted anabolic effect of PTH in KO mice was due to a deficit in the bone formation response, dynamic histomorphometric measurements of femurs were performed following sequential calcein and xylenol orange injections. PTH treatment resulted in a nearly 90% increase in percent osteoblast surface in both genotypes (Figures 4A). PTH increased the mineral apposition rate (Figure 4B) and bone formation rate (Figure 4C) to the same extent in both genotypes. PTH significantly increased osteoclast number (Figure 4D) in KO mice (p=0.004, t-test) but not in WT mice. Although PTH significantly increased osteoclast surface in both WT (p=0.049, t-test) and KO (p=0.001, t-test), the changes were of lower magnitude and significantly smaller in WT (43.6% ± 38.2%) than KO (88.4% ± 33.1%) (p=0.02, t-test) mice.
Figure 4.
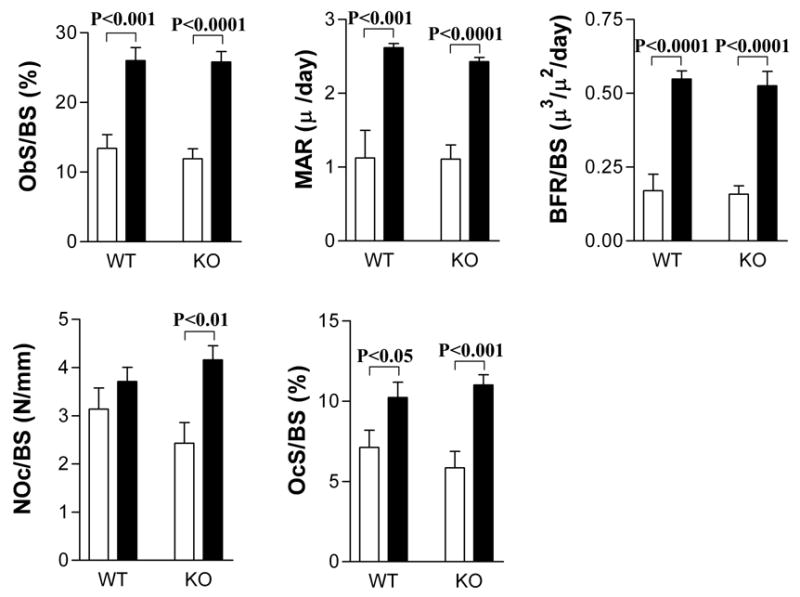
CREM deficiency did not prevent the bone formation response to PTH but enhanced the osteoclastogenic response to PTH. Mice were injected with calcein and xylenol orange, six and two days, respectively, prior to sacrifice as described in Materials and Methods. A subset of the femurs (n=8–9) shown in Figure 3 was used for both static (A, D, E) and dynamic (B, C) histomorphometric measurements of trabecular bone. (A) Osteoblast surface per bone surface (ObS/BS); (B) Mineral apposition rate (MAR); (C) Bone formation rate per bone surface (BFR/BS); (D) Osteoclast number per bone surface (NOc/BS); (E) Osteoclast surface per bone surface (OcS/BS). White bars represent vehicle-treated mice. Black bars represent PTH-treated mice.
To further explore the response of WT and KO mice to PTH, we measured serum bone turnover markers. PTH treatment increased serum osteocalcin levels to the same extent both genotypes (Figures 5A). For the serum C-terminal telopeptide of type I collagen (CTX), there was no statistically change in response to PTH for either genotype (Figure 5B).
Figure 5.

Serum turnover markers in vehicle-treated and PTH-treated WT and KO mice. Mice (7 per group) were given daily injections of vehicle or 160 μg/kg body weight of hPTH(1–34) dissolved in vehicle for 10 days. Serum osteocalcin and the C-terminal telopeptide of type I collagen (CTX) were determined by ELISA. (A) Osteocalcin; (B) CTX. White bars represent the vehicle-treated groups. Black bars represent the PTH-treated group.
Calvarial parameters were assessed by microCT as an additional assessment of the bone response to PTH. For both genotypes, there was a trend toward increased calvarial thickness in PTH-treated mice (p=0.052, two-way ANOVA) (Figure 6C). PTH increased calvarial porosity, an indice of resorption, in KO mice but not in WT mice (Figures 6E and F) indicating that PTH probably increased resorption in KO mice. Interaction analysis in two-way ANOVA indicated that WT and KO mice responded differently to PTH in percent calvarial porosity (p<0.05). Of note, there was a statistical trend indicating vehicle-treated KO calvaria were less porous than vehicle-treated WT calvaria (Figures 6E).
To determine whether KO mice had a greater number of osteoclast precursors in bone marrow, we performed CFU-GM assays. There was no difference in CFU-GM between the two genotypes (Figure 7A). Osteoclast formation in bone marrow cultures was also measured in response to M-CSF and RANKL (both at 30 ng/ml) treatment. While there were consistently 10–30% more osteoclasts formed in KO cultures, the differences were not significant at any of the time points (Figure 7B). Finally, bone marrow cells from both genotypes were cultured for up to 8 days in the presence of 100 ng/ml bPTH(1–34). Prior to day 6, there was no osteoclast formation in marrow from both genotypes. At day 6, there were nearly 2-fold more osteoclasts in KO cultures (Figure 7C). On subsequent days, the number of osteoclasts declined in the KO cultures and there were no significant differences between the genotypes (Figure 7C). There was no osteoclast formation in all vehicle-treated cultures (not shown).
Figure 7.

CREM deficiency enhanced osteoclastogenesis in bone marrow cultures but did not affect osteoclast precursor number. Bone marrow cells were collected from the femurs and tibiae of 10- to 11-week-old male mice. Osteoclast formation (OCL) was measured as described in Materials and Methods and expressed as the number of TRAP-positive cells containing 3 or more nuclei at each time point. (A) CFU-GM colonies were counted after 6 days of culture; (B) Cells treated with M-CSF and RANKL (each at 30 ng/ml); (C) Cells treated with PTH (100 ng/ml). Data are expressed as Mean ± SEM. A is the summary of 3 independent experiments with 6 wells per group. B is the summary of 5 independent experiments each with 6 wells per group. C is the summary of 4 independent experiments, each with wells per group. Data were analyzed by two-way ANOVA followed by Bonferroni post-tests for B and C.
DISCUSSION
CREM is a member of the CREB/CREM/ATF family of basic leucine zipper transcription factors that are involved in cAMP signaling (1). We previously reported that PTH induces ICER transcripts from the P2 promoter of the Crem gene in osteoblasts (19), and this induction is mediated through PKA signaling (20). However, despite this knowledge, the function of CREM factors in bone remains largely unknown. It is generally accepted that cAMP-mediated PKA activation through PTH1 receptors in osteoblasts is both necessary and sufficient for the anabolic effect of PTH in vivo (16,17), although the role of PKC activation cannot be excluded (25). Our previous initial pilot experiment did not reveal an obvious bone phenotype of Crem KO mice. However, based on the fact that ICER can be induced by PTH in osteoblasts(19) and the involvement of CREM in cAMP signaling, we hypothesized that CREM plays a role in regulating PTH responses in bones. Therefore, we subjected WT and Crem KO mice to an intermittent PTH treatment regimen that has been shown to produce an anabolic effect on bone mass in mice (11,26,27). Our study shows that the Crem gene plays a role in the acquisition of bone mass caused by intermittent PTH treatment and highlights the important role of osteoclastogenesis in shaping the PTH anabolic response.
Our studies revealed a subtle basal bone phenotype in male Crem KO mice; they had greater long bone mass, cortical area, subperiosteal area, and bone marrow area than WT mice. Although there was no difference in the basal bone formation rate between two genotypes, there was less porosity in KO calvariae. Taken together, these data suggest that there might be a suppression of baseline resportion in Crem KO mice. Except for trabecular thickness measured by microCT, which was in KO is slightly higher in KO than in WT mice (p=0.048, t-test), there was no significant difference in the basal trabecular bone mass between KO and WT mice implying that CREM deficiency mostly affects cortical bone.
Both KO and WT mice had a small but statistically significant weight gain in response to intermittent PTH treatment, suggesting that both genotypes responded to the treatment. Similar to a published study, intermittent PTH treatment caused an anabolic effect on both the cortical and trabecular compartments in a WT strain (11). However, we found that CREM deficiency blunted the anabolic effect in both the cortical and trabecular compartments. Interestingly, KO mice had a typical bone formation response to intermittent PTH treatment, suggested by the static and dynamic histomorphometry data and serum osteocalcin levels, but showed an increased osteoclast formation response. Other studies have shown that osteoclast parameters are unchanged in WT mice in response to short-term intermittent PTH treatment (11,28). Our data support these observations. Although there was a trend toward increased osteoclast number in response to PTH in WT mice, the effect was not significant. There was a greater increase in osteoclast surface in KO (88.4%) compared to WT (43.6%) mice. In KO mice, there was heightened osteoclast formation and activity in response to PTH, including increased osteoclast number in long bones and more extensive calvarial porosity. Taken together, our data suggest that the effect of intermittent PTH treatment is perturbed by CREM deficiency such that there is sufficient osteoclast activity to counterbalance the stimulation in osteoblast activity and bone formation. Thus, the Crem gene may specify the anabolic response of intermittent PTH treatment on bone by restraining PTH-induced osteoclastogenesis.
Our data indicate that CREM deficiency does not affect the increase in osteoblast surface and the bone formation rate seen in response to intermittent PTH, suggesting either that CREM is not involved in this response or that other ATF/CREB factors may have compensated for CREM. It has been suggested that the anabolic effect of PTH is mediated through effects on bone remodeling (29). In WT mice, the effect on bone formation outweighed bone resorption, leading to an increase in bone mass. However, in KO mice, the effect of intermittent PTH was similar on bone formation and bone resorption, resulting in a blunted anabolic response. These data suggest that CREM factors may be involved in regulating the bone remodeling response to PTH.
The outcome of PTH treatment on bone is dependent on its mode of administration: intermittent PTH treatment is anabolic while continuous PTH treatment is catabolic (30). In the anabolic mode, PTH has been shown to prolong the life span of the osteoblast (27), promote the differentiation of osteoprogenitor cells (30) and activate quiescent lining cells (31). In the catabolic mode, PTH does not affect osteoblast lifespan (27) but can lead to a sustained increase in the RANKL/OPG ratio, which favors an increase in osteoclast formation and a decrease in the expression of bone formation-related genes (18). It has been proposed that the RANKL/OPG ratio is fundamental to the bone resorptive effect of PTH (18,24,32). A recent study showed that both intermittent and continuous PTH treatment induces RANKL and inhibits OPG expression (18). However, with intermittent treatment, RANKL and OPG expression levels quickly return to their unstimulated levels, while with continuous treatment, the osteoclastogenic RANKL/OPG ratio is sustained (18).
Using a candidate gene approach, we have begun to examine the effect of CREM deficiency on PTH-induced gene expression in primary calvarial osteoblast cultures. We observed that PTH induction of c-Fos, Pghs2 and Il6, genes involved in osteoclast formation and signaling (33–37), was slightly decreased in KO compared to WT cultures (data not shown). Thus, these preliminary observations suggest that CREM deficiency may affect the nature of the intermittent PTH response by modulating genes involved in osteoclastogenesis. More extensive experiments with additional time points and candidates genes are currently underway to determine how CREM deficiency affects gene expression in response to PTH. A more global gene profiling approach by microarray analysis would provide much needed information on how CREM deficiency affects PTH-induced gene expression.
In the present study, PTH-stimulated osteoclast formation was greater in KO bone marrow cultures, in agreement with higher osteoclast number per bone surface in femurs of PTH-treated KO mice. These data suggest at least two possible cellular mechanisms to explain the role of CREM in PTH responses: 1) CREM deficiency might alter the response of osteoblasts to PTH, leading to higher expression of stimulators or lower levels of inhibitors of osteoclast formation; and/or 2) CREM deficiency might alter the signaling of osteoblast-derived factors in osteoclast precursors. To clarify whether the observed increased osteoclastogenesis, either in vivo or in vitro, was due to the increased osteoclast precursors in the bone marrow of KO mice, a CFU-GM assay was performed. A majority of the colonies formed in CFU-GM assays have been shown to be able to differentiate into osteoclasts (38). We found no difference in CFU-GM between the two genotypes, indicating that osteoclast precursor number was not affected by CREM deficiency. Although the KO bone marrow had slightly higher osteoclastogenesis in response to M-CSF and RANKL, the small difference between the genotypes cannot explain the much larger difference observed in vivo. We have considered that CREM may be expressed in osteoclasts. In an ongoing study, we have not detected the expression of CREM P1 and P2 promoter products (ICER) in osteoclast-like cells (RAW 264.7 cells cultured with RANKL). However, we have detected the weak expression of P2 promoter products in those cells after 2 h of PTH treatment and strong expression after 2 h of calcitonin treatment (data not shown). Whether ICER is expressed in osteoclasts in vivo and responsible in part for the phenotype of the Crem KO mice requires further study.
The restraint of PTH-induced osteoclastogenesis by Crem gene may seem paradoxical with the evidence of possible suppression in basal osteoclast activity in KO mice. However, it is possible that the baseline and PTH-stimulated resorption in KO mice are governed by different molecular pathways downstream of CREM. In addition to ICER, we observed 15 Crem P1 promoter transcripts in osteoblastic MC3T3-E1 cells (39). It is possible that different Crem isoforms may play different roles. The complexity of Crem gene expression in osteoblasts made it impossible for us to ascribe the phenotype (either basal or inducible) of Crem KO mice to a particular isoform or promoter products. However, we believe that ICER is a likely candidate for influencing the anabolic effect of PTH on bone. We previously showed that PTH induces ICER in mouse calvariae and primary calvarial osteoblasts (19). In other systems, ICER attenuates the expression of primary response genes following cAMP induction (40–45). Likewise, we suggest that ICER may attenuate PTH-induced gene expression in osteoblasts. If this model were correct, elimination of ICER would lead to sustained levels of cytokine gene expression resulting in heightened osteoclastogenesis. Generation of an ICER-deficient mouse model would provide an excellent tool to determine whether ICER factors are involved in the anabolic response of PTH on bone. It is altogether possible that other CREM isoforms other than ICER may be involved in PTH-regulated gene expression in bone. For example, a recent microarray study showed CREM C-G, a P1 promoter product, to be induced by PTH in UMR 106-01, a rat osteoblastic osteosarcoma cell line (46). However, we did not detect expression of CREM C-G in the immortalized murine osteoblast MC3T3-E1 cell line (data not shown).
In conclusion, our results provide a different point of view regarding the effect of intermittent PTH treatment–the role that resorption plays in determining the acquisition of bone mass. We suggest that the Crem gene may specify the anabolic response of intermittent PTH treatment on bone by limiting PTH-induced osteoclastogenesis.
Acknowledgments
This work was supported by a grant to BEK (R01 AR46542) from the National Institutes of Arthritis and Musculoskeletal Diseases (NIAMS) of the National Institutes of Health. We acknowledge support from the Core Center for Musculoskeletal Disorders grant (P30 AR46026) from NIAMS and the University of Connecticut Health Center Microcomputed Tomography Facility. We thank the Yale University Core Center for Musculoskeletal Disorders program for assistance with measuring serum turnover markers.
Footnotes
Publisher's Disclaimer: This is a PDF file of an unedited manuscript that has been accepted for publication. As a service to our customers we are providing this early version of the manuscript. The manuscript will undergo copyediting, typesetting, and review of the resulting proof before it is published in its final citable form. Please note that during the production process errors may be discovered which could affect the content, and all legal disclaimers that apply to the journal pertain.
Contributor Information
Fei Liu, Email: liu@student.uchc.edu.
Sun-Kyeong Lee, Email: klee@nso2.uchc.edu.
Douglas J. Adams, Email: dadams@nso.uchc.edu.
Gloria A. Gronowicz, Email: gronowicz@nso1.uchc.edu.
References
- 1.De Cesare D, Sassone-Corsi P. Transcriptional regulation by cyclic AMP-responsive factors. Prog Nucleic Acid Res Mol Biol. 2000;64:343–69. doi: 10.1016/s0079-6603(00)64009-6. [DOI] [PubMed] [Google Scholar]
- 2.Muller FU, Lewin G, Matus M, Neumann J, Riemann B, Wistuba J, Schutz G, Schmitz W. Impaired cardiac contraction and relaxation and decreased expression of sarcoplasmic Ca2+-ATPase in mice lacking the CREM gene. Faseb J. 2003;17:103–5. doi: 10.1096/fj.02-0486fje. [DOI] [PubMed] [Google Scholar]
- 3.Isoda T, Paolocci N, Haghighi K, Wang C, Wang Y, Georgakopoulos D, Servillo G, Della Fazia MA, Kranias EG, Depaoli-Roach AA, Sassone-Corsi P, Kass DA. Novel regulation of cardiac force-frequency relation by CREM (cAMP response element modulator) Faseb J. 2003;17:144–51. doi: 10.1096/fj.01-0981com. [DOI] [PubMed] [Google Scholar]
- 4.Stehle JH, Foulkes NS, Molina CA, Simonneaux V, Pevet P, Sassone-Corsi P. Adrenergic signals direct rhythmic expression of transcriptional repressor CREM in the pineal gland. Nature. 1993;365:314–20. doi: 10.1038/365314a0. [DOI] [PubMed] [Google Scholar]
- 5.Maldonado R, Smadja C, Mazzucchelli C, Sassone-Corsi P, Mazucchelli C. Altered emotional and locomotor responses in mice deficient in the transcription factor CREM. Proc Natl Acad Sci U S A. 1999;96:14094–9. doi: 10.1073/pnas.96.24.14094. [DOI] [PMC free article] [PubMed] [Google Scholar]
- 6.Nantel F, Monaco L, Foulkes NS, Masquilier D, LeMeur M, Henriksen K, Dierich A, Parvinen M, Sassone-Corsi P. Spermiogenesis deficiency and germ-cell apoptosis in CREM-mutant mice. Nature. 1996;380:159–62. doi: 10.1038/380159a0. [DOI] [PubMed] [Google Scholar]
- 7.Blendy JA, Kaestner KH, Weinbauer GF, Nieschlag E, Schutz G. Severe impairment of spermatogenesis in mice lacking the CREM gene. Nature. 1996;380:162–5. doi: 10.1038/380162a0. [DOI] [PubMed] [Google Scholar]
- 8.Daniel PB, Rohrbach L, Habener JF. Novel cyclic adenosine 3',5'-monophosphate (cAMP) response element modulator theta isoforms expressed by two newly identified cAMP-responsive promoters active in the testis. Endocrinology. 2000;141:3923–30. doi: 10.1210/endo.141.11.7758. [DOI] [PubMed] [Google Scholar]
- 9.Herdegen T, Leah JD. Inducible and constitutive transcription factors in the mammalian nervous system: control of gene expression by Jun, Fos and Krox, and CREB/ATF proteins. Brain Res Brain Res Rev. 1998;28:370–490. doi: 10.1016/s0165-0173(98)00018-6. [DOI] [PubMed] [Google Scholar]
- 10.Qi H, Li M, Wronski TJ. A comparison of the anabolic effects of parathyroid hormone at skeletal sites with moderate and severe osteopenia in aged ovariectomized rats. J Bone Miner Res. 1995;10:948–55. doi: 10.1002/jbmr.5650100616. [DOI] [PubMed] [Google Scholar]
- 11.Iida-Klein A, Zhou H, Lu SS, Levine LR, Ducayen-Knowles M, Dempster DW, Nieves J, Lindsay R. Anabolic action of parathyroid hormone is skeletal site specific at the tissue and cellular levels in mice. J Bone Miner Res. 2002;17:808–16. doi: 10.1359/jbmr.2002.17.5.808. [DOI] [PubMed] [Google Scholar]
- 12.Brommage R, Hotchkiss CE, Lees CJ, Stancill MW, Hock JM, Jerome CP. Daily treatment with human recombinant parathyroid hormone-(1–34), LY333334, for 1 year increases bone mass in ovariectomized monkeys. J Clin Endocrinol Metab. 1999;84:3757–63. doi: 10.1210/jcem.84.10.6039. [DOI] [PubMed] [Google Scholar]
- 13.Body JJ, Gaich GA, Scheele WH, Kulkarni PM, Miller PD, Peretz A, Dore RK, Correa-Rotter R, Papaioannou A, Cumming DC, Hodsman AB. A randomized double-blind trial to compare the efficacy of teriparatide [recombinant human parathyroid hormone (1–34)] with alendronate in postmenopausal women with osteoporosis. J Clin Endocrinol Metab. 2002;87:4528–35. doi: 10.1210/jc.2002-020334. [DOI] [PubMed] [Google Scholar]
- 14.Rubin MR, Bilezikian JP. The anabolic effects of parathyroid hormone therapy. Clin Geriatr Med. 2003;19:415–32. doi: 10.1016/s0749-0690(02)00074-5. [DOI] [PubMed] [Google Scholar]
- 15.Swarthout JT, D'Alonzo RC, Selvamurugan N, Partridge NC. Parathyroid hormone-dependent signaling pathways regulating genes in bone cells. Gene. 2002;282:1–17. doi: 10.1016/s0378-1119(01)00798-3. [DOI] [PubMed] [Google Scholar]
- 16.Rixon RH, Whitfield JF, Gagnon L, Isaacs RJ, Maclean S, Chakravarthy B, Durkin JP, Neugebauer W, Ross V, Sung W, et al. Parathyroid hormone fragments may stimulate bone growth in ovariectomized rats by activating adenylyl cyclase. J Bone Miner Res. 1994;9:1179–89. doi: 10.1002/jbmr.5650090807. [DOI] [PubMed] [Google Scholar]
- 17.Armamento-Villareal R, Ziambaras K, Abbasi-Jarhomi SH, Dimarogonas A, Halstead L, Fausto A, Avioli LV, Civitelli R. An intact N terminus is required for the anabolic action of parathyroid hormone on adult female rats. J Bone Miner Res. 1997;12:384–92. doi: 10.1359/jbmr.1997.12.3.384. [DOI] [PubMed] [Google Scholar]
- 18.Ma YL, Cain RL, Halladay DL, Yang X, Zeng Q, Miles RR, Chandrasekhar S, Martin TJ, Onyia JE. Catabolic effects of continuous human PTH (1–38) in vivo is associated with sustained stimulation of RANKL and inhibition of osteoprotegerin and gene-associated bone formation. Endocrinology. 2001;142:4047–54. doi: 10.1210/endo.142.9.8356. [DOI] [PubMed] [Google Scholar]
- 19.Tetradis S, Nervina JM, Nemoto K, Kream BE. Parathyroid hormone induces expression of the inducible cAMP early repressor in osteoblastic MC3T3-E1 cells and mouse calvariae. J Bone Miner Res. 1998;13:1846–51. doi: 10.1359/jbmr.1998.13.12.1846. [DOI] [PubMed] [Google Scholar]
- 20.Nervina JM, Tetradis S, Huang YF, Harrison D, Molina C, Kream BE. Expression of inducible cAMP early repressor is coupled to the cAMP-protein kinase A signaling pathway in osteoblasts. Bone. 2003;32:483–90. doi: 10.1016/s8756-3282(03)00056-5. [DOI] [PubMed] [Google Scholar]
- 21.Sher LB, Woitge HW, Adams DJ, Gronowicz GA, Krozowski Z, Harrison JR, Kream BE. Transgenic expression of 11beta-hydroxysteroid dehydrogenase type 2 in osteoblasts reveals an anabolic role for endogenous glucocorticoids in bone. Endocrinology. 2004;145:922–9. doi: 10.1210/en.2003-0655. [DOI] [PubMed] [Google Scholar]
- 22.Parfitt AM, Drezner MK, Glorieux FH, Kanis JA, Malluche H, Meunier PJ, Ott SM, Recker RR. Bone histomorphometry: standardization of nomenclature, symbols, and units. Report of the ASBMR Histomorphometry Nomenclature Committee. J Bone Miner Res. 1987;2:595–610. doi: 10.1002/jbmr.5650020617. [DOI] [PubMed] [Google Scholar]
- 23.Gundberg CM, Clough ME, Carpenter TO. Development and validation of a radioimmunoassay for mouse osteocalcin: paradoxical response in the Hyp mouse. Endocrinology. 1992;130:1909–15. doi: 10.1210/endo.130.4.1547718. [DOI] [PubMed] [Google Scholar]
- 24.Lee SK, Lorenzo JA. Parathyroid hormone stimulates TRANCE and inhibits osteoprotegerin messenger ribonucleic acid expression in murine bone marrow cultures: correlation with osteoclast-like cell formation. Endocrinology. 1999;140:3552–61. doi: 10.1210/endo.140.8.6887. [DOI] [PubMed] [Google Scholar]
- 25.Takasu H, Bringhurst FR. Type-1 parathyroid hormone (PTH)/PTH-related peptide (PTHrP) receptors activate phospholipase C in response to carboxyl-truncated analogs of PTH(1–34) Endocrinology. 1998;139:4293–9. doi: 10.1210/endo.139.10.6261. [DOI] [PubMed] [Google Scholar]
- 26.Frolik CA, Cain RL, Sato M, Harvey AK, Chandrasekhar S, Black EC, Tashjian AH, Jr, Hock JM. Comparison of recombinant human PTH(1–34) ( LY333334) with a C-terminally substituted analog of human PTH-related protein(1–34) (RS-66271): In vitro activity and in vivo pharmacological effects in rats. J Bone Miner Res. 1999;14:163–72. doi: 10.1359/jbmr.1999.14.2.163. [DOI] [PubMed] [Google Scholar]
- 27.Jilka RL, Weinstein RS, Bellido T, Roberson P, Parfitt AM, Manolagas SC. Increased bone formation by prevention of osteoblast apoptosis with parathyroid hormone. J Clin Invest. 1999;104:439–46. doi: 10.1172/JCI6610. [DOI] [PMC free article] [PubMed] [Google Scholar]
- 28.Zhou H, Iida-Klein A, Lu SS, Ducayen-Knowles M, Levine LR, Dempster DW, Lindsay R. Anabolic action of parathyroid hormone on cortical and cancellous bone differs between axial and appendicular skeletal sites in mice. Bone. 2003;32:513–20. doi: 10.1016/s8756-3282(03)00057-7. [DOI] [PubMed] [Google Scholar]
- 29.Martin TJ. Does bone resorption inhibition affect the anabolic response to parathyroid hormone? Trends Endocrinol Metab. 2004;15:49–50. doi: 10.1016/j.tem.2004.01.002. [DOI] [PubMed] [Google Scholar]
- 30.Qin L, Raggatt LJ, Partridge NC. Parathyroid hormone: a double-edged sword for bone metabolism. Trends Endocrinol Metab. 2004;15:60–5. doi: 10.1016/j.tem.2004.01.006. [DOI] [PubMed] [Google Scholar]
- 31.Dobnig H, Turner RT. Evidence that intermittent treatment with parathyroid hormone increases bone formation in adult rats by activation of bone lining cells. Endocrinology. 1995;136:3632–8. doi: 10.1210/endo.136.8.7628403. [DOI] [PubMed] [Google Scholar]
- 32.Locklin RM, Khosla S, Turner RT, Riggs BL. Mediators of the biphasic responses of bone to intermittent and continuously administered parathyroid hormone. J Cell Biochem. 2003;89:180–90. doi: 10.1002/jcb.10490. [DOI] [PubMed] [Google Scholar]
- 33.Wang ZQ, Ovitt C, Grigoriadis AE, Mohle-Steinlein U, Ruther U, Wagner EF. Bone and haematopoietic defects in mice lacking c-fos. Nature. 1992;360:741–5. doi: 10.1038/360741a0. [DOI] [PubMed] [Google Scholar]
- 34.Okada Y, Pilbeam C, Raisz L, Tanaka Y. Role of cyclooxygenase-2 in bone resorption. J UOEH. 2003;25:185–95. doi: 10.7888/juoeh.25.185. [DOI] [PubMed] [Google Scholar]
- 35.Ono K, Akatsu T, Murakami T, Kitamura R, Yamamoto M, Shinomiya N, Rokutanda M, Sasaki T, Amizuka N, Ozawa H, Nagata N, Kugai N. Involvement of cyclo-oxygenase-2 in osteoclast formation and bone destruction in bone metastasis of mammary carcinoma cell lines. J Bone Miner Res. 2002;17:774–81. doi: 10.1359/jbmr.2002.17.5.774. [DOI] [PubMed] [Google Scholar]
- 36.Gao Y, Morita I, Maruo N, Kubota T, Murota S, Aso T. Expression of IL-6 receptor and GP130 in mouse bone marrow cells during osteoclast differentiation. Bone. 1998;22:487–93. doi: 10.1016/s8756-3282(98)00040-4. [DOI] [PubMed] [Google Scholar]
- 37.Kurihara N, Bertolini D, Suda T, Akiyama Y, Roodman GD. IL-6 stimulates osteoclast-like multinucleated cell formation in long term human marrow cultures by inducing IL-1 release. J Immunol. 1990;144:4226–30. [PubMed] [Google Scholar]
- 38.Menaa C, Kurihara N, Roodman GD. CFU-GM-derived cells form osteoclasts at a very high efficiency. Biochem Biophys Res Commun. 2000;267:943–6. doi: 10.1006/bbrc.1999.2042. [DOI] [PubMed] [Google Scholar]
- 39.Liu F, Huang YF, Kream BE. Identification of Novel cAMP Responsive Element Modulator (CREM) Isoforms Expressed by Osteoblasts. Calcif Tissue Int. 2005 doi: 10.1007/s00223-005-0003-1. Jul 28 [Epub] [DOI] [PubMed] [Google Scholar]
- 40.Tinti C, Conti B, Cubells JF, Kim KS, Baker H, Joh TH. Inducible cAMP early repressor can modulate tyrosine hydroxylase gene expression after stimulation of cAMP synthesis. J Biol Chem. 1996;271:25375–81. doi: 10.1074/jbc.271.41.25375. [DOI] [PubMed] [Google Scholar]
- 41.Pfeffer M, Maronde E, Korf HW, Stehle JH. Antisense experiments reveal molecular details on mechanisms of ICER suppressing cAMP-inducible genes in rat pinealocytes. J Pineal Res. 2000;29:24–33. doi: 10.1034/j.1600-079x.2000.290104.x. [DOI] [PubMed] [Google Scholar]
- 42.Bodor J, Bodorova J, Bare C, Hodge DL, Young HA, Gress RE. Differential inducibility of the transcriptional repressor ICER and its role in modulation of Fas ligand expression in T and NK lymphocytes. Eur J Immunol. 2002;32:203–12. doi: 10.1002/1521-4141(200201)32:1<203::AID-IMMU203>3.0.CO;2-C. [DOI] [PubMed] [Google Scholar]
- 43.Bodor J, Habener JF. Role of transcriptional repressor ICER in cyclic AMP-mediated attenuation of cytokine gene expression in human thymocytes. J Biol Chem. 1998;273:9544–51. doi: 10.1074/jbc.273.16.9544. [DOI] [PubMed] [Google Scholar]
- 44.Mao D, Warner EA, Gurwitch SA, Dowd DR. Differential regulation and transcriptional control of immediate early gene expression in forskolin-treated WEHI7.2 thymoma cells. Mol Endocrinol. 1998;12:492–503. doi: 10.1210/mend.12.4.0084. [DOI] [PubMed] [Google Scholar]
- 45.Lamas M, Sassone-Corsi P. The dynamics of the transcriptional response to cyclic adenosine 3',5'-monophosphate: recurrent inducibility and refractory phase. Mol Endocrinol. 1997;11:1415–24. doi: 10.1210/mend.11.10.9988. [DOI] [PubMed] [Google Scholar]
- 46.Qin L, Qiu P, Wang L, Li X, Swarthout JT, Soteropoulos P, Tolias P, Partridge NC. Gene expression profiles and transcription factors involved in parathyroid hormone signaling in osteoblasts revealed by microarray and bioinformatics. J Biol Chem. 2003;278:19723–31. doi: 10.1074/jbc.M212226200. [DOI] [PubMed] [Google Scholar]