

Abstract
Capillary electrophoresis (CE) has been used to characterize the hairpin-random coil transition of four octamers in the GCxxxxGC minihairpin family, where xxxx is GAAA, TTTC, TTTT, or AAAA. The transition can be monitored by CE because differences in the frictional coefficients of the hairpin and coil forms of each octamer lead to a difference of ~9% in the free solution mobilities of the two conformations. The GAAA octamer is unusually stable, with a melting temperature of 65°C. The TTTT octamer forms a minihairpin with a melting temperature of 29°C, the TTTC octamer has a melting temperature of 16°C, and the AAAA octamer has a melting temperature below 0°C. The thermal transitions of the TTTT, TTTC, and AAAA octamers are well fitted by a structure prediction algorithm; however, the GAAA minihairpin is considerably more stable than predicted. The melting temperature of the GAAA minihairpin is reduced to 47°C in aqueous buffers containing 7.2 M urea, and to 33°C in buffers containing 7.2 M urea plus 40% (v/v) formamide. The combined results indicate that CE is a sensitive technique for monitoring conformational transitions in small DNA molecules.
Keywords: DNA minihairpins, Hairpin-random coil transition, Capillary electrophoresis, Free solution mobility
Introduction
The electrophoretic mobility, μ, of an analyte in free solution is determined by the ratio between its effective charge, Q, and its frictional coefficient, f, according to Eq. (1):
| (1) |
[1–3]. If the size of the analyte and its effective charge are constant, the mobility will depend on molecular shape through the frictional coefficient [1,3]. Conformational transitions in proteins have been studied for many years by capillary electrophoresis [4–8]. However, the hairpin-random coil transition in small DNA oligomers has not been studied previously by this technique.
In the studies described here, the hairpin-coil transition has been monitored for four octamers in the GCxxxxGC minihairpin family, where xxxx is GAAA, TTTC, TTTT, or AAAA. The GAAA octamer forms an unusually stable minihairpin, with a reported melting temperature of 76°C; it is not denatured in 7 M urea or degraded by exonucleases [9–12]. The G and A residues at the bottom of the loop form a sheared G–A base pair which stacks on top of the stem [9–16], effectively increasing the stem length. The TTTT octamer also exists in solution as a hairpin, although it is not unusually stable and has a reported melting temperature of 33°C [9,10]. The other two octamers, AAAA and TTTC, have been described as random coils at room temperature [10]. However, as shown below, each of these octamers contains a measurable population of hairpin structures at 20°C. The experimental melting curves determined by CE for three of the four octamers compare favorably with melting curves calculated from the Zuker structure-predicting algorithm [17]; however, the GAAA octamer is more stable than predicted. The effect of chemical denaturants on the hairpin octamers is also described.
Materials and Methods
DNA and buffers
The four octamers used in this study, 5′-GCGAAAGC, 5′-GCAAAAGC, 5′-GCTTTTGC and 5′-GCTTTCGC were synthesized by Integrated DNA Technologies (IDT, Coralville IA, USA) and purified by HPLC. They had the expected mass when analyzed by MALDI-TOF mass spectrometry and migrated as single bands when electrophoresed in polyacrylamide gels. For brevity, the four octamers are described by the four central loop-forming residues, GA3, A4, T4 and T3C, in the following text; collectively the oligomers are called the hairpin octamers. Control experiments were carried out with a double-stranded, 26-base pair random-sequence oligomer (denoted ds26, for brevity) and a short single-stranded oligomer with the sequence ACCTG (hereafter called ss5), both of which were synthesized by IDT. Two shorter oligonucleotides, adenylyl(3′→5′)adenosine (denoted ss2) and adenylyl(3′→5′)cytidylyl(3′→5′)cytidine (ss3), were purchased from Sigma (St. Louis, MO, USA). The single-stranded oligonucleotides ss2, ss3 and ss5 are too short to form hairpins and are therefore presumed to have a random conformation in solution.
Thermal denaturation experiments were carried out in solutions containing 50 mM sodium cacodylate buffer, pH 7.0, prepared by titrating cacodylic acid (Sigma) to the desired pH with NaOH. Experiments with chemical denaturants were carried out in 40 mM Tris acetate buffer, pH 8.0, plus the indicated concentration of urea and/or formamide. Tris-acetate buffers were prepared by titrating Tris base (RPI, Mt. Prospect, IL,USA) to pH 8.0 with glacial acetic acid. Urea (Ultra Pure grade, ICN Biomedicals, Aurora, OH, USA) was used as received. The formamide (EM Science, Cherry Hill, NJ, USA) was deionized by equilibrating with Amberlite MB-1 ion exchange resin for 30 min and filtering through Whatman #1 filter paper.
Capillary electrophoresis
Capillary zone electrophoresis measurements were carred out using a Beckman Coulter P/ACE MDQ Capillary Electrophoresis System (Fullerton CA, USA), run in the reverse polarity mode (anode on the detector side) with UV detection at 254 nm, as described previously [18,19]. LPA capillaries (Bio-Rad, Hercules CA, USA) coated with linear polyacrylamide were used to minimize the electroosmotic flow (EOF) of the solvent. Previous studies have shown that this coating does not affect the observed mobilities [19,20]. The capillaries were 40.0 cm in length (29.8 cm to the detector) and had external diameters of 375 μm and internal diameters of 75 μm. The capillary cartridge was thermostated at temperatures ranging from 15° to 60°C, the range available with the instrument. The samples were hydrodynamically injected into the capillary by applying low pressure (0.5 p.s.i., 0.0035 MPa) for 3 s. The injection volume was 22.5 nL; the sample plug occupied 1.3% of capillary length. The applied electric field was usually 75 – 250 V/cm, but ranged up to 450 V/cm in solutions containing high concentrations of urea. The current in the capillary was always less than 30 μA, to minimize Joule heating. Control experiments have shown that DNA mobilities measured under these conditions are independent of the applied electric field, DNA concentration, and the length of the sample plug.
Correction of the observed mobilities to standard solvent conditions
The free solution mobilities of the various samples were calculated from the observed migration times, using Eq. (2):
| (2) |
where μobs is the observed mobility, Ld is the distance to the detector (in cm), E is the electric field strength (in V/cm), and t is the time required for the sample to migrate to the detector (in s). Corrections for the electroosmotic flow (EOF) of the solvent were not necessary, because the EOF mobility, measured by the fast method described in [21], was always very small. However, it is well known that the mobility of an analyte varies directly with the dielectric constant (ε) and inversely as the viscosity (η) of the solvent [22–26]. Therefore, in order to analyze the hairpin-coil transition, the observed mobilities must first be corrected to standard solvent conditions. If temperature is the variable, the observed mobilities can be corrected to constant temperature (e.g., 20°C) using equation (3):
| (3) |
where μDNA,corr is the mobility that would have been observed if the temperature had been 20°C, (μDNA,obs)T is the observed mobility at temperature T, ηrel = ηT/η20 is the ratio of the viscosity of the background electrolyte (BGE) at temperatures T and 20°C, respectively, and εrel = εT/ε20, the ratio of the dielectric constant of the BGE at the two temperatures. We assumed, when using Eq. (3), that the viscosity and dielectric constant of the BGE were equal to those of water at each temperature.
If the transition is effected by adding a chemical denaturant to the background electrolyte (BGE) instead of raising the temperature, the correction to constant solvent conditions is calculated from Eq. (4):
| (4) |
where the correction factors are now: ηrel = (ηdenat/ηBGE)20 and εrel = (εdenat/εBGE)20, where ηdenat and εdenat refer to the viscosities and dielectric constants of solutions containing various quantities of a chemical denaturant. The viscosities and dielectric constants of urea-containing solutions were taken from [27] and [28], respectively; the viscosities and dielectric constants of formamide-containing solutions were taken from [29] and [30], respectively.
Alternatively, and more simply, the observed mobilities can be corrected to standard solvent conditions by measuring the mobilities of the analyte of interest (e.g., one of the hairpin octamers) and an unstructured marker (e.g., ss5) in the same solution at the same time, as a function of temperature or denaturant concentration. The observed mobility of the analyte can then be corrected to standard conditions (e.g., buffer at 20°C) using Eq. (5):
| (5) |
where (μDNA/μmarker)obs is the ratio of the mobilities of the analyte and the marker observed under a particular set of solvent conditions, and μmarker,std is the mobility of the marker measured under standard conditions (buffer at 20°C). This method of correcting the observed mobilities to standard solvent conditions will be called the ratio method, for brevity.
The importance of correcting the observed mobilities to standard conditions is illustrated in Fig. 1. Fig. 1A shows that the mobilities observed for ds26, ss5, ss3 and ss2, four analytes that do not undergo structural transitions in the temperature range investigated, increase approximately linearly with increasing temperature. When the observed mobilities are corrected to standard solvent conditions with Eq. (3), the corrected mobilities are constant within ±2.7%, as shown in Fig. 1B. The small decrease in the corrected mobilities with increasing temperature suggests that some solvent-related factor(s), such as the conductivity of the buffer ions, has not been taken adequately into account. Small changes in the ionic strength of the buffer as a function of temperature cannot explain the results, since the pKa of cacodylate is nearly independent of temperature [31].
Fig. 1.
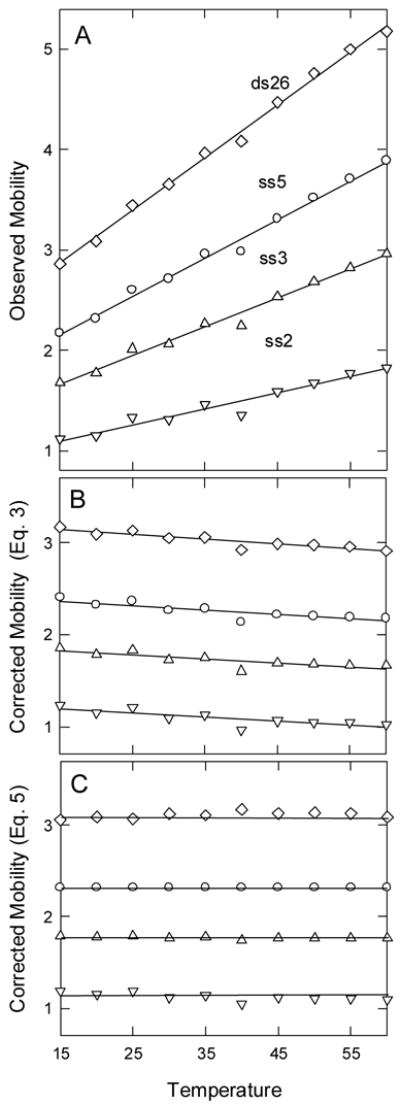
Mobility of DNA oligomers as a function of temperature. (A), Observed mobilities; (B), observed mobilities corrected to standard solvent conditions with Eq. (3); and (C), observed mobilities corrected to standard solvent conditions by Eq. (5), using ss5 as the marker. The mobilities are given in mobility units, 1 × 10⁻⁴ cm2/Vs. The symbols represent: (◇), ds26; (○), ss5; (△), ss3; and (▽), ss2. The BGE was 50 mM Na cacodylate.
The ratio method of correcting the observed mobilities to standard solvent conditions is illustrated in Fig. 1C for ds26, ss3 and ss2, using ss5 as the marker. The corrected mobilities are independent of temperature within ±1.8%. The improved constancy of the corrected mobilities is presumably due to the fact that the ratio method compensates for many different temperature-dependent changes in the physical properties of the BGE. However, either method of correcting the observed mobilities to standard solvent conditions gives reasonable results. The ratio method, Eq. (5), is used here to correct the mobilities observed for the hairpin octamers to standard solvent conditions when using temperature as the denaturant. For convenience in presenting the results, Eq. (4) is used to correct the observed mobilities to standard solvent conditions when the BGE contained chemical denaturants.
Results and discussion
Free solution mobility of hairpin octamers
The free solution mobilities of the four hairpin octamers were measured in solutions containing either 50 mM sodium cacodylate buffer, pH 7.0, or 40 mM Tris-acetate buffer, pH 8.0, as the background electrolyte (BGE). To prevent peak overlap, octamers GA3 and A4 were measured in the same solution, while octamers T3C and T4 were measured separately; all solutions also contained the marker ss5. Typical electropherograms observed for the four hairpin octamers and the marker ss5 at 20°C are illustrated in Fig. 2. All peaks are Gaussian-shaped and base-line separated. The mobility of ss5 is the same in all solutions, while the mobilities of the four hairpin octamers vary. The mobilities observed for the hairpin octamers in the two buffers are compiled in Table 1. The mobilities in the two buffers differ by ~5%, most likely because the ionic strengths of the two buffers were different and the limiting equivalent conductivities of the buffer cations, Na+ and Tris+, are also different [32,33]. As shown previously [34–36], and expected theoretically [23,37], the intrinsic conductivities of the various ions in the BGE strongly affect the observed mobilities.
Fig. 2.

Electropherograms observed for the four hairpin octamers and marker ss5. From left to right, the peaks in each electropherogram correspond to: T4 and ss5 (top); GA3, A4 and ss5 (middle); and T3C and ss5 (bottom). The BGE was 50 mM Na cacodylate; E = 240 V/cm; I = 29 μA; and T = 20°C.
Table 1.
Mobilities of the four hairpin octamers and marker ss5 measured in two different buffers at 20°C.
| 40 mM Na cacodylate buffer | 50 mM Tris-acetate buffer | |
|---|---|---|
| DNA | μ × 104, cm2/Vsa | μ × 104, cm2/Vsa |
| GA3 | 2.91 | 3.02 |
| T4 | 2.83 | 3.00 |
| T3C | 2.78 | 2.93 |
| A4 | 2.72 | 2.86 |
| ss5 | 2.32 | 2.47 |
The standard deviation of the mobilities was typically ±0.04 ×10⁻⁴ cm2/Vs.
Thermal denaturation of hairpin octamers
The thermal denaturation of the four hairpin octamers was measured in both Na cacodylate and Tris-acetate buffers. Because similar results were observed in both buffers, only the results obtained in cacodylate buffer will be described here. The mobilities observed for the hairpin octamers at various temperatures were corrected to 20°C by Eq. (5), using ss5 as the marker. The results are illustrated in Fig. 3. The corrected mobility of the GA3 minihairpin was virtually constant from 15° to 45°C, indicating that the conformation of this hairpin is stable over a wide range of temperatures, as observed previously [9–12]. The corrected mobility began to decrease at temperatures of 50°C and higher, indicating that significant populations of the random coil form of the octamer were beginning to be observed at these temperatures. By contrast, the corrected mobilities of the other three hairpin octamers decreased continually with increasing temperature over the entire measured temperature range.
Fig. 3.

Dependence of the solvent-corrected mobilities of the hairpin octamers on temperature. The mobilities were corrected to 20°C with Eq. (5), using ss5 as the marker. The symbols correspond to: (○), GA3; (△), T4; (▽), T3C; and (□), A4. The solid line through the GA3 data points was calculated by non-linear curve fitting as described in the text; the dashed lines were calculated from the Zuker algorithm [17]. The dot-dash lines correspond to the estimated limiting mobilities of the hairpin and coil forms of the octamers. The mobilities are plotted in mobility units, 1 × 10⁻⁴ cm2/Vs. The BGE was 50 mM Na cacodylate.
The thermal transitions measured for the hairpin octamers were independent of DNA concentration over a four-fold range of concentrations (data not shown), indicating that the transitions were monomeric, as expected for the unfolding of a small DNA hairpin. Similar results have been observed for related minihairpins [9].
Analysis of thermal melting curves
Thermal melting curves, such as those shown in Fig. 3, can be analyzed by non-linear curve fitting if melting is a two-state hairpin random coil transition and it is possible to measure (or estimate) the mobilities of the hairpin and coil forms of the octamers at the extremes of the hairpin-coil transition. Extensive thermodynamic, NMR and modeling studies of small DNA hairpins with loop structures similar to those studied here have found no evidence for species other than hairpins and single strands during the melting transition [38–41]. In addition, circular dichroism spectra of octamer GA3 measured at various temperatures contain two isosbestic points, consistent with a two-state melting transition [9]. Hence, denaturation of the four hairpin octamers studied here can be interpreted in terms of two-state transitions.
The mobility of an octamer in the hairpin conformation is well established by the constant mobility of GA3 observed at temperatures from 15° to 45°C (top curve in Fig. 3). Since this octamer is known to be completely in the hairpin form at 25°C [9,10], it can be assumed that the low temperature mobility of GA3 (2.91 × 10⁻⁴ cm2/Vs) is characteristic of an eight residue hairpin measured in 50 mM cacodylate buffer. The mobilities of the T3C and A4 hairpin octamers converge to the same value (2.68 × 10⁻⁴ cm2/Vs) at ~60°C. Hence, it seems reasonable to take this mobility as characteristic of the random coil form of an octamer in the same buffer. These limiting mobilities are indicated by the dot-dash lines in Fig. 3.
The melting curve calculated for the GA3 minihairpin by curve fitting, using the SigmaPlot suite of programs, is shown as the solid line in Fig. 3. Similar melting curves were calculated for the other hairpin octamers, although they are not shown for clarity. The melting temperatures, Tm, calculated for the four hairpin octamers by curve fitting are given in the second column of Table 2; the percentage of hairpin present at 20°C, estimated from the amplitudes of the corrected mobilities at that temperature, are given in the third column. The melting temperature of 65° observed for octamer GA3 is significantly lower than the value of 76°C observed previously [9,10], as shown by comparing columns two and six in Table 2. The discrepancy can probably be attributed to the fact that the ionic strength of the BGE used in the present study was three times lower than the ionic strength of the buffer used in the previous study; it is well known that DNA melting temperatures decrease with decreasing ionic strength [42,43]. Similarly, the melting temperature observed for octamer T4 is 29°C, somewhat lower than the value of 33°C observed previously [10].
Table 2.
Thermal melting temperatures observed for the hairpin octamers in aqueous solutions.
| Observed | Per Cent | Predicted | Per Cent | Literature | ||
|---|---|---|---|---|---|---|
| Hairpin | Tm, °C | Hairpin a | Tm, °C[17] | Hairpin b | Tm, °C | Reference |
| GA3 | 65 | 100 | 47 | 90 | 76 | [9,10] |
| T4 | 29 | 68 | 33 | 74 | 33 | [10] |
| ]T3C | 16 | 45 | 15 | 39 | none | [10] |
| A4 | −21 | 18 | −15 | 15 | none | [10] |
At 20°C, observed.
At 20°C, predicted from [17].
The calculated melting temperatures of octamers T3C and A4 are 16° and −21°C, indicating that neither octamer forms a stable hairpin at room temperature. However, the observed mobilities indicate that each octamer contains a significant population of hairpins at 20°C, as shown in the third column of Table 2. These results do not agree with a previous study, which concluded that octamers T3C and A4 were random coils at room temperature [10]. Hence, CE is a more sensitive measure of hairpin formation than UV absorption spectroscopy or denaturing polyacrylamide gel electrophoresis, the two methods used previously [10].
Thermal melting curves can also be calculated from the Zuker structure-prediction algorithm [17]. This algorithm uses the sequence of the octamer, the Na+ and Mg2+ concentrations in the solution and the temperature to calculate the free energy, ΔG, of the most stable hairpin form of each molecule, assuming that the hairpin-coil equilibrium can be treated as a two-state reaction. The equilibrium constant, Keq, can be calculated from the ΔG values at each temperature, since −ΔG = RT ln Keq (R is the gas constant and T is the absolute temperature [44]). The equilibrium constants, in turn, can be used to calculate the fractional population of hairpins at each temperature, which can then be used to predict the mobility, since the mobilities of the hairpin and coil forms of the octamers are known. The melting curves predicted from the Zuker algorithm are shown as the dashed lines in Fig. 3.
The thermal transitions observed for the T4, T3C and A4 hairpin octamers are well predicted by the Zuker algorithm [17]. However, the exceptional stability of the GA3 minihairpin is not well predicted, most likely because the stabilizing effect of a sheared GA base pair at the bottom of the loop has not been properly taken into account [45,46]. The melting temperatures calculated for the various hairpin octamers from the Zuker algorithm are given in the fourth column of Table 2; the predicted fractional population of each hairpin octamer present at 20°C is given the fifth column. The predicted melting temperature of the GA3 minihairpin, 47°C, is significantly lower than the observed value, 65°C, and the previously measured value, 76°C [9,10], reflecting the poor agreement of the predicted and observed melting curves. However, the predicted melting temperature of octamer T4, 33°C, agrees reasonably well with both the observed melting temperature and the value observed previously [10]. The predicted melting temperatures of octamers T3C and A4 are in good agreement with the fitted values. The predicted hairpin populations of octamers T4, T3C and A4 at 20°C also agree well with the observed values.
Effect of chemical denaturants on the structure of the hairpin octamers
The effect of urea on the stability of the four hairpin octamers at 20°C is illustrated in Fig. 4. The observed mobilities, corrected for the increased viscosity and dielectric constant of the BGE using Eq. (4), are plotted as a function of urea concentration. The corrected mobilities of all four hairpin octamers and the marker ss5, which is an unstructured random coil, increased linearly with increasing [urea], suggesting that the baseline mobility for the urea denaturation of DNA increases with increasing [urea]. Similar effects are observed when proteins are unfolded by chemical denaturants [47]. Importantly, the corrected mobilities of octamers T4, T3C and A4 converge to a common value at high [urea], suggesting that all three octamers are random coils at 20°C in solutions containing at least 7 M urea. By contrast, the mobility of the GA3 minihairpin was higher than that of the other three hairpin octamers at all [urea], suggesting that this octamer retained its hairpin conformation at all urea concentrations. Similar results have been observed by others [9,10].
Fig. 4.
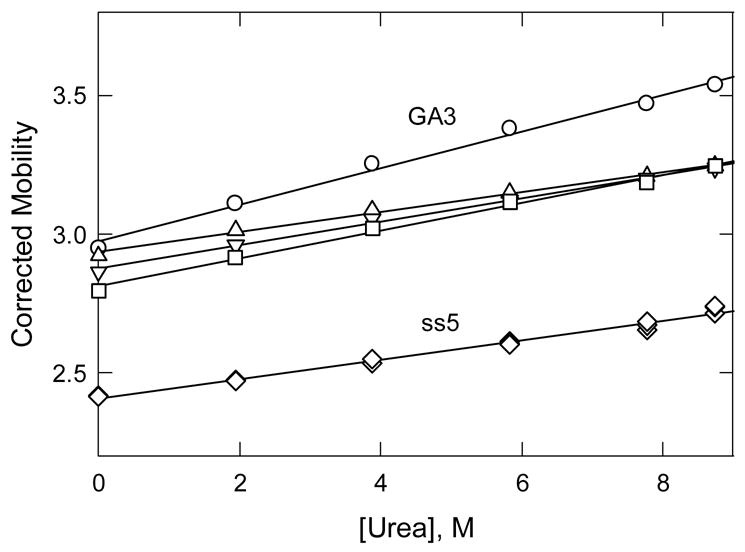
Dependence of the solvent-corrected mobility of the hairpin octamers and ss5 on the concentration of urea added to 40 mM Tris-acetate buffer at 20°C. The observed mobilities, which are given in mobility units, 1 × 10⁻⁴ cm2/Vs, were corrected to standard solvent conditions (Tris-acetate buffer at 20°C) using Eq. (4). The symbols refer to: (○), GA3; (△), T4; (▽), T3C; (□), A4; and (◇), ss5. The straight lines were drawn by linear regression.
The effect of increasing concentrations of formamide on the stability of the hairpin octamers at 20°C was also measured, with results similar to the results obtained with urea (data not shown). The mobilities observed for octamers T4, T3C and A4 converged to a common value at 40% (v/v) formamide, as expected if all three octamers are random coils at 20°C in solutions containing high [formamide]. The mobility of the GA3 minihairpin was higher than the mobility of the other hairpin octamers at all formamide concentrations, and did not converge to the common limit even in solutions containing 70% (v/v) formamide. Hence, the GA3 minihairpin retains its unusual stability in solutions containing high concentrations of formamide as well as high concentrations of urea.
Effect of both temperature and chemical denaturants on minihairpin stability
Since neither temperatures of 60°C nor high denaturant concentrations at 20°C were sufficient to denature the GA3 minihairpin, the combined effect of temperature and chemical denaturants was investigated, with the results shown in Fig. 5. Here, to clarify the results, the percentage of GA3 hairpin present in each BGE is plotted as a function of temperature. The mobility of GA3 observed in each buffer-denaturant solution at 20°C was taken as the mobility representative of 100% hairpin; the mobility of octamer A4 in the same buffer-denaturant solutions was taken as the mobility representative of 100% random coil. Octamer A4 is completely denatured in 7.2 M urea or 40% (v/v) formamide, as discussed above.
Fig. 5.
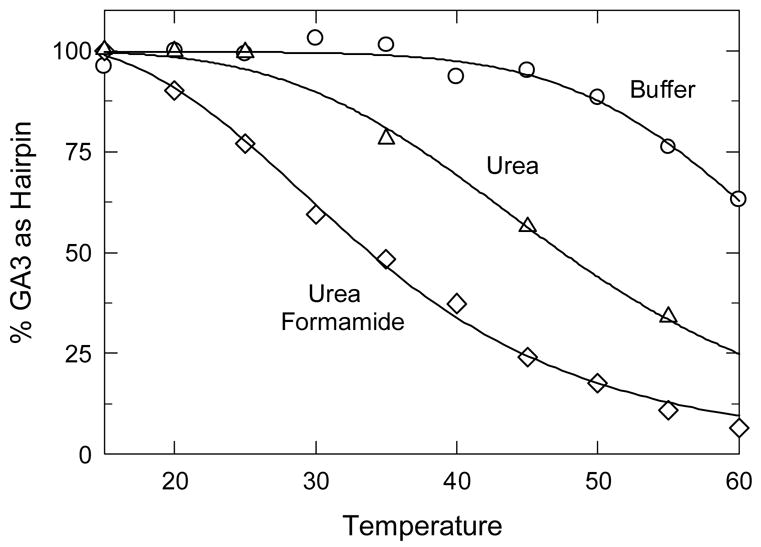
Effect of heat and chemical denaturants on the conformation of the GA3 minihairpin, plotted as the percentage of hairpin present at each temperature. For reference, the melting curve obtained in the absence of chemical denaturants is also shown. The mobilities are given in mobility units, 1 × 10⁻⁴ cm2/Vs. The symbols correspond to: (○), buffer alone; (△), buffer plus 7.2 M urea; and (◇), buffer plus 7.2 M urea and 40% (v/v) formamide. The curved lines were calculated by non-linear curve fitting, using the melting temperatures given in the text.
As shown in Fig. 5, the melting temperature of the GA3 minihairpin decreased from 65°C in aqueous buffer solutions to 47°C in buffers containing 7.2 M urea, somewhat lower than the melting temperature of 53°C previously observed in solutions containing 7 M urea [9]. However, the observed decrease of 18°C is close to the decrease of 16°C expected from the thermal denaturation of double-stranded DNA in buffers containing 7.2 M urea [48]. If the BGE contained 40% (v/v) formamide as well as 7.2 M urea, the melting temperature of the GA3 minihairpin was reduced from 65° to 33°C, again approximately equal to the decrease of 40°C expected from previous studies with double-stranded DNA [48]. The thermal denaturation of the GA3 minihairpin buffers containing 7.2 M urea plus 40% (v/v) formamide is nearly complete at 60°C, where the fractional hairpin population approaches zero.
Reversibility of the hairpin-coil transition
The mobilities of octamers GA3 and A4 and the marker ss5 were measured in 40 mM Tris-acetate buffer before and after heating to 90°C for 5 minutes. The mobilities and mobility ratios measured before and after heating were identical, indicating that the hairpin-random coil transition is reversible. By contrast, heating oligomers GA3 and A4 to 90°C in the presence of 7.8 M urea led to extensive peak broadening and distortion, most likely due to aggregation and/or chemical modification of the hairpin octamers by urea. Urea is known to carbamylate the amino groups of proteins at elevated temperatures [49]; similar effects may occur with oligonucleotides.
Concluding remarks
The results described here have shown that capillary electrophoresis is a sensitive monitor of the hairpin-random coil transition in small DNA oligomers. The detection method is based on the fact that the free solution mobility of an analyte depends on shape as well as effective charge. In agreement with previous studies [9–12], oligomer GA3 was found to be an unusually stable minihairpin, retaining its hairpin structure at 60°C in Tris and cacodylic buffers and at 20°C in solutions containing up to 8.7 M urea or 70% (v/v) formamide. The GA3 minihairpin is completely denatured at 60°C in solutions containing 7.2 M urea plus 40% (v/v) formamide. It is no coincidence that similar conditions are used to eliminate hairpin formation and band compression during DNA sequencing [e.g., 50].
The other three hairpin octamers, T4, T3C and A4 exist as mixtures of hairpin and random coil structures at moderate temperatures, if the solution does not contain chemical denaturants. The thermal melting transitions measured by CE for these three hairpin octamers are well predicted by the Zuker structure prediction algorithm [17]. The thermal transition of the GA3 minihairpin is not well predicted by this algorithm, presumably because the additional stabilization of the sheared G–A base pair at the bottom of the loop has not been taken sufficiently into account. From the amplitudes of the corrected mobilities observed for the hairpin octamers at 20°C, the percentage of hairpin structures present at this temperature ranges from 100% for GA3 to 68% for T4, 45% for T3C and 18% for A4. Octamers T3C and A4 were previously identified as random coils at room temperature [10]. In fact, the T3C octamer contains a significant population of hairpins at 20°C, while the A4 octamer contains a smaller fractional population.
The results presented here have shown that the free solution mobility of a short, single-stranded DNA oligomer depends on its conformation, and that CE is a sensitive monitor of the hairpin-random coil transition. However, it is necessary to correct the observed mobilities to constant solvent conditions, so that the hairpin-coil transition is not obscured by mobility differences due to temperature-dependent solvent effects. Mobility differences of ~9% were observed between the hairpin and coil forms of the octamers studied here; mobility differences due to solvent effects can be many times larger.
Acknowledgments
Partial financial support of this work by grant GM61009 from the National Institute of General Medical Sciences (N.C.S.) is gratefully acknowledged. A.R. acknowledges the receipt of a Summer Research Fellowship from the Department of Biochemistry, University of Iowa.
Abbreviations
- BGE
background electrolyte
- Tm
melting temperature
Footnotes
Publisher's Disclaimer: This is a PDF file of an unedited manuscript that has been accepted for publication. As a service to our customers we are providing this early version of the manuscript. The manuscript will undergo copyediting, typesetting, and review of the resulting proof before it is published in its final citable form. Please note that during the production process errors may be discovered which could affect the content, and all legal disclaimers that apply to the journal pertain.
References
- 1.Bockris JO’M, Reddy AKN. Ionics. 2. Vol. 1. Plenum Press; New York: 1998. Modern Electrochemistry. [Google Scholar]
- 2.Grossman PD. Free-solution capillary electrophoresis. In: Grossman PD, Colburn JC, editors. Capillary Electrophoresis Theory and Practice. Academic Press; San Diego: 1992. pp. 111–132. [Google Scholar]
- 3.Viovy JL. Electrophoresis of DNA and other polyelectrolytes: physical mechanisms. Rev Mod Phys. 2000;72:813–872. [Google Scholar]
- 4.Hilser VJ, Worosila GD, Friere E. Analysis of thermally induced protein folding/unfolding transitions using free solution capillary electrophoresis. Anal Biochem. 1993;208:125–131. doi: 10.1006/abio.1993.1017. [DOI] [PubMed] [Google Scholar]
- 5.McIntosh KA, Charman WN, Charman SA. The application of capillary electrophoresis for monitoring effects of excipients on protein conformation. J Pharmaceut Biomed Anal. 1998;16:1097–1105. doi: 10.1016/s0731-7085(97)00096-4. [DOI] [PubMed] [Google Scholar]
- 6.Rabiller-Baudry M, Bougen A, Lucas D, Chaufer B. Physico-chemical characterization of proteins by capillary electrophoresis. J Chromatogr B. 1998;706:23–32. doi: 10.1016/s0378-4347(97)00402-7. [DOI] [PubMed] [Google Scholar]
- 7.Rochu D, Ducret G, Ribes F, Vanin S, Masson P. Capillary zone electrophoresis with optimized temperature control for studying thermal denaturation of proteins at various pH. Electrophoresis. 1999;20:1686–1594. doi: 10.1002/(SICI)1522-2683(19990601)20:7<1586::AID-ELPS1586>3.0.CO;2-3. [DOI] [PubMed] [Google Scholar]
- 8.Stellwagen E, Gelfi C, Righetti PG. Protein folding observed by capillary electrophoresis in isoelectric buffers. J Chromatogr A. 1999;838:131–138. doi: 10.1016/s0021-9673(98)01048-6. [DOI] [PubMed] [Google Scholar]
- 9.Hirao I, Nishimura Y, Naraoka T, Watanabe K, Arata Y, Miura K. Extraordinary stable structure of short single-stranded DNA fragments containing a specific base sequence: d(GCGAAAGC) Nucleic Acids Res. 1989;17:2223–2231. doi: 10.1093/nar/17.6.2223. [DOI] [PMC free article] [PubMed] [Google Scholar]
- 10.Hirao I, Nishimura Y, Tagawa Y, Watanabe K, Miura K. Extraordinarily stable mini-hairpins: electrophoretical and thermal properties of the various sequence variants of d(GCGAAAGC) and their effect on DNA sequencing. Nucleic Acids Res. 1992;20:3891–3896. doi: 10.1093/nar/20.15.3891. [DOI] [PMC free article] [PubMed] [Google Scholar]
- 11.Hirao I, Kawai G, Yoshizawa S, Nishimura Y, Ishido Y, Watanabe K, Miura K. Most compact hairpin-turn structure exerted by a short DNA fragment, d(GCGAAGC) in solution: an extraordinarily stable structure resistant to nucleases and heat. Nucleic Acids Res. 1994;22:576–582. doi: 10.1093/nar/22.4.576. [DOI] [PMC free article] [PubMed] [Google Scholar]
- 12.Yoshizawa S, Kawai G, Watanabe K, Miura K, Hirao I. GNA trinucleotide loop sequences producing extraordinarily stable DNA minihairpins. Biochemistry. 1997;36:4761–4767. doi: 10.1021/bi961738p. [DOI] [PubMed] [Google Scholar]
- 13.Sandusky P, Wooten EW, Kurochkin AV, Kavanaugh T, Mandecki W, Zuiderweg DRP. Occurrence, solution structure and stability of DNA hairpins stabilized by a GA/CG hairpin unit. Nucleic Acids Res. 1995;23:4717–1725. doi: 10.1093/nar/23.22.4717. [DOI] [PMC free article] [PubMed] [Google Scholar]
- 14.Padrta P, Štefl R, Králík L, Žídek L, Sklenáø V. Refinement of d(GCGAAGC) hairpin structure using one- and two-bond residual dipolar couplings. J Biomol NMR. 2002;24:1–14. doi: 10.1023/a:1020632900961. [DOI] [PubMed] [Google Scholar]
- 15.Chou SH, Chin KH, Wang AHJ. Unusual DNA duplex and hairpin motifs. Nucleic Acids Res. 2003;31:2461–2474. doi: 10.1093/nar/gkg367. [DOI] [PMC free article] [PubMed] [Google Scholar]
- 16.Nakano M, Moody EM, Liang J, Bevilacqua PC. Selection for thermodynamically stable DNA tetraloops using temperature gradient gel electrophoresis reveals four motifs: d(cGNNAg), d(cGNABg), d(cCNNGg), and d(gCNNGc) Biochemistry. 2002;41:14281–14292. doi: 10.1021/bi026479k. [DOI] [PubMed] [Google Scholar]
- 17.Zuker M. Mfold web server for nucleic acid folding and hybridization prediction. Nucleic Acids Res. 2003;31:3406–3415. doi: 10.1093/nar/gkg595. The algorithm can also be accessed at www.idtdna.com. [DOI] [PMC free article] [PubMed] [Google Scholar]
- 18.Dong Q, Stellwagen E, Dagle JM, Stellwagen NC. Free solution mobility of small single-stranded oligonucleotides with variable charge densities. Electrophoresis. 2003;24:3323–3329. doi: 10.1002/elps.200305589. [DOI] [PubMed] [Google Scholar]
- 19.Stellwagen NC, Gelfi C, Righetti PG. The free solution mobility of DNA. Biopolymers. 1997;42:687–703. doi: 10.1002/(SICI)1097-0282(199711)42:6<687::AID-BIP7>3.0.CO;2-Q. [DOI] [PubMed] [Google Scholar]
- 20.Cai H, Vigh G. Method for the elimination of chromatographic bias from measured capillary electrophoretic effective mobility values. Anal Chem. 1998;70:4640–4643. doi: 10.1021/ac9803535. [DOI] [PubMed] [Google Scholar]
- 21.Williams BA, Vigh G. Fast, accurate mobility determination method for capillary electrophoresis. Anal Chem. 1996;68:1174–1180. doi: 10.1021/ac950968r. [DOI] [PubMed] [Google Scholar]
- 22.O’Brien RW, White LR. Electrophoretic mobility of a spherical colloidal particle. J Chem Soc Faraday Trans 2. 1978;74:1607–1626. [Google Scholar]
- 23.Manning G. Limiting laws and counterion condensation in polyelectrolyte solutions. 7. Electrophoretic mobility and conductance. J Phys Chem. 1981;85:1506–1515. [Google Scholar]
- 24.Michov BM. Radically simplifying the Henry function. Electrophoresis. 1988;9:199–200. doi: 10.1002/elps.1150090409. [DOI] [PubMed] [Google Scholar]
- 25.Cleland RL. Electrophoretic mobility of wormlike chains. 2. Theory. Macromolecules. 1991;24:4391–4402. [Google Scholar]
- 26.Lu YJ, Stellwagen E, Stellwagen NC. Effect of organic cosolvents on the free solution mobility of curved and normal DNA molecules. Electrophoresis. 2006;27:1462–1470. doi: 10.1002/elps.200500941. [DOI] [PubMed] [Google Scholar]
- 27.Kawahara K, Tanford C. Viscosity and density of aqueous solutions of urea and guanidine hydrochloride. J Biol Chem. 1966;241:3228–3232. [PubMed] [Google Scholar]
- 28.Wyman J., Jr Dielectric constants: ethanol-diethyl ether and urea-water solutions between 0 and 50°. J Am Chem Soc. 1933;55:4116–4121. [Google Scholar]
- 29.Kessler Yu M, Emelin VP, Tolubeev Yu S, Truskov OV, Lapshin RM. The dielectric constant and the structure of a water-formamide mixture. Z Struk Khim. 1972;13:196–201. [Google Scholar]
- 30.Mazurkiewica J, Tomasik P. Viscosity and dielectric properties of liquid binary mixtures. J Phys Org Chem. 1990;3:493–502. [Google Scholar]
- 31.Fukada H, Takahashi K. Enthalpy and heat capacity changes for the proton dissociation of various buffer components in 0.1 M potassium chloride. Proteins. 1998;33:159–166. [PubMed] [Google Scholar]
- 32.Weast RC, editor. CRC Handbook of Chemistry and Physics. CRC Press; Boca Raton, FL: 1984. pp. D171–D172. [Google Scholar]
- 33.Klein SD, Bates RG. Conductance of tris(hydroxymethyl)aminomethane hydrochloride (Tris·Cl) in water at 25 and 37°C. J Solution Chem. 1980;9:289–292. [Google Scholar]
- 34.Stellwagen E, Stellwagen NC. Probing the electrostatic shielding of DNA with capillary electrophoresis. Biophys J. 2003;84:1855–1866. doi: 10.1016/S0006-3495(03)74993-5. [DOI] [PMC free article] [PubMed] [Google Scholar]
- 35.Stellwagen E, Dong Q, Stellwagen NC. Monovalent cations affect the free solution mobility of DNA by perturbing the hydrogen-bonded structure of water. Biopolymers. 2005;78:62–68. doi: 10.1002/bip.20260. [DOI] [PubMed] [Google Scholar]
- 36.Stellwagen E, Dong Q, Stellwagen NC. Quantitative analysis of monovalent counterion binding to random-sequence, double-stranded DNA using the Replacement Ion method. Biochemistry. 2007 doi: 10.1021/bi062132w. in press. [DOI] [PMC free article] [PubMed] [Google Scholar]
- 37.Wiersema PH, Loeb AL, Overbeek JThG. Calculation of the electrophoretic mobility of a spherical colloid particle. J Colloid Interface Sci. 1966;22:78–99. [Google Scholar]
- 38.Antao VP, Lai SY, Tinoco I., Jr A thermodynamic study of unusually stable RNA and DNA hairpins. Nucleic Acids Res. 1991;19:5901–5905. doi: 10.1093/nar/19.21.5901. [DOI] [PMC free article] [PubMed] [Google Scholar]
- 39.Antao VP, Tinoco I., Jr Thermodynamic parameters for loop formation in RNA and DNA hairpin tetraloops. Nucleic Acids Res. 1992;20:819–824. doi: 10.1093/nar/20.4.819. [DOI] [PMC free article] [PubMed] [Google Scholar]
- 40.Senior MM, Jones RA, Breslauer KJ. Influence of loop residues on the relative stabilities of DNA hairpin structures. Proc Natl Acad Sci USA. 1988;85:6242–6246. doi: 10.1073/pnas.85.17.6242. [DOI] [PMC free article] [PubMed] [Google Scholar]
- 41.Kuznetsov SV, Shen Y, Benight AS, Ansari A. A semiflexible polymer model applied to loop formation in DNA hairpins. Biophys J. 2001;81:2864–2875. doi: 10.1016/S0006-3495(01)75927-9. [DOI] [PMC free article] [PubMed] [Google Scholar]
- 42.Gruenwedel DW, Hsu CH, Lu DS. The effects of aqueous neutral-salt solutions on the melting temperatures of deoxyribonucleic acids. Biopolymers. 1971;10:47–68. doi: 10.1002/bip.360100106. [DOI] [PubMed] [Google Scholar]
- 43.Owczarzy R, You Y, Moreira BG, Manthey JA, Huang L, Behlke MA, Walder JA. Effects of sodium ions on DNA duplex oligomers: improved predictions of melting temperatures. Biochemistry. 2004;43:3537–3554. doi: 10.1021/bi034621r. [DOI] [PubMed] [Google Scholar]
- 44.Eisenberg D, Crothers D. Physical Chemistry with Applications to the Life Sciences. The Benjamin/Cummings Publishing Co., Inc; Menlo Park, CA: 1979. pp. 148–162. [Google Scholar]
- 45.Lu AJ, Turner DH, Mathews DH. A set of nearest neighbor parameters for predicting the enthalpy change of RNA secondary structure formation. Nucleic Acids Res. 2006;34:4912–4924. doi: 10.1093/nar/gkl472. [DOI] [PMC free article] [PubMed] [Google Scholar]
- 46.Chen G, Turner DH. Consecutive GA pairs stabilize medium-size RNA internal loops. Biochemistry. 2006;45:4025–4043. doi: 10.1021/bi052060t. [DOI] [PMC free article] [PubMed] [Google Scholar]
- 47.Creighton TE. Proteins. W.H. Freeman and Co; New York: 1993. pp. 287–291. [Google Scholar]
- 48.Hutton JR. Renaturation kinetics and thermal stability of DNA in aqueous solutions of formamide and urea. Nucleic Acids Res. 1977;4:3537–3555. doi: 10.1093/nar/4.10.3537. [DOI] [PMC free article] [PubMed] [Google Scholar]
- 49.Stark GR. Reactions of cyanate with functional groups of proteins. III. Reactions with amino and carboxyl groups. Biochemistry. 1965;4:1030–1036. doi: 10.1021/bi00882a008. [DOI] [PubMed] [Google Scholar]
- 50.Slatko BE, Albright LM, Tabor S, Ju J. Current Protocols in Molecular Biology. Vol. 1. John Wiley & Sons; Hoboken, NJ: 1999. DNA sequencing by the dideoxy method; pp. 7.4A1–7.4A.39. [DOI] [PubMed] [Google Scholar]