

Abstract
Ethanol exposure profoundly affects learning and memory and neural plasticity. Key players underlying these functions are neurotrophins. The present study explored the effects of ethanol on the distribution of neurotrophins in the cerebral cortex of the adult rat. Age- and weight-matched pairs of adult male, Long-Evans rats were fed a liquid, ethanol-containing (6.7% v/v) diet or pair-fed an isocaloric control diet three consecutive days per week for 6, 12, 18, or 24 weeks. Brains were processed immunohistochemically for nerve growth factor (NGF) and brain-derived neurotrophic factor (BDNF) expression and for the expression of three neurotrophin receptors, p75, trkA, and trkB. Total numbers of immunolabeled neurons in specific layers of somatosensory cortex of ethanol- and control-fed animals were determined stereologically. Ethanol exposure induced an increase in the numbers of NGF- or BDNF-expressing neurons and in neurotrophin content per somata. These changes were (a) time- and (b) laminar-dependent. In contrast, the number of receptor-expressing neurons did not change due to ethanol exposure or to length of time on the ethanol diet. Thus, ethanol induces the recruitment of cortical neurons to express neurotrophins and an increase in the amount of neurotrophin expression per neuron.
Keywords: alcohol, anterograde, autocrine, brain-derived neurotrophic factor, dementia, nerve growth factor, p75, trk
INTRODUCTION
Neurotrophins initiate signaling events that underlie learning, memory, and neural plasticity (e.g., Fischer et al., 1987; Koh et al., 1989; Hellweg et al., 1990; Aloyz et al., 1999; Berninger et al., 1999; Chao, 2000; Escobar et al., 2003; Alonso et al., 2005). The synthesis and release of neurotrophins is activity-dependent, which is consistent with their role as modulators of synaptic strength and maintenance (Lindholm et al., 1994; Canossa et al., 1997; Kruttgen et al., 1998; Lessman, 1998). In cortex, maintenance of normal circuitry critically depends upon neurotrophins including nerve growth factor (NGF) and brain-derived neurotrophic factor (BDNF) (Fischer et al., 1991; Nishio et al., 1994; Singh et al., 1997; Katoh-Semba et al., 1998; Ha et al., 1999; Mufson et al., 1999; Savaskan et al., 2000; Gorski et al., 2003; Rajakumar et al., 2004; Lush et al., 2005). Both ligands are expressed by neurons distributed throughout somatosensory cortex of the rat (Nishio et al., 1994; Pitts and Miller, 1995; Miller and Pitts, 2000; Bruns and Miller, 2006a) and monkey (Miller, 2000) including projection (e.g., pyramidal) and local circuit (e.g., stellate) neurons (Miller, 2000). Indeed, cortical neurons express both the neurotrophin transcript (e.g., Mudo et al., 1996; Hoener et al., 1996; Conner et al., 1997; Okuno et al., 1999; Bruns and Miller, 2006a; 2006b) and protein (e.g., Nishio et al, 1994; Conner et al., 1997; Pitts and Miller, 1995; Miller and Pitts, 2000).
Neurotrophins initiate signaling by binding to a low (p75) or high affinity receptor (trk). Isoforms of the high affinity receptors, trkA and trkB, preferentially bind to NGF and BDNF, respectively (Bibel and Barde, 2000; Huang and Reichardt, 2003). The transcript (e.g., Mudo et al., 1996; Hock et al., 1998; Okuno et al., 1999; Dubus et al., 2000; Bruns and Miller, 2006a; 2006b) and protein for (Pitts and Miller, 1995; 2000; Yan et al., 1997) both trks have been identified in neocortex. The pattern of neurotrophin receptor expression is more restricted than that for neurotrophins. The cell bodies of receptor expressing neurons are most common in layer V and only pyramidal neurons are receptor-positive; trk-positive axons are rare (Pitts and Miller, 1995; Conner et al., 1998; Miller, 2000; Bruns and Miller, 2006a). This forms the basis of the concept that cortical neurotrophin regulation is mediated through autocrine/paracrine and anterograde mechanisms.
Ethanol exposure can affect learning and memory in humans (e.g., Lishman, 1986; Charness, 1993; Victor, 1994; Fadda and Rossetti, 1998) and experimental animals (e.g., Walker and Freund, 1971; Walker and Hunter, 1978; Arendt et al., 1988; 1989; Steigerwald and Miller, 1997; Lukoyanov et al., 2003). Thus, in light of evidence that learning and memory are regulated by neurotrophins (see above), it can be predicted that ethanol affects a neurotrophin system(s) (e.g., Dow and Riopelle, 1985; Messing, 1993; Pantazis et al., 1993; Seabold et al., 1998; Miller et al., 2002). Indeed, ethanol alters the expression of neurotrophins in brain structures associated with learning and memory, such as the hippocampus (Baek et al., 1994; 1996; MacLennan et al., 1995; Miller et al., 2002; Miller, 2004; Miller and Mooney, 2004) and neocortex (Aloe and Tirassa, 1992; Miller, 2004; Mooney and Miller, 2004).
It has been argued that alcohol-induced cognitive impairments are the pathophysiological correlate of dementias such as that associated with Alzheimer’s Disease, and results from the degeneration of cortical retrograde support of cholinergic projections from the basal forebrain. This is largely based neurochemical changes in cortex and the basal forebrain that are presumably linked (Arendt et al., 1988; 1989; Gericke et al., 2006). Other biochemical data, from enzyme-linked immunosorbent assays (ELISA), show that changes in cortex and the basal forebrain are not temporally coordinate (Miller, 2004; Miller and Mooney, 2004; Gericke et al., 2006). It can be implied, therefore, that retrograde systems are of less importance and that ethanol acts independently on intracortical systems. The present study explores the effects of ethanol on the structure of neurotrophin organization and supports the hypothesis that ethanol targets intracortical rather than an extracortical systems.
METHODS
Animals
Adult (>4-month-old) male, Long-Evans rats (Harlan, Indianapolis IN) were housed in an AAALAC-accredited facility at the Syracuse Veterans Affairs Medical Center (VAMC). Rats were handled according to protocols approved by Institutional Animal Care and Use Committees at the VAMC and Upstate Medical University. The environment of the animal room was strictly maintained at a temperature of 20–22°C, humidity of 50–65%, and lights on a regular cycle of 12 hours of light and 12 hours of dark. Two sentinel rats were maintained in the animal room at all times for routine evaluation of the health of the colony.
Food was provided to subjects via a yoked pair-feeding paradigm (Miller, 1992; 2004). Animals were grouped into weight-matched pairs. One rat from each pair was fed ad libitum a high-carbohydrate liquid diet containing 6.7% (v/v) ethanol (Et; Research Diets, New Brunswick NJ) for three consecutive days per week. Yoked controls were pair-fed equivalent volumes of an isocaloric control diet (Ct) containing maltose and dextrins. All rats were fed ad libitum a diet of standard rat chow and water on the remaining four days of the week. Body weights were monitored weekly to ensure that the weights of the Et-fed rats did not vary more than 5% from their matched Ct-fed controls. This feeding regime was maintained for 6, 12, 18, or 24 weeks. Fresh food was always provided to rats at the beginning of the dark cycle to optimize parallel feeding between the paired groups (Miller, 1992).
Blood ethanol concentrations (BECs) were determined in all rats from samples of serum obtained every fourth week. Additional samples were taken at the end of the sixth week for animals on a 6-week feeding regime and at the end of the 18th week for animals on an 18-week schedule. Tail blood was drawn at the seventh hour of the dark cycle on the second and third days of the ethanol feeding each week in order to detect BECs near their expected peak (Miller, 1992). BECs were determined using an oxidase enzymatic assay system (GM7 Microstat; Analox, Lunenburg MA). The mean BEC for all Et-fed groups (6, 12, 18, or 24 weeks) used in these experiments was 158 ± 8 mg/dl.
Tissue collection
Rats were sacrificed the morning after the last feeding with the liquid diet. They were deeply anesthetized by intraperitoneal injection of xylazine and ketamine (7.5 mg/kg and 60 mg/kg body weight, respectively) and then transcardially perfused with 400 ml of 4.0% paraformaldehyde in 0.10 M phosphate buffer (PB; pH = 7.4). Brains were removed, post-fixed in fresh, buffered fixative for two hours. Brains were transferred to a solution of PB with saline (PBS) containing 30% sucrose for cryoprotection and stored at 4°C for at least three days before cryosectioning.
Fixed brains were rinsed twice in fresh (sucrose-free) PBS, blotted dry, and mounted on a sliding microtome. After being frozen, each brain was cut into a complete set of 50 μm coronal sections through the full anterior-posterior extent of the brain. Section thickness was confirmed by measuring the depth of five unprocessed sections from each brain. The mean thickness was used in the calculations of laminar volume (see below). Several series composed of every 20th section were assembled in 12-well culture plates containing Netwells (Corning, Corning NY).
Immunohistochemistry
Tissue processing
A series was processed for immunohistochemistry with a single primary antibody (Table 1) or stained with cresyl violet. The antibodies chosen were used because they generated reliable, specific immunolabeling that matched with immunoreactions generated with other antibodies (Pitts and Miller, 1995; 2000; Jacobs and Miller, 1999; Miller and Pitts, 2000). To maximize antigenicity of the tissue, immunohistochemistry was performed after sectioning. One pair of brains was processed in tandem. This ensured that the samples from an Et-fed rat and the yoked Ct-fed rat were processed simultaneously (e.g., using the same stocks of buffers and antibodies).
Table 1.
Primary antibodies.
| Antibody | Source | Catalog number | Dilution | Host | Chromagen |
|---|---|---|---|---|---|
| NeuN | Chemicon, Temecula CA | MAB377 | 1:1000 | mouse | DAB |
| NGF | Santa Cruz Biotech., Santa Cruz CA | SC-549 | 1:2500 | rabbit | DAB |
| BDNF | Santa Cruz Biotech. | SC-546 | 1:500 | rabbit | DAB |
| P75 | Promega, Madison WI | G323A | 1:100 | rabbit | BCIP/NBT |
| trkA | Santa Cruz Biotech. | SC-118 | 1:100 | rabbit | BCIP/NBT |
| trkB (full length) | Santa Cruz Biotech. | SC-12 | 1:100 | rabbit | BCIP/NBT |
The product information and procedural details for each of the primary antibodies used in the immunohistochemical reactions are described. All antibodies were diluted in solutions containing 1.0% non-fat dry milk in a solution of 0.10 M phosphate buffer with 0.10% Tween and 0.90% NaCl. DAB, diaminobenzidine; BCIP/NBT, 5-bromo-4-chloro-3-indolyl phosphate/nitroblue tetrazolium.
Free-floating sections were washed in a solution of 3.0% hydrogen peroxide in PBS to quench endogenous peroxidase activity. Sections were rinsed three times with PBS containing 1.0% Tween-20 (TPBS) and incubated at 37°C with acidified 0.10% pepsin for 20 minutes in order to reveal antigen-binding sites. Following several washes of TPBS, non-specific immunoreactivity was blocked by washing sections in a TPBS solution containing 10% non-fat dried milk (MTPBS) overnight (>16 hr) at 4°C. The next day, sections were incubated with a primary antibody (Table 1) diluted in MTPBS for 24 hours at 4°C. On Day 3, sections were removed from primary antibody solutions and washed three times with MTPBS at room temperature. A biotinylated secondary antibody (Vector, Burlingame, CA) for each series was diluted 1:200 in MTPBS and applied to the tissue overnight at 4°C.
Chromogen labeling
The immunotag was completed on Day 4 with a color reaction via a peroxidase- or alkaline phosphatase reaction. For the peroxidase reaction, the sections were washed with MTPBS, incubated with an avidin-biotin conjugated enzyme complex (diluted 1:200 in PBS; ABC-Elite kit; Vector) for one hour at room temperature. For NeuN, NGF, and BDNF immunohistochemistry, the avidin-biotin complex was linked to horseradish peroxidase. After rinsing the sections several times in PBS, a histochemical reaction was performed using diaminobenzidine (DAB; Vector) as the substrate for any bound peroxidases. The DAB solution was applied for 2–6 minutes.
For receptor (p75, trkA, and trkB) immunohistochemistry, the avidin-biotin complex was linked to alkaline phosphatase (ABC-AP; Vector). Sections were incubated for three hours with the ABC solution (diluted 1:200 in PBS). Next, sections were washed three times in 100 mM Tris-HCl buffer (pH = 9.6). The same buffer was used to prepare the alkaline phosphatase substrate solution (BCIP/NBT kit, Vector). The substrate was applied for 20 min and a purple-blue precipitate formed wherever the alkaline phosphatase complex had bound. Non-specific alkaline phosphatase product was removed later during dehydration with 95% ethanol. Sections were rinsed several times with water and mounted onto slides.
All sections were dehydrated through graded alcohols, cleared with xylene, and coverslipped.
Controls
Controls for the immunoreaction involved omission of the primary or secondary antibodies and/or exclusion of the enzyme-conjugated avidin-biotin complexes. These were consistently negative. It is noteworthy that the specificity of the antibodies from Santa Cruz Biotechnology (Santa Cruz CA) was previously confirmed in empirical studies (Jacobs and Miller, 1999; Miller and Pitts, 2000; Pitts and Miller, 2000) and controls in which tissue was incubated in a primary antibody preabsorbed with an excess of ligand. Accordingly, the distribution and frequency of localization of ligand and receptor expressing neurons is the same with Santa Cruz antibodies or with antibodies obtained elsewhere (e.g., Fryer et al., 1996; Barone et al., 1998; Giehl et al., 1998; Park et al., 2004). Moreover, the incidence of co-localization of neurotrophins and receptors was the same whether Santa Cruz products or gifted antibodies for the receptors were used (Pitts and Miller, 2000).
Quantitative analyses
Stereology
Somatosensory cortex (area 3) was identified in cresyl violet-stained sections by cytoarchitectonic criteria (Donoghue and Wise, 1982; Miller, and Vogt, 1984; Miller, 1987; Miller and Potempa, 1990). Briefly, area 3 was distinguished as a koniocortex with a dense layer IV; adjacent cortices did not have a granular layer IV. In select sites within area 3, the granular layer IV was interrupted by dysgranular segments. Layer V was notable by the large, loosely packed pyramidal somata. Though the density of neurons in layer IV varied with the dysgranularlity, the density of neurons in layers II/III and V was consistent across the expanse of area 3.
Immunolabeled sections were used for the quantitative studies. The numbers of immunopositive neurons in both layers II/III and V of somatosensory cortex were estimated using an “unbiased” stereological method (Gundersen et al., 1988; Mooney et al., 1996). These layers were chosen for comparative analysis because of differences in their (a) cellular composition and (b) expression patterns for neurotrophin ligands and receptors. Neurons in layers II/III and V can express neurotrophins, and the chief repository of neurotrophin receptors is pyramidal neurons in layer V (Pitts and Miller, 1995; 2000; Miller and Peters, 2000; Miller, 2000). Moreover, though both layers house the cell bodies of cortico-cortical projection neurons (including callosal projection neurons) (e.g., Wise and Jones, 1977; Ivy and Killackey, 1983; Miller and Vogt, 1984a; 1984b; Koralek et al., 1990), layer V is particularly intriguing because it contains the somata of subcortical projection neurons (e.g., Hicks and D’Amato, 1977; Wise and Jones, 1977; Leong, 1983; Huerta and Harting, 1984; Miller, 1987; Schofield et al., 1987; Hallman et al., 1988).
The numbers of neurons in specific layers of cortex depended on NeuN immunohistochemical preparations. NeuN was a reliable biomarker of neurons, with its primary antigenicity found in nuclei and perikarya of differentiated neurons (Mullen et al., 1992; Lind et al., 2005; Miller, 2006). The distribution and frequency of NeuN expression is not affected by ethanol (Casella et al., 2004; Miller, 2006).
Cresyl violet-stained sections were used to identify the borders of layers II/III and V. Sections were examined using a Bioquant Image Analysis System (R&M Biometrics, Nashville, TN) fitted with a z-axis microcator for measuring distance between the surfaces of the section. The area of a particular layer (AS) was measured in sections through the full rostral-caudal extent of primary somatosensory cortex. The total volume (VT) of a region of interest, e.g., layer V, was estimated by summing the areas of somatosensory cortex using the following formula.
t was the thickness of a section and p was the periodicity of sections in a series (e.g., 1/20 sections).
The estimated density (NV) of immunolabeled neurons in a defined counting space was determined with the optical disector stereological method (Gundersen et al., 1988; Mooney et al., 1996). Only neurons with an identifiable nucleus in the counting box were counted. The essence of this method was the formula
where nb was the number of elements in a rectangular solid counting box, Vb was the volume of the box, and #b was the number of boxes examined.
The counting box was virtually suspended within the bottom and left sides) and the upper surface. Counting boxes were randomly placed within layer II/III or V of primary somatosensory cortex. Sufficient counting boxes were examined to include at least 100 positively immunolabeled cells per layer per animal. Vb was calculated as the product of the mean section thickness and the cross-sectional area of the counting box (100 μm × 100 μm).
The total number (NT) of immunolabeled cells in a layer was calculated as the product of VT and the sampled density (NV) of immunolabeled cells.
During all quantitative analyses, slides were encoded so that the observer was blind to treatment group and treatment duration. Decoding were performed only after the study was completed.
Microdensitometry
In a complementary study, the intensity of immunoreactivity for a particular protein in individual cells in the cortices of animals exposed to ethanol during six weeks was determined with microdensitometry. This is a quasi-quantitative approach because of the many variables that can affect intensity, including fixation and incubation times. Nevertheless, care was taken to rigorously follow the same protocols for the handling of all animals and their tissues and to run ethanol-treated animals and yoked controls in parallel to minimize methodological variation.
After obtaining the immunolabeled sections (see above), the optical density per cell was measured using the Bioquant Image Analysis Software. The light intensity and white balance were kept constant during all image acquisition and correction was made for background (variation in the illumination field and labeling intensity in the white matter). A number of steps were taken to assure that the results were consistent within the sample (i.e., on a relative scale). (1) Ambient room lighting was eliminated. (2) Illumination through the microscope was always set to the same power setting. (3) A set of control cells was repeatedly measured on each day. The controls were used for standardizing the results over time and possible variations in illumination. (4) As noted above, samples from yoked pairs were processed in tandem: from fixation through sectioning and immunohisotchemistry.
A circular sampling region with a diameter of 2.0 μm was used for the analyses. Each sampling circle was placed within the perikaryon of a labeled neuron, and the average intensity was measured. Fifty pyramidal neurons in layer II/III and another fifty in layer V were randomly sampled from each animal. The relative mean optical density for representative neurons per animal was determined in five yoked pairs of animals that were treated with the liquid diet for six weeks.
Statistical analyses
Two-way analyses of variance were used to examine the effects of (1) ethanol and (2) duration of the exposure either on the volume of somatosensory cortex or on constituent laminae. Multiple analyses of covariance (MANCOVA) were performed to assess the effects of ethanol consumption on total neuronal number (NeuN-immunopositive cells), and the numbers of neurons immunopositive for NGF, BDNF, p75, trkA, or trkB. Type of diet (Ct or Et) and duration of exposure (6, 12, 18, or 24 weeks) were examined as co-variables. Since the treatment groups were processed in tandem with immunohistochemistry for each protein of interest, each measure of the number of immunopositive neurons could be included in a MANCOVA to detect the effect of treatment or duration of treatment.
Linear regression analyses were used to assess time-dependent trends. The strength of a relationship was measured by Pearson correlation coefficient (r) and significance was tested using z values (p<0.05). In order to detect a difference between two independent correlation coefficients, Fisher’s r-to-z transformations were performed (Cohen and Cohen, 1983). Taking into account the total number of samples used in each correlation, the z-scores were then compared to a normal probability distribution. A two-tailed z-score of greater than |1.96| was considered significant (p<0.05).
Microdensitometric analyses to determine the effect of ethanol exposure on NGF and BDNF protein expression per neuronal profile were compared using Student’s t-tests. This and all other statistical tests relied on Statview software (SAS, Cary NC).
RESULTS
Features of layers II/III and V
Somatosensory cortex was distinguished by its characteristic granular layer IV (Fig. 1). This feature was used to identify the limits of area 3 in adult Ct- and Et-fed rats. The volume of area 3 in the Ct-fed rats did not vary significantly over the course of the exposure, i.e., as rats grew from 4- to 10-months old (Fig. 2). That is, age was not a significant variable. Moreover, ethanol did not produce a statistically significant difference in the total volume of area 3.
Figure 1.
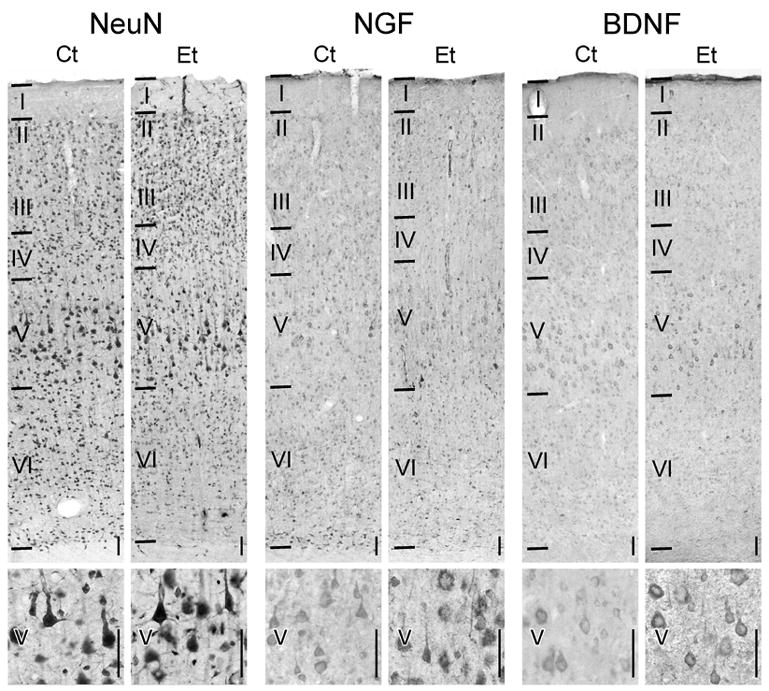
Distribution of neurotrophin expression in somatosensory cortex.
Pairs of animals were fed either the control (Ct) or ethanol (Et) liquid diet and processed for neurotrophin immunohistochemistry. The distribution of NeuN, NGF, and BDNF immunolabeling through the full depth of cortex (top) and in layer V (bottom) are shown. [n.b. The images provided were obtained from tissue prepared with matched incubations; they reflect the treatment-induced differences in immunolabeling. The specific labeling in the present study was like that described previously (Pitts and Miller, 2000).] Horizontal lines indicate laminar boundaries and Roman numerals identify the layers. Vertical scale bars in the lower right of each micrograph are 50 μm.
Figure 2.
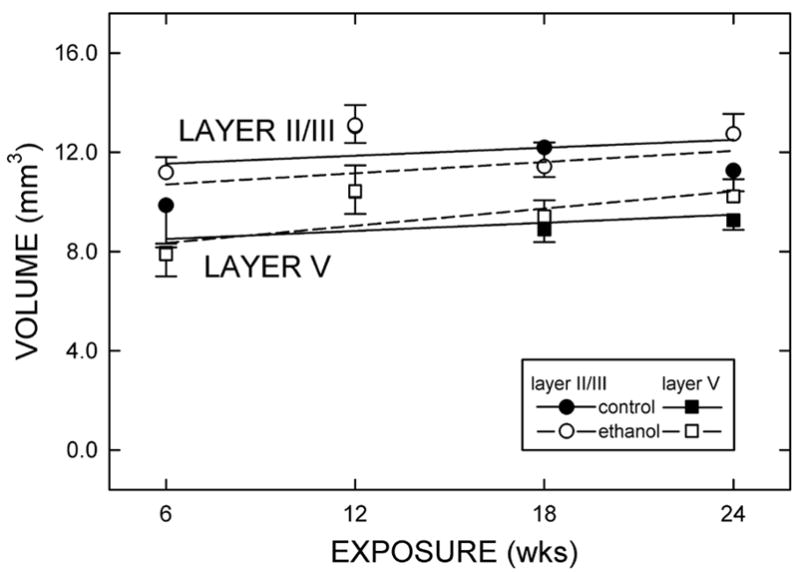
Layer volumes in somatosensory cortex of adult rat.
Total volume of layer II/III (circles) and layer V (squares) was estimated by Cavalieri’s method in both control-fed (filled symbols and solid lines) and ethanol-fed (open symbols and dashed lines) rats. Each point represents the mean ± standard error of 5 (6 and 12 wk exposures) or 6 (18 and 24 wk exposures) rats per group.
Layers II/III and V were distinguished by the robust size and the relatively low packing density of their constituent neurons (Fig. 1). Neither age, diet, nor duration of treatment significantly affected the volumes of layers II/III and V.
The numbers of neurons in layers II/III and V were determined using a stereological method. The number of NeuN immunopositive cells was consistently greater in layer II/III than layer V (Fig. 3). Neither the packing density nor the number of neurons either layer varied with age or treatment.
Figure 3.
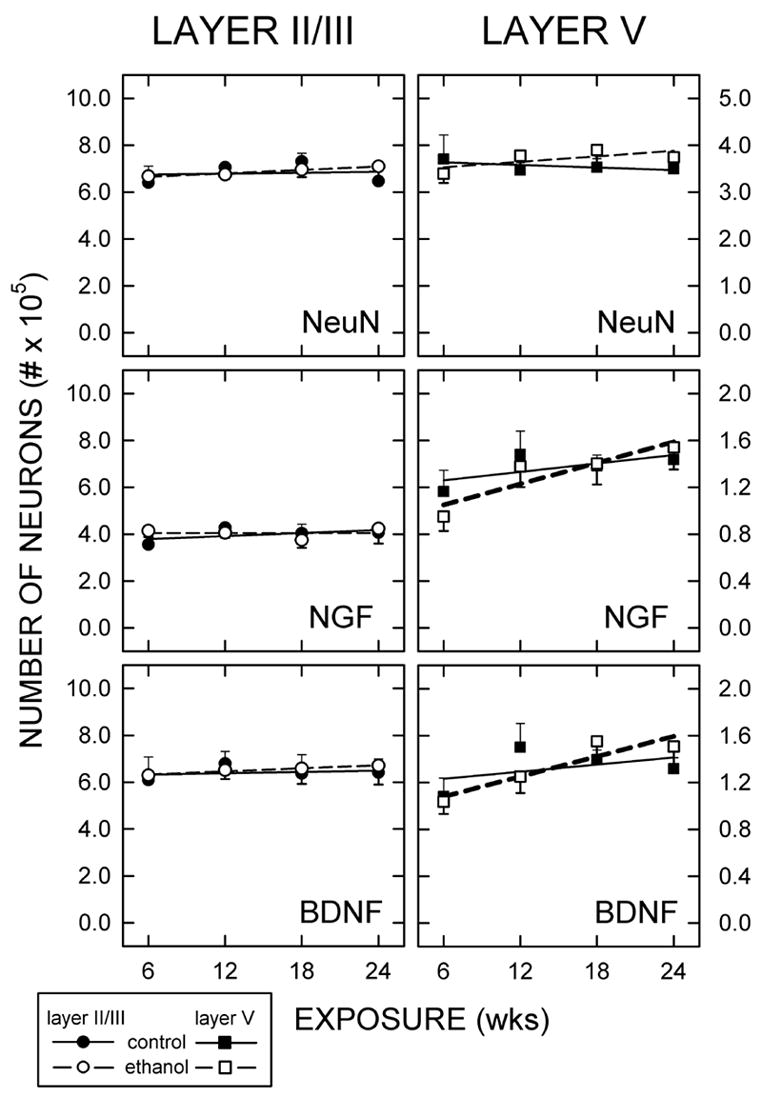
Numbers of NeuN-, NGF-, and BDNF-immunopositive cells.
Stereological methods were used to determine the total numbers of cells in layers II/III and V that were immunoreactive for NeuN, NGF, or BDNF. Rats were maintained on a control diet (Ct; filled circles) or an ethanol-containing diet (Et; open circles) for 6, 12, 18, or 24 weeks. Each symbol represents the mean of at least five rats (± the standard error of the mean). Linear regression lines were fit to the data: Ct (solid lines) and Et (dashed lines). Bolded lines indicate data that were significantly different.
Ligands
NGF
NGF-expressing cells were distributed through all layers of somatosensory cortex (Fig. 1). Based on the size and shape of their somata, as well as the ratio of the amount of perikaryon to nucleoplasm, the immunopositive cells were identified as neurons. Ultrastructural studies also show that NGF is restricted to neurons (Miller, 2000).
The distribution of immunolabeling did not differ qualitatively between Ct- and Et-fed animals. That said, the amount of NGF protein in the individual layer V pyramidal neurons and neuropil appeared to be more intense in the Et-fed groups when compared to Ct-feds. The increased intensity of NGF immunolabeling per cell after ethanol treatment was documented microdensitometrically for rats exposed to ethanol over six weeks (Fig. 4). The total optical density of NGF immunoreactivity per neuron was significantly (p<0.05) greater (+56%) in Et-fed animals than in Ct-fed rats. In contrast, no change in NGF expression per cell was apparent among layer II/III neurons.
Figure 4.
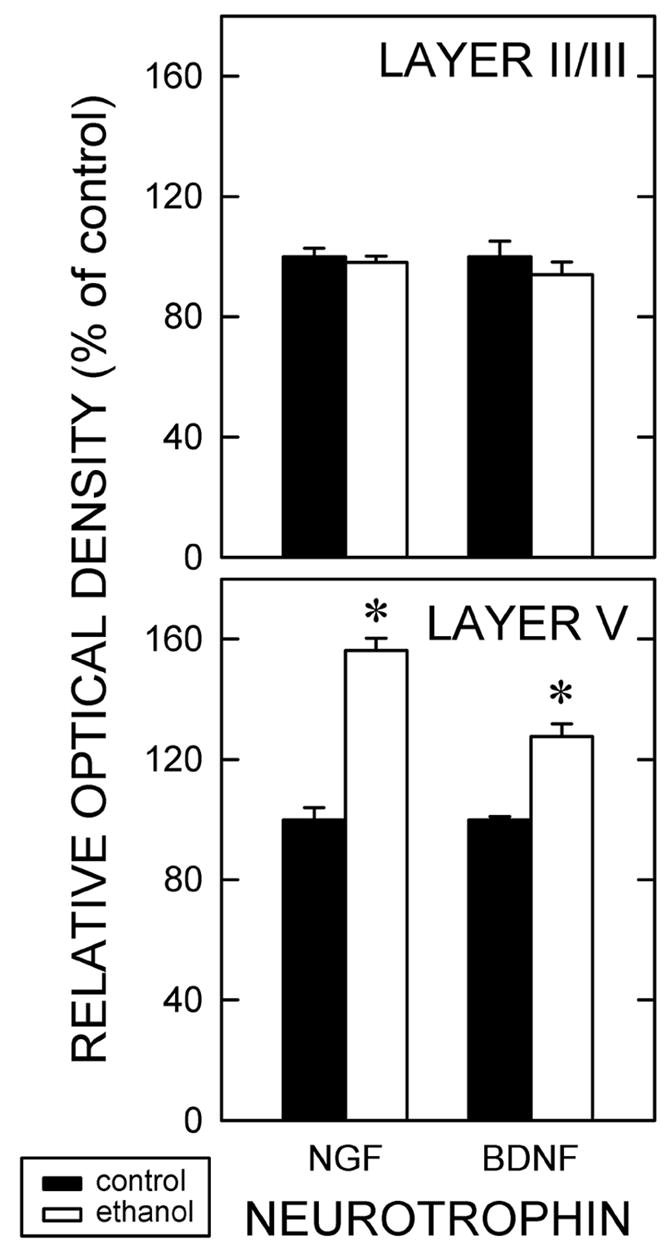
Amount of cellular NGF and BDNF expression.
Rats were exposed to ethanol episodically during six weeks. Quasi-quantitative microdensitometry was used to determine the relative intensity of NGF and BDNF immunoreactivity in both layer II/III (top) and layer V (bottom) on a per cell basis. Relative optical densities were determined in 50 cells per layer per animal using a total of five yoked pairs. Data are normalized against the amount detected in the controls. Asterisks identify statistically significant (p < 0.05) differences.
Ethanol differentially affected the number of NGF-immunopositive neurons in V (Fig. 3). In layer V, there was a significant correlation between the duration of ethanol exposure and the number of NGF-immunopositive cells (r = 0.476; n = 22; z-score = 2.199; p < 0.05). This trend was specific to Et-fed animals and was not evident in Ct-fed groups (r = 0.222; n = 22; z-score = 0.982; p =0.317). Moreover, it appeared to be laminar-specific as the number of NGF-expressing somata in layer II/III was not significantly affected by diet or length of exposure.
BDNF
As with NGF, BDNF-expressing cells were distributed through all layers of somatosensory cortex (Fig. 1). Most BDNF immunoreactivity was confined to the perikarya of neurons and proximal dendrites. In addition, some BDNF-positive profiles were identifiable as glia; they had small cell bodies, little perikarya, and multiple, thin, short processes.
No qualitative ethanol-induced differences in the distribution of BDNF-immunolabeled neurons were detectable. The only remarkable difference was that the Et-fed animals had more intensely labeled cortical neurons than that in Ct-fed rats. BDNF immunoreactivity per cell was significantly (p <0.05) increased (+28%) in layer V neurons of Et-fed rats as compared to Ct-fed rats (Fig. 4). There was no effect of ethanol on the intensity of BDNF expression in layer II/III neurons.
The effects of ethanol on the number of BDNF-positive neurons paralleled that for NGF-expressing neurons. That is, there was a significant positive correlation (r = 0.464; n = 22; z-score = 2.188; p<0.05) between the number of BDNF-immunopositive cells in layer V with the duration of ethanol exposure. No significant trend was detected for the Ct-fed animals (Fig. 3). On the other hand, the number of BDNF expressing cells in layer II/III was not affected by type or length of treatment.
Receptors
p75
Cells expressing p75 were largely confined to somata in layer V (Fig. 5). This immunolabeling was evident through the full anterior-posterior and medial-lateral extents of somatosensory cortex. Most immunopositive cells had large cell bodies. p75 immunolabeling was perikaryal; in fact, alkaline phosphatase reaction product was most intensely distributed in two rings, one of which was beneath the cell membrane and the other, which was perinuclear. Immunopositive cells typically had a large, apical process. Based on these characteristics, labeled cells appeared to be pyramidal neurons. This description concurs with previous immunohistochemical electron microscopic studies (Pitts and Miller, 1995; Miller, 2000).
Figure 5.
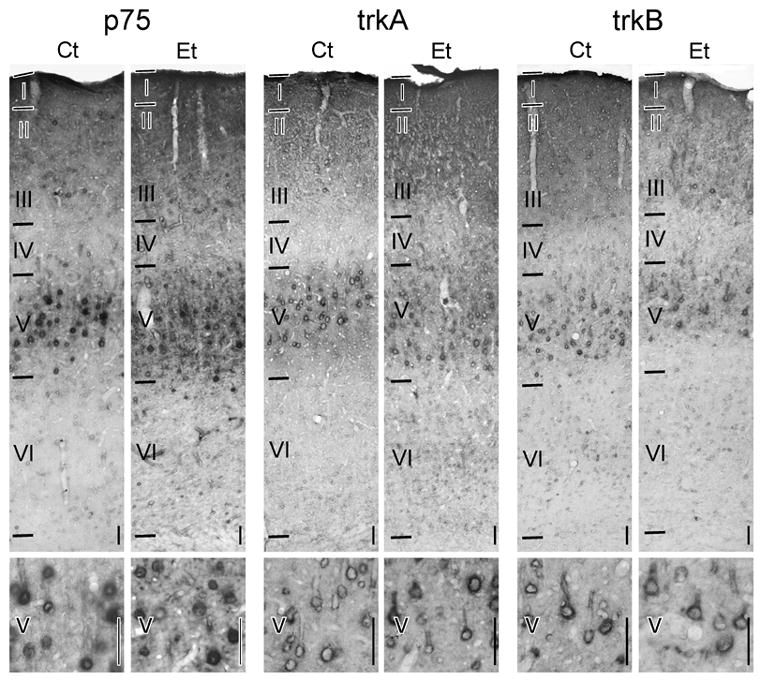
Distribution of neurotrophin and receptor expression in somatosensory cortex.
Expression of receptors, i.e., p75, trkA, and trkB, in cortices of ethanol-treated and control rats is shown. Notations as for Figure 1.
In addition to the p75-positive cell bodies, two strata of p75 immunolabeling were evident in the neuropil: in the superficial cortex (layers I and II/III) and layer V. The former was more intense. The pattern of neuropil immunolabeling was consistent with the distribution of the dendrites of layer V pyramidal neurons. Dendrites were the most common p75-positive feature detected in the neuropil (Pitts and Miller, 1995).
Ethanol treatment had no discernable qualitative effect on p75 immunolabeling. The distribution of p75 immunoreactivity was similar not only across ages, but also between the two treatment groups. Moreover, no detectable differences in p75 immunolabeling in the neuropil were observed between Ct- and Et-fed animals.
Quantitatively, the numbers of p75-expressing neurons analyzed within cortical layer V was consistent across age and no effect of the duration of the ethanol exposure was detected (Fig. 6). This was evident in the size, packing density, number, and frequency of immunolabeled neurons. Relative optical density of p75 immunolabeling as measured with microdensitometry also was not significantly affected by ethanol treatment (data not shown).
Figure 6.
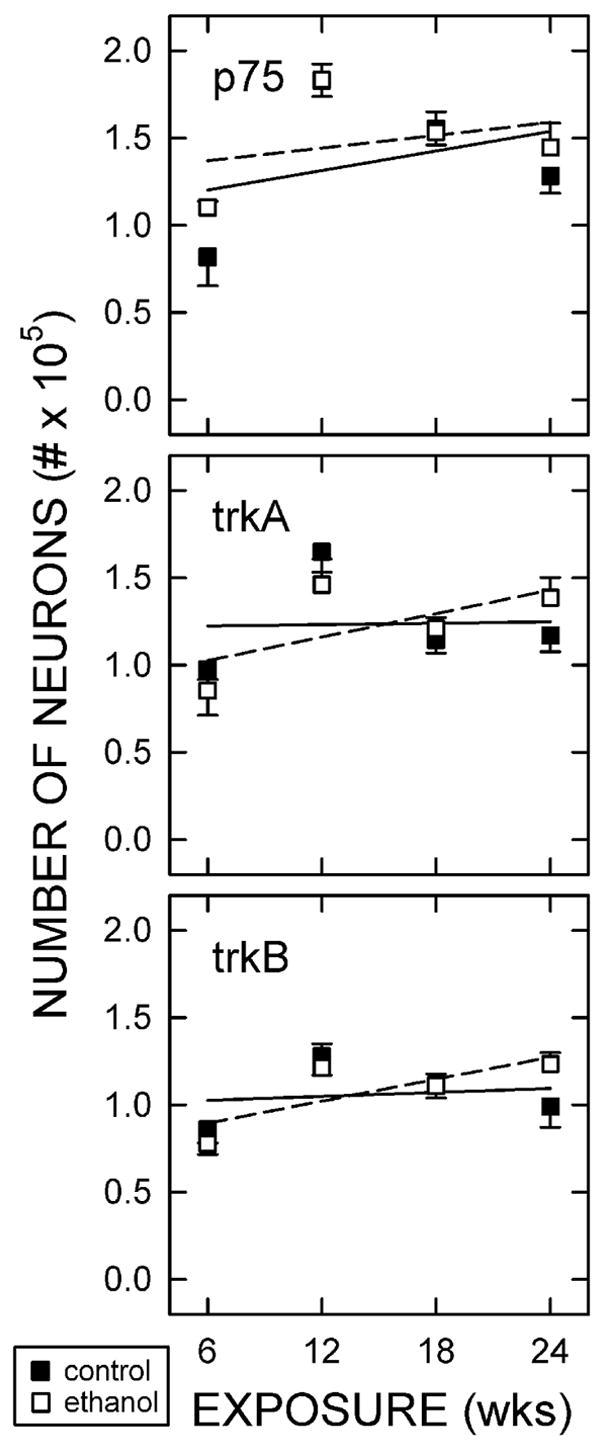
Numbers of neurons expressing neurotrophin receptors.
Stereological analysis results are illustrated here from animals maintained on the control or ethanol diet for 6, 12, 18, or 24 weeks. Data shown represent the means of at least five rats (± standard error of the means) per group. No significant differences were observed between treatment groups or with length of treatment.
trk
Like p75, trkA and trkB were expressed chiefly by pyramidal neurons in layer V (Fig. 5). TrkA- and trkB-immunopositive neurons had the same neuronal morphology and distribution pattern as p75-expressing neurons.
Ethanol did not alter the pattern of trkA or trkB immunolabeling. In addition, the number of receptor-expressing somata in layer V was not significantly different in Et-fed rats regardless of the length of treatment (Fig. 6). There was also no linear correlation between the number of trkA or trkB expressing neurons and duration on either diet. In addition, no differences in the relative intensity of receptor immunolabeling per neuron were detected (data not shown).
Correlations between ligand- and receptor-expressing neurons
The numbers of neurons in layer II/III (Table 2) or layer V (Table 3) that expressed NeuN, a neurotrophin, or a receptor were compared with each other and with the mean BEC. BEC did not correlate with total neuron number or the number of neurons expressing a neurotrophin or receptor, however, various correlations between the numbers of cells expressing a particular component of neurotrophin systems were positively correlated with one another.
Table 2.
Effect of ethanol on numbers of immunolabeled cells in layer II/III.
| CONTROL | Duration | BEC | NeuN | NGF | BDNF |
|---|---|---|---|---|---|
| Duration | 1.000 | n/a | 0.110 | 0.461 | 0.205 |
| BEC | 1.000 | n/a | n/a | n/a | |
| NeuN | 1.000 | 0.679*** | 0.346* | ||
| NGF | 1.000 | 0.630** | |||
| BDNF | 1.000 | ||||
| ETHANOL | Duration | BEC | NeuN | NGF | BDNF |
| Duration | 1.000 | −0.362 | 0.082 | 0.433 | −0.025 |
| BEC | 1.000 | −0.043 | −0.056 | 0.137 | |
| NeuN | 1.000 | 0.652** | 0.431* | ||
| NGF | 1.000 | 0.456* | |||
| BDNF | 1.000 |
Pearson correlation coefficients from all correlations tested are shown. Significant correlations are in bold and asterisks represent the p-values as follows:
p < 0.05,
p < 0.01,
p < 0.001. Blood ethanol concentration (BEC) was undetectable in Ct-fed animals, hence, determining a correlation was not possible (n/a).
Table 3.
Effect of ethanol on numbers of immunolabeled cells in layer V.
| CONTROL | Duration | BEC | NeuN | p75 | trkA | trkB | NGF | BDNF |
|---|---|---|---|---|---|---|---|---|
| Duration | 1.000 | n/a | 0.140 | −0.051 | −0.223 | 1.020 | 0.222 | 0.195 |
| BEC | 1.000 | n/a | n/a | n/a | n/a | n/a | n/a | |
| NeuN | 1.000 | 0.603** | 0.647** | 0.724*** | 0.655*** | 0.459* | ||
| p75 | 1.000 | 0.628** | 0.566* | 0.308 | 0.457 | |||
| TrkA | 1.000 | 0.726** | 0.482* | 0.544* | ||||
| TrkB | 1.000 | 0.493* | 0.630** | |||||
| NGF | 1.000 | 0.871*** | ||||||
| BDNF | 1.000 | |||||||
| ETHANOL | Duration | BEC | NeuN | p75 | trkA | TrkB | NGF | BDNF |
| Duration | 1.000 | −0.362 | 0.2951 | −0.019 | 0.281 | 0.390 | 0.531** | 0.464* |
| BEC | 1.000 | 0.196 | 0.444 | 0.138 | 0.519 | −0.052 | 0.166 | |
| NeuN | 1.000 | 0.503* | 0.544* | 0.529* | 0.493* | 0.440* | ||
| p75 | 1.000 | 0.632** | 0.596*** | 0.145 | −0.065 | |||
| TrkA | 1.000 | 0.661* | 0.471** | 0.481* | ||||
| TrkB | 1.000 | 0.490* | 0.489* | |||||
| NGF | 1.000 | 0.900*** | ||||||
| BDNF | 1.000 |
Notations as for Table 2.
DISCUSSION
Methodological considerations
Anatomical studies
In control rats, layers II/III and V are comprised of an estimated 681,000 and 355,000 neurons, respectively. These totals of NeuN-expressing cells are similar to those described in a stereological study of neuronal number in somatosensory cortex of the adolescent rat (Miller and Potempa, 1990). In comparing the present study with the previous one, two points are noteworthy.
The present study relied on NeuN to identify neurons, whereas the work of Miller and Potempa (1990) used a Nissl stain to aid in the differentiation of neurons.
The present study used the optical disector method (Gundersen et al., 1988) for neuronal counts and the previous study relied on an “older” stereological method (Smolen et al., 1983). Concordance of data from the two stereological approaches in the present study is paralleled by two virtually identical data sets generated with the optical disector and Smolen stereology in studies of total neuronal numbers in rat somatosensory cortex (cf. Miller and Potempa, 1990; Mooney and Napper, 2005). Both approaches estimate that somatosensory cortex is comprised of 2.7 million neurons.
Thus, regardless of the method used for identifying neurons and as long as rigorous, hyconsistent methods are applied, reliable data can be generated.
Biochemical studies
Data from ELISAs show that repeated episodic exposure to ethanol profoundly affects cortical neurotrophin concentrations (Miller, 2004). In fact, this kind of exposure appears to have a greater affect on neurotrophins than chronic exposure to ethanol (cf. Miller and Mooney, 2004). These studies set the stage for the present investigation.
Alignment of the data from the ELISAs with the immunohistochemical data is complicated by methodological issues and the composition of the sample preparations. (1) One of the challenges in comparing data from ELISAs and anatomical studies comes from the limitations of the two approaches. Biochemical studies of whole cortical preparations carry the implicit assumption that the distribution of the substance being measured is homogeneous within the tissue. (2) Furthermore, the tissues required for the ELISAs were obtained from fresh, non-exsanguinated brains. Blood contains neurotrophins (Aloe et al., 1996). Thus, a non-neural source may be responsible for the ethanol-induced changes in neurotrophins documented in the ELISA. This potential confound is not relevant for the anatomical studies because such tissue is intracardially perfused and fixed. This exsaunguination and fixation eliminates any potential contribution from blood-borne neurotrophins. (3) An assumption implicit in whole cortex biochemical assay is that the distribution of the substance being measured is homogeneous within the tissue. Immunohistochemical studies show that this assumption is not valid. In contrast, immunohistochemical studies are confronted with the challenge of quantifying protein content, i.e., immunoreaction product. Performed in tandem, the biochemical and anatomical studies become mutually supportive.
Organization of cortical neurotrophin systems
It is worthwhile to point out that the numbers of neurotrophin-immunopositive cells are highly correlated to each other, to NeuN expression, and to receptor immunoreactivity (Tables 2 and 3). Likewise, the numbers of p75, trkA, and trkB expressing neurons are also correlated with each other. These correlations are consistent with the conclusions that (1) ligands are expressed by neurons, (2) NGF and BDNF are co-expressed, and (3) ligands are co-expressed by receptor-positive neurons. Each of these conclusions has been documented with dual-immunolabeling approaches (Miller and Pitts, 2000; Pitts and Miller, 2000).
The strength of the statistical correlation appears to be important. For example, one of the strongest correlations is evident between the numbers of NeuN-positive cells (neurons) and NGF-expressing cells. As noted above, this correlation is in line with the concept that NGF is expressed exclusively by neurons, a conclusion supported by light and electron microscopic studies (Pitts and Miller, 1995; Miller, 2000). The notable exception to these patterns of correlations is that BDNF and NeuN co-immunolabeling, though significant, is not as well correlated. This reflects the BDNF expression by glia (Pitts and Miller, 2000).
Elements of neurotrophin systems have discrete distributions in cortex. Ligand-containing neurons have cell bodies in all layers of somatosensory cortex. Their prevalence is low in layers I and IV (Pitts and Miller, 1995; 2000) and in the neuropil of layers I–III and V. In contrast, most receptor-expressing neurons have somata in layer V and dendrites that extend into supragranular cortex. These patterns are the same as those described previously (e.g., Pitts and Miller, 1995; Fryer et al., 1996; Barone et al., 1998; Giehl et al., 1998; Robertson et al., 1998; Miller and Pitts, 2000). Based on these distribution patterns, it appears that at a minimum neurotrophins participate in anterograde communication in superficial cortex and in autocrine/paracrine systems in layer V. An extensive literature explores the role of cortical neurotrophins as retrograde communicators with basal forebrain neurons (for reviews see Thoenen, 1995; Mufson et al., 1999; Bibel and Barde, 2000; Huang and Reichardt, 2003). Nevertheless, the vast majority of receptor-expressing elements are post-synaptic sites; and only rarely are neurotrophin receptors expressed by axons. Thus, the primary modes of neurotrophin communication must be anterograde and autocrine/paracrine mechanisms, i.e., retrograde pathways must be considered less important for cortical activity.
Effects of ethanol on cortical structure
The general organization of cortex is unaffected by repeated episodic exposure to ethanol. No changes in overall volume, lamination, or laminar volume are detectable. This is consistent with studies of the effects of chronic exposure to ethanol in the adult (Miller and Rieck, 1993; Fernandes et al., 2002). Moreover, the number of neurons is also unaffected by ethanol exposure, be it relatively short (six weeks) or prolonged (24 weeks). As the consensus is that cortex does not experience neuronal generation (Kornack and Rakic, 2001), it can be inferred that ethanol does not cause the death of cortical neurons in the adult rat. No evidence of pyknosis was identified in the present study. This is interesting because although ethanol can induce the death of cortical (Seabold et al., 1998) and basal forebrain neurons, it also can induce NGF production (Miller, 2004; Miller and Mooney, 2004; Gericke et al., 2005) and NGF can prevent neuronal death in vivo, at least in the basal forebrain (Cadete-Liete et al., 2003). Thus, exposure to moderate amounts of ethanol may trigger NGF-mediated neuroprotection.
Despite no changes in cytoarchitecture, exposure to ethanol can affect the chemoarchitecture of mature cortex. A prime example is the ethanol-induced dysorganization of cholinergic projections to cortex (Arendt et al., 1988; 1989; Miller and Rieck, 1993) as well as changes in the neurotrophin systems (present study). These more subtle, ethanol-induced changes are key to understanding the etiology of cortical dysfunction, such as that occurring during alcohol-induced cognitive impairment.
Effects of ethanol on neurotrophin systems
Ethanol affects the number of neurotrophin-expressing neurons in a time-dependent fashion. Longer exposures to ethanol induce increasingly larger numbers of layer V neurons to express NGF or BDNF. This principally follows an increase in total cortical NGF content as determined with ELISA (Gericke et al., 2006). This pattern does not fully parallel that determined from other ELISA wherein cortical NGF content initially rises, but falls back to control concentrations after 24th weeks of episodic ethanol exposure (Miller, 2004). The differences between the anatomical and biochemical data may reflect the heterogenity of the neurotrophin expression in neocortex (see Methodological Considerations above). After all, as the present study shows, the ethanol-induced increase in the number of NGF-immunopositive neurons is not evident in all cortical laminae (layer V is affected, whereas layer II/III is not).
The laminar-specific effect of ethanol on neurotrophin systems is evident in two ways. (1) The number of neurons expressing a neurotrophin (NGF or BDNF) increases over time and (2) the amount of a neurotrophin expressed per cell is greater. The implications are (a) that a prime target of ethanol is layer V, the prime gateway of cortical output (Hicks and D’Amato, 1977; Wise and Jones, 1977; Leong, 1983; Huerta and Harting, 1984; Miller, 1987; Schofield et al., 1987; Hallman et al., 1988), (b) that normal cortex contains a population of latent, NGF-expressing neurons, (c) that ethanol causes the recruitment of these latent expressors, and (d) that the activity of all neurons (latent and routinely active) is promoted by ethanol. Conceivably the latter two interpretations may reflect the ethanol-induced increase in expression of a neurotrophin that is routinely expressed at sub-detectable levels.
The differential effects of ethanol on the two cortical layers sheds light onto the mechanism of action. If changes in layer V largely reflect autocrine/paracrine neurotrophin regulation, then it appears that autocrine/paracrine systems are inducible through a positive feedback system. In contrast, the lack of a change in layer II/III implies that the anterograde system is constitutively active. These conclusions are supported by combined neurotrophin mRNA in situ hybridization/trk isoform immunohistochemical studies (Bruns and Miller, 2006a; 2006b).
Various investigators have surmised that the etiology of alcohol-induced cognitive impairments involves ethanol-induced degeneration of the cholinergic connection between the basal forebrain and cerebral cortex (e.g., Arendt, 1994; Cadete-Liete et al., 2003; Gericke et al., 2006). This connection presumably relies on the cortical neurotrophic support of cholinergic afferents from the basal forebrain (e.g., Thoenen, 1995; Mufson et al., 1999; Bibel and Barde, 2000). It is noteworthy that though the present study focuses on somatosensory cortex (not an area that is traditionally associated with dementia), the effects of ethanol on non-parietal cortices, e.g., entorhinal and occipital cortices and hippocampus, are similar to those described for parietal (somatosensory) cortex (Miller, 2004; Miller and Mooney, 2004). Thus, the change in somatosensory cortex described in the present study appear to be common to other regions including those associated with dementias.
The present study supports this hypothesis by showing that a specific target of ethanol in the mature cortex is layer V neurons, the principle neurotrophin receptive neurons. The corollary is that alcohol-induced cognitive impairments result from dysregulation of intracortical neurotrophin regulation, specifically from dysfunction of autocrine/paracrine circuits in layer V. Whether this hypothesis can be generalized to explain dementia, e.g., Alzheimer’s Disease, has yet to be determined.
Acknowledgments
This project was part of the dissertation research performed by MBB. We thank Wendi Burnette and Christine Granato for help in feeding the rats and in the immunohistochemistry, respectively. This research was supported by the Department of Veterans Affairs (MWM) and the National Institute on Alcohol Abuse and Alcoholism (AA06916 and AA07568, MWM; AA15245, MBB).
Footnotes
Publisher's Disclaimer: This is a PDF file of an unedited manuscript that has been accepted for publication. As a service to our customers we are providing this early version of the manuscript. The manuscript will undergo copyediting, typesetting, and review of the resulting proof before it is published in its final citable form. Please note that during the production process errors may be discovered which could affect the content, and all legal disclaimers that apply to the journal pertain.
References
- Aloe L, Tirassa P. The effect of long-term alcohol intake on brain NGF-target cells of aged rats. Alcohol. 1992;9:299–304. doi: 10.1016/0741-8329(92)90070-q. [DOI] [PubMed] [Google Scholar]
- Aloe L, Tuveri MA, Guerra G, Pinna L, Tirassa P, Micera A, Alleva E. Changes in human plasma nerve growth factor level after chronic alcohol consumption and withdrawal. Alcohol Clin Exp Res. 1996;20:462–465. doi: 10.1111/j.1530-0277.1996.tb01076.x. [DOI] [PubMed] [Google Scholar]
- Alonso MP, Bekinschtein M, Cammarota MR, Vianna I, Izquierdo JH, Medina Endogenous BDNF is required for long-term memory formation in the rat parietal cortex. Learn Mem. 2005;5:504–510. doi: 10.1101/lm.27305. [DOI] [PMC free article] [PubMed] [Google Scholar]
- Aloyz RJ, Fawcett P, Kaplan DR, Murphy RA, Miller FD. Activity-dependent activation of TrkB neurotrophin receptors in the adult CNS. Learn Mem. 1999;6:216–231. [PMC free article] [PubMed] [Google Scholar]
- Arendt T. Impairment in memory function and neurodegenerative changes in the cholinergic basal forebrain system induced by chronic intake of ethanol. J Neural Trans Supplementum. 1994;44:173–187. doi: 10.1007/978-3-7091-9350-1_13. [DOI] [PubMed] [Google Scholar]
- Arendt T, Allen Y, Marchbanks RM, Schugens MM, Sinden M, Lantos PL, Gray JA. Cholinergic system and memory in the rat: effects of chronic ethanol, embryonic basal forebrain brain transplants and excitotoxic lesions of cholinergic basal forebrain projection system. Neuroscience. 1989;33:435–462. doi: 10.1016/0306-4522(89)90397-7. [DOI] [PubMed] [Google Scholar]
- Arendt T, Allen Y, Sinden J, Schugens MM, Marchbanks RM, Lantos PL, Gray JA. Cholinergic-rich brain transplants reverse alcohol-induced memory deficits. Nature. 1988;332:448–450. doi: 10.1038/332448a0. [DOI] [PubMed] [Google Scholar]
- Baek JK, Heaton MB, Walker DW. Chronic alcohol ingestion: nerve growth factor gene expression and neurotrophic activity in rat hippocampus. Alcohol Clin Exp Res. 1994;18:1368–1376. doi: 10.1111/j.1530-0277.1994.tb01438.x. [DOI] [PubMed] [Google Scholar]
- Baek JK, Heaton MB, Walker DW. Up-regulation of high-affinity neurotrophin receptor, trk B-like protein on western blots of rat cortex after chronic ethanol treatment. Mol Brain Res. 1996;40:161–164. doi: 10.1016/0169-328x(96)00109-x. [DOI] [PubMed] [Google Scholar]
- Barone S, Jr, Haykal-Coates N, Parran DK, Tilson HA. Gestational exposure to methylmercury alters the developmental pattern of trk-like immunoreactivity in the rat brain and results in cortical dysmorphology. Dev Brain Res. 1998;109:13–31. doi: 10.1016/s0165-3806(98)00038-8. [DOI] [PubMed] [Google Scholar]
- Berninger B, Schinder AF, Poo MM. Synaptic reliability correlates with reduced susceptibility to synaptic potentiation by brain-derived neurotrophic factor. Learn Mem. 1999;6:232–242. [PMC free article] [PubMed] [Google Scholar]
- Bibel M, Barde YA. Neurotrophins: key regulators of cell fate and cell shape in the vertebrate nervous system. Genes Dev. 2000;14:2919–2937. doi: 10.1101/gad.841400. [DOI] [PubMed] [Google Scholar]
- Bruns MB, Miller MW. Functional nerve growth factor and trkA autocrine/paracrine circuits in adult rat cortex are revealed by episodic ethanol exposure and withdrawal. J Neurochem. 2006a doi: 10.1111/j.1471-4159.2006.04301.x. in press. [DOI] [PubMed] [Google Scholar]
- Bruns MB, Miller MW. Episodic ethanol exposure and withdrawal affect transcription of neurotrophins and their receptors in adult rat cortex. Alcohol Clin Exp Res. 2006b;30:67A. [Google Scholar]
- Cadete-Leite A, Pereira PA, Madiera MD, Paula-Barbosa MM. Nerve growth factor prevents cell death and induced hypertrophy of basal forebrain neurons in rats withdrawn from prolonged ethanol intake. Neuroscience. 2003;119:1055–1069. doi: 10.1016/s0306-4522(03)00205-7. [DOI] [PubMed] [Google Scholar]
- Canossa M, Griesbeck O, Berninger B, Campana G, Kolbeck R, Thoenen H. Neurotrophin release by neurotrophins: implications for activity-dependent neuronal plasticity. Proc Natl Acad Sci USA. 1997;94:13279–13286. doi: 10.1073/pnas.94.24.13279. [DOI] [PMC free article] [PubMed] [Google Scholar]
- Casella GT, Bunge MB, Wood PM. Improved immunocytochemical identification of neural, endothelial, and inflammatory cell types in paraffin-embedded injured adult rat spinal cord. J Neurosci Methods. 2004;139:1–11. doi: 10.1016/j.jneumeth.2004.04.008. [DOI] [PubMed] [Google Scholar]
- Chao MV. Trophic factors: An evolutionary cul-de-sac or door into higher neuronal function? J Neurosci Res. 2000;59:353–355. [PubMed] [Google Scholar]
- Charness ME. Clinical and pathologic overview of the brain disorders in alcoholics. NIAAA Res Monogr. 1993;22:15–35. [Google Scholar]
- Cohen J, Cohen P. Applied Multiple Regression/correlation Analysis for the Behavioral Sciences. Lawrence Erlbaum Assoc; Hillsdale NJ: 1983. [Google Scholar]
- Conner JM, Lauterborn JC, Gall CM. Anterograde transport of neurotrophin proteins in the CNS - a reassessment of the neurotrophic hypothesis. Rev Neurosci. 1998;9:91–103. doi: 10.1515/revneuro.1998.9.2.91. [DOI] [PubMed] [Google Scholar]
- Conner JM, Lauterborn JC, Yan Q, Gall CM, Varon S. Distribution of brain-derived neurotrophic factor (BDNF) protein and mRNA in the normal adult rat CNS: evidence for anterograde axonal transport. J Neurosci. 1997;17:2295–2313. doi: 10.1523/JNEUROSCI.17-07-02295.1997. [DOI] [PMC free article] [PubMed] [Google Scholar]
- Donoghue JP, Wise SP. The motor cortex of the rat: cytoarchitecture and microstimulation mapping. J Com Neurol. 1982;212:76–88. doi: 10.1002/cne.902120106. [DOI] [PubMed] [Google Scholar]
- Dow KE, Riopelle RJ. Ethanol neurotoxicity: effects on neurite formation and neurotrophic factor production in vitro. Science. 1985;228:591–593. doi: 10.1126/science.3983644. [DOI] [PubMed] [Google Scholar]
- Dubus P, Faucheux B, Boissiere F, Groppi A, Vital C, Vital A, Agid Y, Hirsch EC, Merlio JP. Expression of trk isoforms in brain regions and in the striatum of patients with Alzheimer’s Disease. Exp Neurol. 2000;165:285–294. doi: 10.1006/exnr.2000.7447. [DOI] [PubMed] [Google Scholar]
- Escobar ML, Figueroa-Guzman Y, Gomez-Palacio-Schjetnan A. In vivo insular cortex LTP induced by brain-derived neurotrophic factor. Brain Res. 2003;991:274–279. doi: 10.1016/j.brainres.2003.08.015. [DOI] [PubMed] [Google Scholar]
- Fadda F, Rossetti ZL. Chronic ethanol consumption: from neuroadaptation to neurodegeneration. Prog Neurobiol. 1998;56:385–431. doi: 10.1016/s0301-0082(98)00032-x. [DOI] [PubMed] [Google Scholar]
- Fischer W, Bjorklund A, Chen K, Gage FH. NGF improves spatial memory in aged rodents as a function of age. J Neurosci. 1991;11:1889–1906. doi: 10.1523/JNEUROSCI.11-07-01889.1991. [DOI] [PMC free article] [PubMed] [Google Scholar]
- Fischer W, Wictorin K, Bjorklund A, Williams LR, Varon S, Gage FH. Amelioration of cholinergic neuron atrophy and spatial memory impairment in aged rats by nerve growth factor. Nature. 1987;329:65–68. doi: 10.1038/329065a0. [DOI] [PubMed] [Google Scholar]
- Fryer RH, Kaplan DR, Feinstein SC, Radeke MJ, Grayson DR, Kromer LF. Developmental and mature expression of full-length and truncated trkB receptors in the rat forebrain. J Comp Neurol. 1996;374:21–40. doi: 10.1002/(SICI)1096-9861(19961007)374:1<21::AID-CNE2>3.0.CO;2-P. [DOI] [PubMed] [Google Scholar]
- Gericke CA, Schulte-Herbrüggen O, Arendt T, Hellweg R. J Neural Trans. Vol. 113. 2006. Chronic alcohol intoxication in rats leads to a strong but transient increase in NGF levels in distinct brain regions; pp. 813–820. [DOI] [PubMed] [Google Scholar]
- Giehl KM, Schütte A, Mestres P, Yan Q. The survival-promoting effect of glial cell line-derived neurotrophic factor on axotomized corticospinal neurons in vivo is mediated by an endogenous brain-derived neurotrophic factor mechanism. J Neurosci. 1998;18:7351–7360. doi: 10.1523/JNEUROSCI.18-18-07351.1998. [DOI] [PMC free article] [PubMed] [Google Scholar]
- Gorski JA, Zeiler SR, Tamowski S, Jones KR. Brain-derived neurotrophic factor is required for the maintenance of cortical dendrites. J Neurosci. 2003;23:6856–6865. doi: 10.1523/JNEUROSCI.23-17-06856.2003. [DOI] [PMC free article] [PubMed] [Google Scholar]
- Gundersen HJ, Bagger P, Bendtsen TF, Evans SM, Korbo L, Marcussen N, Moller A, Nielsen K, Nyengaard JR, Pakkenberg B, Sorensen FB, Vesterby A, West MJ. The new stereological tools: disector, fractionator, nucleator and point sampled intercepts and their use in pathological research and diagnosis. APMIS. 1988;96:857–881. doi: 10.1111/j.1699-0463.1988.tb00954.x. [DOI] [PubMed] [Google Scholar]
- Ha DH, Robertson RT, Roshanaei M, Weiss JH. Enhanced survival and morphological features of basal forebrain cholinergic neurons in vitro: role of neurotrophins and other potential cortically derived cholinergic trophic factors. J Comp Neurol. 1999;406:156–170. [PubMed] [Google Scholar]
- Hallman LE, Schofield BR, Lin C-S. Dendritic morphology and axon collaterals of corticotectal, corticopontine, and callosal neurons in layer V of primary visual cortex of the hooded rat. J Comp Neurol. 1988;272:149–160. doi: 10.1002/cne.902720111. [DOI] [PubMed] [Google Scholar]
- Hellweg R, Fischer W, Hock C, Gage FH, Bjorklund A, Thoenen H. Nerve growth factor levels and choline acetyltransferase activity in the brain of aged rats with spatial memory impairments. Brain Res. 1990;537:123–130. doi: 10.1016/0006-8993(90)90348-f. [DOI] [PubMed] [Google Scholar]
- Hicks SP, D’Amato CJ. Locating corticospinal neurons by retrograde axonal transport of horseradish peroxidase. Exp Neurol. 1977;56:410–420. doi: 10.1016/0014-4886(77)90357-0. [DOI] [PubMed] [Google Scholar]
- Hock C, Heese K, Muller-Spahn F, Hulette C, Rosenberg C, Otten U. Decreased trkA neurotrophin receptor expression in the parietal cortex of patients with Alzheimer’s Disease. Neurosci Lett. 1998;241:151–154. doi: 10.1016/s0304-3940(98)00019-6. [DOI] [PubMed] [Google Scholar]
- Hoener MC, Hewitt E, Conner JM, Costello JW, Varon S. Nerve growth factor (NGF) content in adult rat brain tissues is several-fold higher than generally reported and is largely associated with sedimentable fractions. Brain Res. 1996;728:47–56. [PubMed] [Google Scholar]
- Huang EJ, Reichardt LF. Trk receptors: roles in neuronal signal transduction. Ann Rev Biochem. 2003;72:609–642. doi: 10.1146/annurev.biochem.72.121801.161629. [DOI] [PubMed] [Google Scholar]
- Huerta MF, Harting JK. The mammalian superior colliculus: studies of its morphology and connections. In: Venagas H, editor. Comparative Neurology of the Optic Tectum. Plenum; New York: 1984. pp. 687–773. [Google Scholar]
- Ivy GO, Killackey HP. The ontogeny of the distribution of callosal projection neurons in rat parietal cortex. J Comp Neurol. 1983;195:367–389. doi: 10.1002/cne.901950302. [DOI] [PubMed] [Google Scholar]
- Jacobs JS, Miller MW. Expression of nerve growth factor, p75, and the high affinity neurotrophin receptors in the adult rat trigeminal system: evidence for multiple trophic support systems. J Neurocytol. 1999;28:571–595. doi: 10.1023/a:1007019422675. [DOI] [PubMed] [Google Scholar]
- Katoh-Samba R, Samba R, Takeuchi IK, Kato K. Age-related changes in levels of brain-derived neurotrophic factor in selected brain regions of rats, normal mice and senescence-accelerated mice: a comparison to those of nerve growth factor and neurotrophin-3. Neurosci Res. 1998;31:227–234. doi: 10.1016/s0168-0102(98)00040-6. [DOI] [PubMed] [Google Scholar]
- Koh S, Chang P, Collier TJ, Loy R. Loss of NGF receptor immunoreactivity in basal forebrain neurons of aged rats: correlation with spatial memory impairment. Brain Res. 1989;498:397–404. doi: 10.1016/0006-8993(89)91125-6. [DOI] [PubMed] [Google Scholar]
- Koralek KA, Olavarria J, Killackey HP. Areal and laminar organization of corticocortical projections in the rat somatosensory cortex. J Comp Neurol. 1990;299:133–150. doi: 10.1002/cne.902990202. [DOI] [PubMed] [Google Scholar]
- Kornack DR, Rakic P. Cell proliferation without neurogenesis in adult primate neocortex. Science. 2001;294:2127–2130. doi: 10.1126/science.1065467. [DOI] [PubMed] [Google Scholar]
- Kruttgen A, Moller JC, Heymach JV, Shooter EM. Neurotrophins induce release of neurotrophins by the regulated secretory pathway. Proc Natl Acad Sci USA. 1998;95:9614–9619. doi: 10.1073/pnas.95.16.9614. [DOI] [PMC free article] [PubMed] [Google Scholar]
- Leong SK. Localizing the corticospinal neurons by retrograde axonal transport of horseradish peroxidase. Exp Neurol. 1983;56:410–420. doi: 10.1016/0014-4886(77)90357-0. [DOI] [PubMed] [Google Scholar]
- Lessmann V. Neurotrophin-dependent modulation of glutamatergic synaptic transmission in the mammalian CNS. Gen Pharmacol. 1998;31:667–674. doi: 10.1016/s0306-3623(98)00190-6. [DOI] [PubMed] [Google Scholar]
- Lind D, Franken S, Kappler J, Jankowski J, Schilling K. Characterization of the neuronal marker NeuN as a multiply phosphorylated antigen with discrete subcellular localization. J Neurosci Res. 2005;79:295–302. doi: 10.1002/jnr.20354. [DOI] [PubMed] [Google Scholar]
- Lindholm D, Castren E, Berzaghi M, Blochl A, Thoenen H. Activity-dependent and hormonal regulation of neurotrophin mRNA levels in the brain - implications for neuronal plasticity. J Neurobiol. 1994;25:1362–72. doi: 10.1002/neu.480251105. [DOI] [PubMed] [Google Scholar]
- Lishman WA. Lancet. Vol. 1. 1986. Alcoholic dementia: a hypothesis; pp. 1184–1186. [DOI] [PubMed] [Google Scholar]
- Lukoyanov NV, Pereira PA, Paula-Barbosa MM, Cadete-Leite A. Nerve growth factor improves spatial learning and restores hippocampal cholinergic fibers in rats withdrawn from chronic treatment with ethanol. Exp Brain Res. 2003;148:88–94. doi: 10.1007/s00221-002-1290-7. [DOI] [PubMed] [Google Scholar]
- Lush ME, Ma L, Parada LF. TrkB signaling regulates the developmental maturation of the somatosensory cortex. Int J Dev Neurosci. 2005;23:523–536. doi: 10.1016/j.ijdevneu.2005.04.003. [DOI] [PubMed] [Google Scholar]
- MacLennan AJ, Lee N, Walker DW. Chronic ethanol administration decreases brain-derived neurotrophic factor gene expression in the rat hippocampus. Neurosci Lett. 1995;197:105–108. doi: 10.1016/0304-3940(95)11922-j. [DOI] [PubMed] [Google Scholar]
- Messing RO. Ethanol as an enhancer of neural differentiation. Alcohol Alcohol Suppl. 1993;2:289–293. [PubMed] [Google Scholar]
- Miller MW. The origin of corticospinal projection neurons in rat. Exp Brain Res. 1987;67:339–351. doi: 10.1007/BF00248554. [DOI] [PubMed] [Google Scholar]
- Miller MW. Circadian rhythm of cell proliferation in the telencephalic ventricular zone: effect of in utero exposure to ethanol. Brain Res. 1992;595:17–24. doi: 10.1016/0006-8993(92)91447-m. [DOI] [PubMed] [Google Scholar]
- Miller MW. Expression of nerve growth factor and its receptors in the somatosensory-motor cortex of Macaca nemestrina. J Neurocytol. 2000;29:453–469. doi: 10.1023/a:1007207527842. [DOI] [PubMed] [Google Scholar]
- Miller MW. Repeated episodic exposure to ethanol affects neurotrophin content in the forebrain of the mature rat. Exp Neurol. 2004;189:173–181. doi: 10.1016/j.expneurol.2004.05.026. [DOI] [PubMed] [Google Scholar]
- Miller MW. Effect of prenatal exposure to ethanol on glutamate and GABA immunoreactivity in macaque somatosensory and motor cortices: critical timing of exposure. Neuroscience. 2006;138:97–107. doi: 10.1016/j.neuroscience.2005.10.060. [DOI] [PubMed] [Google Scholar]
- Miller MW, Mooney SM. Chronic exposure to ethanol alters neurotrophin content in the basal forebrain-cortex system in the mature rat: effects on autocrine-paracrine mechanisms. J Neurobiol. 2004;60:490–498. doi: 10.1002/neu.20059. [DOI] [PubMed] [Google Scholar]
- Miller MW, Pitts FA. Neurotrophin receptors in the somatosensory cortex of the mature rat: co-localization of p75, trk, isoforms and c-neu. Brain Res. 2000;852:355–66. doi: 10.1016/s0006-8993(99)02176-9. [DOI] [PubMed] [Google Scholar]
- Miller MW, Potempa G. Numbers of neurons and glia in mature rat somatosensory cortex: effects of prenatal exposure to ethanol. J Comp Neurol. 1990;293:92–102. doi: 10.1002/cne.902930108. [DOI] [PubMed] [Google Scholar]
- Miller MW, Rieck RW. Effects of chronic ethanol administration on acetylcholinesterase activity in the somatosensory cortex and basal forebrain of the rat. Brain Res. 1993;627:104–112. doi: 10.1016/0006-8993(93)90753-a. [DOI] [PubMed] [Google Scholar]
- Miller MW, Vogt BA. Direct connections of rat visual cortex with sensory, motor, and association cortices. J Comp Neurol. 1984a;226:184–202. doi: 10.1002/cne.902260204. [DOI] [PubMed] [Google Scholar]
- Miller MW, Vogt BA. Heterotopic and homotopic callosal connections of rat visual cortex. Brain Res. 1984b;297:75–89. doi: 10.1016/0006-8993(84)90544-4. [DOI] [PubMed] [Google Scholar]
- Miller R, King MA, Heaton MB, Walker DW. The effects of chronic ethanol consumption on neurotrophins and their receptors in the rat hippocampus and basal forebrain. Brain Res. 2002;950:137–147. doi: 10.1016/s0006-8993(02)03014-7. [DOI] [PubMed] [Google Scholar]
- Mooney SM, Napper RM. Early postnatal exposure to alcohol reduces the number of neurons in the occipital but not parietal cortex of the rat. Alcohol Clin Exp Res. 2005;29:683–691. doi: 10.1097/01.alc.0000158936.40150.5a. [DOI] [PubMed] [Google Scholar]
- Mooney SM, Napper RM, West JR. Long-term effect of postnatal alcohol exposure on the number of cells in the neocortex of the rat: a stereological study. Alcohol Clin Exp Res. 1996;20:615–623. doi: 10.1111/j.1530-0277.1996.tb01663.x. [DOI] [PubMed] [Google Scholar]
- Mudo G, Jiang XH, Timmusk T, Bindoni M, Belluardo N. Change in neurotrophins and their receptor mRNAs in the rat forebrain after status epilepticus induced by pilocarpine. Epilepsia. 1996;37:198–207. doi: 10.1111/j.1528-1157.1996.tb00012.x. [DOI] [PubMed] [Google Scholar]
- Mufson EJ, Kroin JS, Sendera TJ, Sobreviela T. Distribution and retrograde transport of trophic factors in the central nervous system: functional implications for the treatment of neurodegenerative diseases. Prog Neurobiol. 1999;57:451–484. doi: 10.1016/s0301-0082(98)00059-8. [DOI] [PubMed] [Google Scholar]
- Mullen RJ, Buck CR, Smith AM. NeuN, a neuronal specific nuclear protein in vertebrates. Development. 1992;116:201–211. doi: 10.1242/dev.116.1.201. [DOI] [PubMed] [Google Scholar]
- Nishio T, Furukawa S, Akiguchi I, Oka N, Ohnishi K, Tomimoto H, Nakamura S, Kimura J. Cellular localization of nerve growth factor-like immunoreactivity in adult rat brain: quantitative and immunohistochemical study. Neuroscience. 1994;60:67–84. doi: 10.1016/0306-4522(94)90204-6. [DOI] [PubMed] [Google Scholar]
- Pantazis NJ, Dohrman DP, Goodlett CR, Cook RT, West JR. Vulnerability of cerebellar granule cells to alcohol-induced cell death diminishes with time in culture. Alcohol Clin Exp Res. 1993;17:1014–1021. doi: 10.1111/j.1530-0277.1993.tb05657.x. [DOI] [PubMed] [Google Scholar]
- Okuno H, Tokuyama W, Li YX, Hashimoto T, Miyashita Y. Quantitative evaluation of neurotrophin and trk mRNA expression in visual and limbic areas along the occipito-temporo-hippocampal pathway in adult macaque monkeys. J Comp Neurol. 1999;408:378–398. [PubMed] [Google Scholar]
- Park I-K, Hou X, Lee K-Y, Park O, Lee KY, Kim M-Y, Min T-S, Lee G-J, Kim W-S, Kim M. Distribution of trkA in cerebral cortex and diencephalon of the mongolian gerbil after birth. J Vet Sci. 2004;5:303–307. [PubMed] [Google Scholar]
- Pitts AF, Miller MW. Expression of nerve growth factor, p75, and trk in the somatosensory and motor cortices of mature rats: evidence for local trophic support circuits. Somatosens Mot Res. 1995;12:329–342. doi: 10.3109/08990229509093666. [DOI] [PubMed] [Google Scholar]
- Pitts AF, Miller MW. Expression of nerve growth factor, brain-derived neurotrophic factor, and neurotrophin-3 in the somatosensory cortex of the mature rat: coexpression with high-affinity neurotrophin receptors. J Comp Neurol. 2000;418:241–254. doi: 10.1002/(sici)1096-9861(20000313)418:3<241::aid-cne1>3.0.co;2-m. [DOI] [PubMed] [Google Scholar]
- Rajakumar N, Leung LS, Ma J, Rajakumar B, Rushlow W. Altered neurotrophin receptor function in the developing prefrontal cortex leads to adult-onset dopaminergic hyperresponsivity and impaired prepulse inhibition of acoustic startle. Biol Psychiatry. 2004;55:797–803. doi: 10.1016/j.biopsych.2003.12.015. [DOI] [PubMed] [Google Scholar]
- Robertson RT, Gallardo KA, Claytor KJ, Ha DH, Ku KH, Yu BP, Lauterborn JC, Wiley RG, Yu J, Gall CM, Leslie FM. Neonatal treatment with 192 IgG-saponin produces long-term forebrain cholinergic deficits and reduces dendritic branching and spine density of neocortical pyramidal neurons. Cereb Cortex. 1998;8:142–155. doi: 10.1093/cercor/8.2.142. [DOI] [PubMed] [Google Scholar]
- Savaskan E, Muller-Spahn F, Olivieri G, Bruttel S, Otten U, Rosenberg C, Hulette C, Hock C. Alterations in trkA, trkB and trkC receptor immunoreactivities in parietal cortex and cerebellum in Alzheimer’s Disease. Eur Neurol. 2000;44:172–180. doi: 10.1159/000008229. [DOI] [PubMed] [Google Scholar]
- Schofield BR, Hallman LE, Lin CS. Morphology of corticotectal cells in the primary visual cortex of hooded rats. J Comp Neurol. 1987;261:85–97. doi: 10.1002/cne.902610107. [DOI] [PubMed] [Google Scholar]
- Seabold GK, Luo J, Miller MW. Effect of ethanol on neurotrophin-mediated cell survival and receptor expression in cultures of cortical neurons. Dev Brain Res. 1998;108:139–145. doi: 10.1016/s0165-3806(98)00043-1. [DOI] [PubMed] [Google Scholar]
- Singh TD, Mizuno K, Kohno T, Nakamura S. BDNF and trkB mRNA expression in neurons of the neonatal mouse barrel field cortex: normal development and plasticity after cauterizing facial vibrissae. Neurochem Res. 1997;22:791–797. doi: 10.1023/a:1022075508176. [DOI] [PubMed] [Google Scholar]
- Steigerwald ES, Miller MW. Performance by adult rats in sensory-mediated radial arm maze tasks is not impaired and may be transiently enhanced by chronic exposure to ethanol. Alcohol Clin Exp Res. 1997;21:1553–1559. [PubMed] [Google Scholar]
- Thoenen H. Neurotrophins and neuronal plasticity. Science. 1995;270:593–598. doi: 10.1126/science.270.5236.593. [DOI] [PubMed] [Google Scholar]
- Victor M. Alcoholic dementia. Can J Neurol Sci. 1994;21:88–99. doi: 10.1017/s031716710004899x. [DOI] [PubMed] [Google Scholar]
- Walker DW, Freund G. Impairment of shuttle box avoidance learning following prolonged alcohol consumption in rats. Physiol Behav. 1971;7:773–778. doi: 10.1016/0031-9384(71)90147-8. [DOI] [PubMed] [Google Scholar]
- Walker DW, Hunter BE. Short-term memory impairment following chronic alcohol consumption in rats. Neuropsychologia. 1978;16:545–553. doi: 10.1016/0028-3932(78)90082-9. [DOI] [PubMed] [Google Scholar]
- Wise SP, Jones EG. Cells of origin and terminal distribution of descending projections of the rat somatic sensory cortex. J Comp Neurol. 1977;175:129–158. doi: 10.1002/cne.901750202. [DOI] [PubMed] [Google Scholar]
- Yan Q, Radeke MJ, Matheson CR, Talvenheimo J, Welcher AA, Feinstein SC. Immunocytochemical localization of TrkB in the central nervous system of the adult rat. J Comp Neurol. 1997;378:135–157. [PubMed] [Google Scholar]