Abstract
This paper uses correspondence analysis to examine the developmental patterns in the cytoarchitecture of the human cerebral cortex from birth to 72 months. The study is based on data collected by the late J. L. Conel, which consist of over 4 million individual measurements of six microscopic neuroanatomic features for each of six cortical layers in 46 cytoarchitecturally distinct regions. We analyze 1,727 profiles of development over eight age-points (term birth, 1, 3, 6, 15, 24, 48, and 72 postnatal months) resulting from the combinations of neuroanatomic feature, cortical layer, and brain cytoarchitectural region in the Conel data. The profiles for any given combination of feature and layer are found to be remarkably similar in all regions of the brain, and therefore the developmental patterns of different cytoarchitectural regions are not distinguishable from one another. Developmental change is most rapid at the earlier stages; of the total change in profile patterns observed, more than one-third occurs between birth and 6 months, about one-third occurs between 6 and 15 months, and less than one-third occurs between 15 and 72 months. The majority of the variance in developmental profiles is accounted for by the six microscopic, neuroanatomic features. Correspondence analysis shows that Conel’s data are highly consistent and reliable.
Keywords: Conel, Brodmann areas, Von Economo areas, neuron packing density, postnatal cortical development
The basic processes of mammalian cerebral cortical development in early fetal life are accepted to be fundamentally alike in all cortical regions (e.g., the development of loci of neuronal precursor cell proliferation, routes of neuronal migration, long-distance cortical connections) (1). Distinct regional patterns of cortical cytoarchitecture have been identified in postnatal humans (2–5), but most work examining changes in the microscopic neuroanatomic features of cortical cytoarchitecture in human infancy and childhood has focused on one or a few regions at an age-point. There has been no research synthesizing developmental profiles for major neuroanatomic features in different cortical layers across cytoarchitecturally distinct regions. A unique source of data for such a synthesis is the collection of measurements published by the late J. L. Conel (6–13). Applying correspondence analysis to Conel’s data, we describe the similarities and differences in the patterns of 1,727 developmental profiles obtained by combinations of microscopic, neuroanatomic features, cortical layers, and cytoarchitectural regions (gyri) over the first 6 years of postnatal human cortical development.
METHODS
Data.
From 1939 to 1967, J. L. Conel published eight volumes, each devoted to a single postnatal age-point, of data on the microscopic neuroanatomic features of the human cerebral cortex from term birth to age 72 months (6–13). We have extracted 1,727 developmental profiles of measurement for this study. Each profile consists of measurements at eight developmental stages: birth, 1, 3, 6, 15, 24, 48, and 72 months. In the tabular data reported by Conel, the datum for each developmental stage for each profile represents the mean value of 30 independent measurements per cortical cytoarchitectural region per cortical layer per brain for four to nine brains per age-point (120–270 measurements per datum). The individual measurements made by Conel number more than four million. The 1,727 profiles result from specific combinations of 6 neuroanatomic features, 6 cortical layers and 2 fiber systems, and up to 49 cytoarchitectural cortical regions. The distribution of profiles by feature and layer is shown in Table 1. The entry in each cell is the number of profiles of cytoarchitecturally distinct regions represented in each combination of feature and layer. Some combinations do not occur in the Conel data.
Table 1.
Distribution of cases by features (rows) and layers (columns)
| Features | Layers
|
||||||||
|---|---|---|---|---|---|---|---|---|---|
| I | II | III | IV | V | VI | S* | V† | Total | |
| Layer width | 43 | 43 | 41 | 43 | — | 41 | — | 41 | 252 |
| Neuron dns.‡ | 46 | 44 | 44 | 46 | — | 43 | — | 43 | 266 |
| Somal width | — | 43 | 43 | 43 | — | 43 | — | 43 | 215 |
| Somal height | — | 43 | 43 | 43 | — | 43 | — | 43 | 215 |
| Cajal dns.§ | 49 | 48 | 49 | 49 | 48 | 49 | 49 | 49 | 390 |
| M. fiber¶ | 49 | 48 | 48 | 48 | 49 | 49 | 49 | 49 | 389 |
| Total | 187 | 269 | 268 | 272 | 97 | 268 | 98 | 268 | 1727 |
*Subcortical fibers.
Vertical fibers.
Neuron packing density.
Large fiber density (Cajal stain).
Myelinated fiber density (Weigert stain).
Neuroanatomic Features.
The six neuroanatomic features were measured as follows: layer width, cortical layer thickness (in mm) for left hemisphere gyri; neuron packing density, numbers of neurons per unit of cortical volume (0.001 mm3); somal width, midrange cell width in microns; somal height, midrange cell height in microns; large fiber density, numbers of Cajal or Golgi-Cox stain-positive large fibers (large-diameter axons and dendrites) per unit area (0.005 mm2) in microscopic fields of the left hemisphere; and myelinated fiber density, number of Weigert stain-positive large myelinated axons per unit area (0.005 mm2) in microscopic fields of the right hemisphere. Conel data not used in the present study include neuron packing density and somal height and width in sublayers of layers III, V, and VI and large myelinated axon density and large fiber density in sublayers of layers III, V, and VI.
Cortical Layers and Fiber Systems.
The six cortical layers analyzed were coded as I, II, III, IV, V, and VI and the two fiber systems S (Subcortical) and V (Vertical) [Cajal or Golgi-Cox stain-positive fibers and Weigert (myelinated) stain-positive fibers].
Cytoarchitectural Regions.
Depending on the feature measured, the number of cytoarchitecturally distinct regions that Conel measured ranged from 41 to 49 Von Economo-classified gyri, which account for about 73% of all cortical surface area. Conel did not measure values for 14 gyri, especially from orbitofrontal, anterior cingulate, and infralimbic regions (Von Economo gyri FG, FH, FI, FJ, FK, FL, FM, FN, TD, TH, PA, PC, LB, and LF). We used Conel’s original data uncorrected for shrinkage during tissue processing or for stereological error. Because correspondence analysis considers only the relative differences among profiles, the results remain invariant under multiplication of the whole profile by constants, and therefore correcting for shrinkage and for stereological error would not affect the results.
Multivariate Analysis.
Correspondence analysis was applied as a descriptive technique to obtain a multidimensional representation of the similarities among the 1,727 developmental profiles and the eight developmental stages in a common space for comparisons. In this Euclidean space, profiles (and developmental stages) that are more similar to each other are placed closer to each other than profiles (and stages) that are less similar. The data consist of a matrix with 1,727 rows and 8 columns. The rows represent the profiles of the combination of variables shown in Table 1, whereas the columns represent the developmental stages (age-points of the data). The correspondence analysis used is standard (14–17). The steps are as follows. First, the raw 1,727-row by 8-column data matrix, A, with cell entries, aij, is normalized by computing a new matrix, H, with the ijth cell entry given by hij = aij/√(ai⋅ a⋅j), where aij is the original cell frequency, ai⋅ is the total sum for row i, and a⋅j is the total sum for column j. Second, the normalized matrix is analyzed by singular value decomposition into its triple product, UDVT, where U contains row scores, VT contains column scores, and D is a diagonal matrix of singular values. Third, the singular vectors of the U and VT matrices are used to compute maximally discriminating scores (i.e., optimal scores, canonical scores, variates) for the rows and columns of A. The rescaling formulae for the optimal scores are Xi = Ui√(a⋅⋅/ai⋅) and Yj = Vj√(a⋅⋅/a⋅j).
Because correspondence analysis scales the profiles solely in terms of overall shape similarity, the resulting row scores remain invariant under multiplication of the data of a given profile by a constant. Thus, two profiles that have the same “shape” will be scaled as identical regardless of how much they differ in absolute magnitude.
In addition to scaling the profiles in terms of similarity, correspondence analysis scales the eight developmental stages, providing a representation of the relative similarity of the age-specific data among them that will quantify the amount of change from one stage to another.
RESULTS
Graphical Display of Scaling.
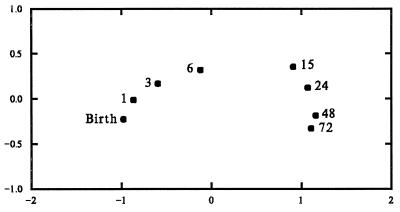
Visualizable spatial models capture the essential structure in the Conel data and display its stability and variability in comprehensible form. The correspondence analysis, based on 1,727 row scores and 8 column scores, produced two dimensions with singular values of 0.449 and 0.116, accounting for, respectively, 56.7% and 14.6% of the variance. With 71.3% of the variance accounted for by the first two dimensions of the correspondence analysis, a reasonable characterization of the Conel data can be obtained by examining these two dimensions alone.
Developmental Stages.
Fig. 1 shows a scatter plot of the first two column scores. The relative positions of the eight points represent the similarity among the points as estimated from the total set of 1,727 profile measurements. In this representation, developmental stages more similar to each other are placed closer to each other than stages that are less similar. The figure displays a smooth regular development from birth to 6 years.
Figure 1.
Plot of the first two factors of the column scores (age-points) resulting from the correspondence analysis of the Conel data.
The distances between points accurately portray the amount of change between points. There is more change, for example, between birth and 1 month than between 48 and 72 months. More than one-third of all change takes place in the first 6 months. There is a dramatic gap between 6 and 15 months, a period in which approximately another one-third of the total change takes place. Less than one-third of the total developmental change takes place from 15 months to 72 months. The figure provides striking evidence that the rate of change in cytoarchitecture of the human cortex slows dramatically around 15 months of age.
Another perspective on the changes in growth rates may be obtained by estimating the percent of total change per month over each period. There is a systematic decline, per month of development, in the proportion of total change observed. Change in the first month is about 8%, change per month from 1 to 6 months about 6%, from 6 to 15 months about 4%, from 15 to 24 months about 1%, from 24 to 48 months about 0.5%, and from 48 to 72 months about 0.2%, with relatively sharp decrease in the pace of development at 15 months.
Comparison Among Profiles.
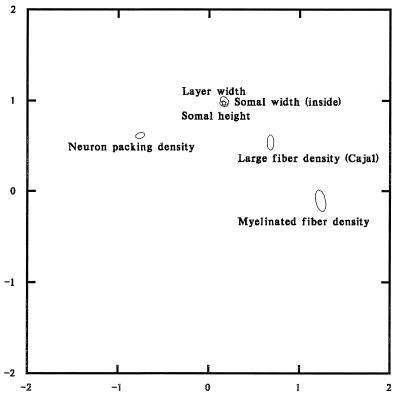
To examine clustering of patterns among profiles we grouped the profiles in three ways: by neuroanatomic feature, by cortical layer, and by cytoarchitectural region (Brodmann area). We then computed the 99% confidence ellipses of the first two dimension scores for the data within each grouping. Only neuroanatomic features showed consistent clustering (Fig. 2).
Figure 2.
Ninety-nine percent confidence ellipses for neuroanatomic features derived from the first two factors of the correspondence analysis of the Conel data.
The ellipses represent 99% confidence limits on the mean of the row scores for each neuroanatomic feature. Each ellipse summarizes over 200 profiles. Table 1 shows the exact number for each feature. The confidence ellipses are estimated from the scores of all the profiles characterizing a given feature under a bivariate normal assumption. They indicate that there are major and consistent differences in the patterns of developmental profiles associated with different neuroanatomic features. In this representation, features whose profiles are more similar to each other are closer to each other than features whose profiles are less similar. For example, the ellipses for layer width, somal width, and somal height overlap, indicating that the patterns of developmental profiles characterizing these three features are virtually indistinguishable. At the same time, neuron packing density is characterized by profiles very different from those that characterize myelinated fiber density.
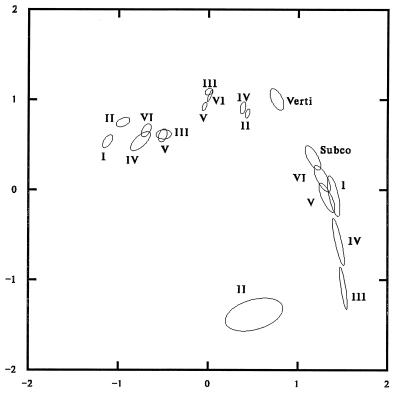
We explored whether, given a specified neuroanatomic feature, there were significant differences among profile patterns by cortical layer by producing a separate plot for each neuroanatomic feature showing the confidence ellipses for the cortical layers. There are consistent differences in the patterns of developmental profiles of cortical layers for different neuroanatomic features. Most of this variation is visually captured by the plot in Fig. 3, showing confidence ellipses for each layer for three neuroanatomic features: neuron packing density, somal height, and myelinated fiber density. (Layer width, somal width, and large fiber density are not presented; the profiles of somal width and layer width are similar to those for somal height, and large fiber density can be interpolated as between somal height and myelinated fiber density.) Each ellipse is labeled with the appropriate layer code. The six ellipses on the left represent neuron packing density. The five ellipses slightly above and to the right represent somal width. The remaining eight ellipses on the right represent myelinated fiber density. The number of profiles represented by each ellipse can be obtained from Table 1.
Figure 3.
Ninety-nine percent confidence ellipses derived from the first two factors (dimension scores) of the correspondence analysis of the Conel data on each layer of the features neuronal packing density, somal height, and myelinated fiber density. For myelinated fiber density, the confidence ellipses for the subcortical and vertical fiber systems are also shown.
The first dimension of this analysis has a clear interpretation. The negative or left end is characterized by profiles that have the greatest magnitude at birth and decrease thereafter. Neuron packing density generally tends to have the highest values at birth and decreases with age for all gyri. The positive or right end is characterized by profiles that increase from birth and reach their greatest magnitude at 72 months. Myelinated fiber density shows the greatest increase with age. The middle stages are characterized by relatively flat profiles that remain stable throughout the period.
The only neuroanatomic feature exhibiting significant variability in the second dimension is myelinated fiber density; large fiber density (not shown) shows moderate variability, and none of the other features show any significant variability in this dimension. Much of this variability is a consequence of the fact that at several areas in the earlier developmental stages, the myelinated fiber density is zero. To the extent that there is sampling variability in when and where zero counts occur, there will be variability in the “shape” of the profiles. The fact that the ellipses in Fig. 3 for the various levels of myelinated fiber density are much exaggerated in the vertical dimension illustrates this variability.
The 99% confidence limits on the mean of the row scores for each cytoarchitectural region can be summarized as being virtually identical although somewhat larger than those obtained for the neuroanatomic features and cortical layers. The only two cytoarchitectural regions whose confidence ellipses are not superimposed upon the others are the presubiculum (Von Economo area HC, Brodmann areas 27 and 35) and perirhinal cortex (Von Economo area HD, Brodmann areas 27 and 34). These two periarchicortical areas are both part of the hippocampal formation, have only several cortical layers, and are evolutionarily more primitive than neocortex. The remaining 44 cytoarchitectural regions we examined are indistinguishable in terms of their relative developmental patterns of change.
Correspondence analysis has allowed us to isolate and describe the overall patterns of similarities and differences among the relative “shapes” of the 1,727 developmental profiles. Virtually all significant variation can be accounted for by two variables: neuroanatomic feature and cortical layer. The subsets of profiles produced by the combination of these variables are enumerated in Table 1. Fig. 3 shows the relative similarities among 19 selected subgroups formed by a combination of neuroanatomic feature and cortical layer. The confidence ellipses for these subsets are compact, indicating little variability within subsets. The implication of this observation is that there is virtually no significant variability among cytoarchitectural regions in terms of their relative double-standardized changes. Comparing these results, based on double standardization of the original data, with those obtained using the original data without any transformations will help us interpret the correspondence analysis results more precisely.
Profiles Plotted in Original Units.
In correspondence analysis, two profiles that differ only in magnitude will be scaled identically. Figs. 4–6 show the plots of the raw data for neuron packing density, somal height, and myelinated fiber density corresponding to selected confidence ellipses from Fig. 3.
Figure 4.
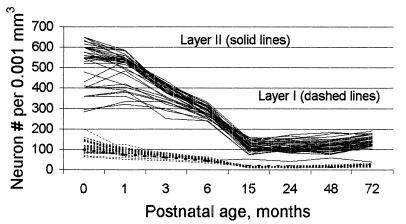
Plot of Conel’s uncorrected original data on layer I (dashed lines) and layer II (solid lines) neuron packing density (number of neurons per 0.001 mm3) versus postnatal age (months) for the Von Economo areas he studied.
Figure 6.
Plot of Conel’s uncorrected original data on layer II (dashed lines) and layer VI (solid lines) myelinated fiber density (no. per 0.005 mm2) versus postnatal age (months) for the Von Economo areas he studied.
For neuron packing density, the data for cortical layers I and II, corresponding to the two confidence ellipses with the most negative values on the first dimension of the correspondence analysis in Fig. 3, are plotted in Fig. 4. As the interpretation of the first dimension is the slope of the profile, with negative slopes on the negative end and positive slopes on the positive end, the general similarity of the two subsets of profiles in contrast to their difference in magnitudes is reflected by the fact that the two confidence ellipses are close to each other in Fig. 3. The relative slope of layer I is in fact greater than that of layer II, making its position on dimension 1 more negative. Fig. 4 shows that layer II has higher neuron packing density than layer I. Despite the differences in magnitude, the shapes of the two sets of profiles are fundamentally similar, with both generally declining to 15 months, at which point they abruptly stabilize and subsequently increase slightly to 72 months. Note that in Fig. 4 there is one layer II profile (HA, area 28, the entorhinal cortex) that does not fit the pattern (it is the single solid line among the dashed lines). (The entorhinal cortex is a more primitive form of cortex than neocortex.)
This degree of general similarity among profiles has two important implications. It implies that the various regions of the cortex are characterized by virtually identical patterns of cortical development, and it implies that Conel’s measurements are reliable. That internal consistency is an index of reliability has been known for almost 90 years (18). The data plotted in Fig. 4 do not require sophisticated statistics to demonstrate that they have a high degree of internal consistency. Though the absolute levels of measurements could conceivably be biased in some constant direction (which would not affect the results of correspondence analysis), it is difficult to account for these results other than in terms of the reliability of Conel’s measurements and the appropriateness of his samples of cortical components.
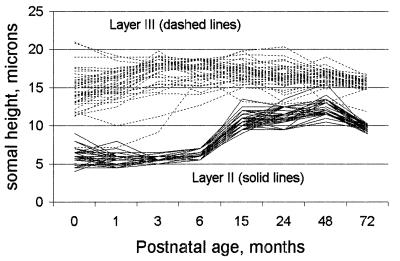
The data for somal height corresponding to the two most different subsets of the middle cluster in Fig. 3, layers II and III, are plotted in Fig. 5. The profiles for layer III, whose ellipse is at the zero point on dimension 1 of Fig. 3, are mostly rather flat in slope, with some tendency to increase from birth to 3 months and decline a little between 48 and 72 months. Layer II somal height, which is in the positive direction from layer III in Fig. 3, in fact has a generally positive slope but with rather complicated variations. The complexities include almost flat profiles until 6 months, followed by rapidly rising slopes to 15 months followed by generally rising slopes to 48 months and a final fairly sharp decline to 72 months. The same description applies to the profiles for layer IV, a close neighbor of layer II in Fig. 3.
Figure 5.
Plot of Conel’s uncorrected original data on layer II (dashed lines) and layer III (solid lines) somal height (microns) versus postnatal age (months) for the Von Economo areas he studied.
Fig. 6 shows two of the more divergent subsets of myelinated fiber density, layers II and VI, to illustrate the comments on the interpretation of the second dimension made above. The zero counts appear somewhat sporadically but, especially for layer II, add enormously to the variability in shape. The profiles all increase over the later developmental stages, with the increase most apparent after 6 months. Layer II profiles may decrease between birth and 3 months.
DISCUSSION
It may seem surprising that, except for the hippocampal formation (presubiculum and perirhinal cortex), the patterns of relative postnatal change in the cortical laminar values of the six microscopic neuroanatomic features of the human cerebral cortex studied by Conel are highly similar for all cytoarchitectural regions, even though the latter are distinguishable by the absolute values of the neuroanatomic features we studied. Our results using correspondence analysis demonstrate that the relative changes occurring in each of the Brodmann areas from birth to 72 months are essentially the same. One could speculate that areas, such as the hippocampal formation, which deviate from the overall patterns of change in neuroanatomic feature and cortical layer, may have greater vulnerability to genetic or environmental perturbances. For example, these areas are among the earliest to be affected in Alzheimer’s disease.
This similarity in the patterns of relative postnatal changes in the features of the developing human cerebral cortex suggests that a single set of rules can structure the different cortical areas in a reproducible manner across individual, cultural, and environmental conditions. Such precise developmental patterns could be generated by chemical recognition events plus correlated electrical activity among neighboring neurons (19). However, it is likely that higher-order constraints are also needed to coordinate the simultaneous development of over 50 cortical architectures from birth to 72 months across a variety of environments and cultures.
Future research should emphasize behavioral correlates of cortical development such as the presence of certain abilities found in all cultures, from extremely primitive to very sophisticated, including language acquisition, counting, storytelling to teach principles, the use of art for decoration, and technology for launching a projectile along a desired arc (20). Among societies in which greater sophistication in one or more of these abilities is attained, Okamoto et al. (20) found that, independent of their culture, children progressed through the same stages of development at the same rates. Such independence of culture in the rate of attainment and sequence of development of at least these abilities would be most easily explained by evolutionarily adapted cortical architectures capable of performing specific tasks. One such evolutionarily adapted complex behavior apparently served by specific cortical circuitry consists of the ability to detect cheating in the course of social exchange (21).
That a particular object of nature is built as it is to enable it to achieve a specific function or functions is a hypothesis that drives many scientific investigations. From this perspective, the finding of no fundamental differences in developmental patterns across neocortical and transitional neocortical areas is not intuitive and raises several interesting questions. What controls relative changes in the developing human cerebral cortex? Are the fundamental architectures laid down by genetically programmed events such as homeobox genes, biochemical clocks, and oscillators? Will correspondence analysis of the quantitative changes in the cortical laminar values of similar neuroanatomic features of developing cerebral cortex in other mammals also show invariance for cytoarchitectural region? Do the quantitative changes in the cortical laminar values of other microscopic neuroanatomic features relevant to cortical function show similar invariance for cytoarchitectural region? Are functional differences between different cytoarchitectural regions related to differences in the absolute values of certain neuroanatomic features such as monoamine inputs, which cut across all cortical areas? As correspondence analysis examines patterns of relative change, a different analytical method is required to examine this last question.
The discrete, coordinated changes between cortical layers and neuroanatomic features demonstrated here are clearly not a random phenomenon. At least some of these layer-feature coordinations seem to relate to known functional roles of the different cortical layers. For example, similarities in the relative changes in neuron packing density between layers III and V seem consistent with their roles in transmitting long-distance connections to neocortical and subcortical areas, respectively.
The descriptive use of correspondence analysis facilitates the visualization of large amounts of information and subsequent isolation of aspects of the data that account for the observed variance. The method produces dimensions that are statistically independent of each other and can be used in subsequent statistical analyses. It focuses on information due to the relative differences between measurements in the rows and columns. For constructing models of development it complements methods that explore nonorthogonal informational aspects of the data such as independent components analysis (22).
An implicit assumption of the use of autopsy studies is that examinations of different sets of individuals at different ages will provide knowledge applicable to the longitudinal development of a single individual. Conel’s data show this assumption to be largely correct for the microscopic neuroanatomic features he studied across cytoarchitectural area and cortical layer. If the data for each brain at a given age-point were independent of each other, the proportion of variance explained by correspondence analysis would be substantially lower. This assumption makes sense in that developing humans (and other organisms) are for the most part more similar to each other at any given age-point than they are different. For example, individual variations on parameters such as brain weight, neuron packing density, somal size of specific cell types, and number of neurons is approximately 15% (23–25). Kempermann et al. (26) showed that environmental enrichment increased dentate granule neurons in adult rats by 15%, suggesting that there may be an upper bound of about 15% on the degree to which environmental experience can change the genetically preprogrammed evolutionary design of cortical structure.
Further comparison of specific subsets of the general data with each other and with the timings of changes in cortical functional capabilities in the course of brain development seems justified. The remarkable reliability of Conel’s data recommends their use for such studies.
Acknowledgments
We acknowledge helpful comments by James Fallon. This work was supported in part by National Science Foundation Grant SES-9210009 (to A.K.R. and W. H. Batchelder).
References
- 1.Jacobson M. Developmental Neurobiology. 3rd Ed. New York: Plenum; 1991. pp. 82–83. [Google Scholar]
- 2.Brodmann K. Vergleichende Lokalisationslehre der Grosshirnrinde in ihren Prinzipien Dargestellt auf Grund des Zellenbaues. Leipzig: Barth; 1909. [Google Scholar]
- 3.Von Economo C. The Cytoarchitectonics of the Human Cerebral Cortex. Oxford: Oxford Univ. Press; 1929. [Google Scholar]
- 4.Flechsig P. Neurologisches Centralblatt. 1898;22:1079–1080. [Google Scholar]
- 5.Benson D F. The Neurology of Thinking. New York: Oxford Univ. Press; 1994. [Google Scholar]
- 6.Conel J L. Postnatal Development of the Human Cerebral Cortex: The Cortex of the Newborn. Vol. 1. Cambridge, MA: Harvard Univ. Press; 1939. [Google Scholar]
- 7.Conel J L. Postnatal Development of the Human Cerebral Cortex: The Cortex of the One-Month Infant. Vol. 2. Cambridge, MA: Harvard Univ. Press; 1941. [Google Scholar]
- 8.Conel J L. Postnatal Development of the Human Cerebral Cortex: The Cortex of the Three-Month Infant. Vol. 3. Cambridge, MA: Harvard Univ. Press; 1947. [Google Scholar]
- 9.Conel J L. Postnatal Development of the Human Cerebral Cortex: The Cortex of the Six-Month Infant. Vol. 4. Cambridge, MA: Harvard Univ. Press; 1951. [Google Scholar]
- 10.Conel J L. Postnatal Development of the Human Cerebral Cortex: The Cortex of the Fifteen-Month Infant. Vol. 5. Cambridge, MA: Harvard Univ. Press; 1955. [Google Scholar]
- 11.Conel J L. Postnatal Development of the Human Cerebral Cortex: The Cortex of the Twenty-four-Month Infant. Vol. 6. Cambridge, MA: Harvard Univ. Press; 1959. [Google Scholar]
- 12.Conel J L. Postnatal Development of the Human Cerebral Cortex: The Cortex of the Forty-eight-Month Infant. Vol. 7. Cambridge, MA: Harvard Univ. Press; 1963. [Google Scholar]
- 13.Conel J L. Postnatal Development of the Human Cerebral Cortex: The Cortex of the Seventy-two-Month Infant. Vol. 8. Cambridge, MA: Harvard Univ. Press; 1967. [Google Scholar]
- 14.Weller S C, Romney A K. Metric Scaling: Correspondence analysis. Newbury Park: Sage; 1990. [Google Scholar]
- 15.Nishisato S. Elements of Dual Scaling: An Introduction to Practical Data Analysis. Hillsdale: Lawrence Erlbaum; 1994. [Google Scholar]
- 16.Greenacre J M. Correspondence Analysis in Practice. New York: Academic Press; 1993. [Google Scholar]
- 17.Giffi A. Nonlinear Multivariate Analysis. New York: Wiley; 1990. [Google Scholar]
- 18.Spearman C. Brit J Psychol. 1910;15:271–295. [Google Scholar]
- 19.Stryker M P. Science. 1994;263:1244–1245. doi: 10.1126/science.8122106. [DOI] [PubMed] [Google Scholar]
- 20.Okamoto Y, Case R, Bleiker C, Henderson B. Monogr Soc Res Child Dev. 1996;61:131–155. [PubMed] [Google Scholar]
- 21.Cosmides L, Tooby J. In: The Origin and Evolution of Intelligence. Scheibel A B, Schopf J W, editors. Boston: Jones and Bartlett; 1997. pp. 71–101. [Google Scholar]
- 22.Bell A J, Sejnowski T J. Neural Computation. 1995;7:1129–1159. doi: 10.1162/neco.1995.7.6.1129. [DOI] [PubMed] [Google Scholar]
- 23.Haug H. Am J Anat. 1987;180:126–142. doi: 10.1002/aja.1001800203. [DOI] [PubMed] [Google Scholar]
- 24.Hendry S, Schwark H, Jones E G, Fan J. J Neurosci. 1987;7:1503–1519. doi: 10.1523/JNEUROSCI.07-05-01503.1987. [DOI] [PMC free article] [PubMed] [Google Scholar]
- 25.Rockel A J, Hiorns R W, Powell T P. Brain. 1980;103:221–244. doi: 10.1093/brain/103.2.221. [DOI] [PubMed] [Google Scholar]
- 26.Kempermann G, Kuhn H G, Gage F H. Nature (London) 1997;386:493–495. doi: 10.1038/386493a0. [DOI] [PubMed] [Google Scholar]


