Abstract
Intracellular calcium concentration ([Ca2+]i) is a key factor controlling secretion from various cell types. We investigated how different patterns of [Ca2+]i signals evoke salt secretion via ion transport mechanisms and mucin secretion via exocytosis in dog pancreatic duct epithelial cells (PDEC). Activation of epithelial P2Y2 receptors by UTP generated two patterns of [Ca2+]i change: 2–10 μm UTP induced [Ca2+]i oscillations, whereas 100 μm UTP induced a sustained [Ca2+]i increase, both in the micromolar range. As monitored by carbon-fibre amperometry, the sustained [Ca2+]i increase stimulated a larger increase in exocytosis than [Ca2+]i oscillations, despite their similar amplitude. In contrast, patch-clamp recordings revealed that [Ca2+]i oscillations synchronously activated a K+ current as efficiently as the sustained [Ca2+]i increase. This K+ current was mediated by intermediate-conductance Ca2+-activated K+ channels (32 pS at −100 mV) which were sensitive to charybdotoxin and resistant to TEA. Activation of these Ca2+-dependent K+ channels hyperpolarized the plasma membrane from a resting potential of −40 mV to −90 mV, as monitored in perforated whole-cell configuration, in turn enhancing Na+-independent, Cl−-dependent and DIDS-sensitive HCO3− secretion, as monitored through changes in intracellular pH. PDEC therefore encode concentrations of purinergic agonists as different patterns of [Ca2+]i changes, which differentially stimulate K+ channels, the Cl−–HCO3− exchanger, and exocytosis. Thus, in addition to amplitude, the temporal pattern of [Ca2+]i increases is an important mechanism for transducing extracellular stimuli into different physiological effects.
Intracellular calcium signalling controls a broad range of biological functions, including secretion, gene expression and synaptic plasticity in both excitable and non-excitable cells (Berridge et al. 2003). It is well recognized that different patterns of increase in intracellular free Ca2+ concentration ([Ca2+]i) can be generated by changes of electrical activity or by extracellular stimuli, such as ATP or UTP, acting through P2Y receptors coupled to phospholipase C. Typically, [Ca2+]i increases are maintained at a certain level when agonists are applied to a cell for a relatively short time period, but prolonged application of agonists often induces a subsequent slow decline of [Ca2+]i level attributed to several mechanisms of desensitization. Sometimes more complex behaviours such as [Ca2+]i oscillations are observed with constant exposure to agonists. The frequency and amplitude of the oscillations depend on the balance between the mechanisms that deliver and those that clear intracellular Ca2+ (Schuster et al. 2002; Larsen et al. 2003). Such Ca2+ patterns enrich the signal transduction mechanisms and modulate the activity of several enzymes including Ca2+/calmodulin-dependent kinase II (CaMKII), Ca2+-dependent intramitochondrial dehydrogenases, and protein kinase C (Hajnóczky et al. 1995; Oancea & Meyer, 1998; Eshete & Fields, 2001). These Ca2+-dependent enzymes are partially activated by each Ca2+ spike and slowly deactivated with specific kinetics. Subsequent Ca2+ spikes may recruit additional enzyme molecules before the original ones are deactivated. Therefore, high-frequency Ca2+ oscillations can elicit a cumulative increase of enzyme activity. In T lympocytes, [Ca2+]i oscillations increase the efficacy and the information content of Ca2+ signals that modulate gene expression and cell differentiation (Dolmetsch et al. 1998). In the hippocampus, either long-term potentiation (LTP) or depression (LTD) can be elicited depending on the pattern of [Ca2+]i elevation elicited by inputs from other neurons (Lisman et al. 2002). In these examples, information (e.g. the amount of agonist) is stored in the frequency, amplitude, and shape of [Ca2+]i oscillations (‘encoding’), and the [Ca2+]i rise is translated by biochemical reactions in the cells (‘decoding’).
Ca2+ is also an important second messenger for many epithelial cell functions such as ion transport and mucin secretion (Ashton et al. 1993; Nguyen et al. 1998a,b; Ishiguro et al. 1999; Koh et al. 2000; Nguyen et al. 2001; Namkung et al. 2003; Jung et al. 2004). Pancreatic duct epithelial cells (PDEC) express P2Y2 and P2Y11 receptors linked to phospholipase C, which mobilize Ca2+ from intracellular Ca2+ stores through inositol 1,4,5-trisphosphate (IP3). We previously demonstrated that [Ca2+]i rises induced by P2Y receptors on PDEC evoked both electrolyte (K+ and Cl−) and mucin secretion (Nguyen et al. 1998a,b, 2001). However, the exact Ca2+ dynamics and their effects on different secretory mechanisms were not fully resolved. Recent single-cell studies indicate complex Ca2+ signalling that depends on the agonist concentration: low concentrations of ATP (2 or 10 μm) evoke [Ca2+]i oscillations whereas a high concentration of ATP (100 μm) induces a sustained [Ca2+]i increase. As measured with carbon-fibre amperometry, only the sustained [Ca2+]i increases stimulated exocytosis, whereas [Ca2+]i oscillations mediate only minimal exocytosis, despite peak [Ca2+]i reaching 1–2 μm in both cases (Jung et al. 2004). In this report, we therefore investigated the physiological role of oscillatory [Ca2+]i rise using different types of single-cell study. We observed that oscillatory Ca2+ signals activate Ca2+-sensitive K+ channels, hyperpolarize the membrane, and increase HCO3− secretion.
Methods
Chemicals
Stock solutions of 1 m tetraethylammonium (TEA) chloride, 1 m BaCl2, 1 m CsCl, 100 mm 4,4′-diisothio-cyanato-stilbene-2,2′-disulphonic acid disodium salt (DIDS), and 100 μm charybdotoxin (CTX) were made in Na+-rich Hepes-buffered solution; 0.1% BSA was added to the final CTX solution to reduce non-specific binding during measurement of whole-cell currrent. Stock solution of 100 mm UTP and ATP were prepared freshly, using Na+-rich, Na+-free, Na+-free and Cl−-free, Cl−-free, or Ca2+-free Hepes-buffered solutions (see below, Single-cell pHi measurement). A stock solution of 10 mm indo-1 pentapotassium salt was prepared in the filtered internal pipette solution containing 0.1 mm 1,2-bis-(o-aminophenoxy)ethane-N,N,N′,N′-tetraacetic acid tetrapotassium salt (K4-BAPTA). Stock solutions of indo-1-AM (1 mm), 2′,7′-bis-(2-carboxyethyl)-5-(and-6)-carboxyfluorescein (BCECF)-AM (2 mm), BAPTA-AM (50 mm) and pluronic F-127 (10%) were dissolved in dimethyl sulfoxide. CTX was purchased from Bachem (King of Prussia, PA, USA). Indo-1 pentapotassium salt, indo-1 AM, BCECF-AM, K4-BAPTA, and Pluronic F-127 were from Molecular Probes (Eugene, OR, USA). Antibody against IK1/SK4 channels was purchased from Alomone Laboratories (Jerusalem, Israel) and FITC-conjugated goat anti-rabbit IgG (H + l) purchased from Zymed Laboratories (San Francisco, CA, USA). All other chemicals were from Sigma-Aldrich (St Louis, MO, USA).
Cell culture
The non-transformed PDEC line, originally derived from the main pancreatic duct of the dog, was propagated on Transwell inserts (Corning Costar, Acton, MA, USA) coated with Vitrogen (Collagen, Palo Alto, CA, USA), over a confluent feeder layer of human gallbladder myofibroblasts as previously described (Oda et al. 1996a,b; Nguyen et al. 1998b, 2001). These pancreatic and gallbladder cells were the kind gift of Dr Sum Lee (University of Washington) and the procedures including animal killing, alleviation of pain, and consent for use of human tissue were originally approved by the Animal Experiment Committee and Human Subject Review Committee at the University of Washington (Oda et al. 1996a,b). All experiments in this report used isolated and unpolarized single PDEC subcultured for 1–3 days on small Vitrogen-coated glass chips in medium conditioned by human gallbladder myofibroblasts (Koh et al. 2000; Jung et al. 2004).
Single-cell Ca2+ photometry
[Ca2+]i was measured using the Ca2+-sensitive fluorescent dye indo-1 AM. Cells were preincubated for 30 min with 2 μm of the dye and Pluronic F-127 (0.01%) in a normal Na+-rich Hepes-buffered solution (see below, Single cell pHi measurements). The dye was excited at 365 nm and fluorescence signals were recorded every second at 405 nm and 500 nm by photon-counting photomultiplier tubes. Background fluorescence from a cell-free region was used for correction. [Ca2+]i was calculated as:
where Kd* is the device-dependent effective dissociation constant of indo-1, R is the ratio of fluorescence at 405 nm to fluorescence at 500 nm, and Rmin and Rmax are the ratios for Ca2+-free and Ca2+-bound dye, respectively (Grynkiewicz et al. 1985). Rmin, Rmax, and Kd* were determined to be 0.33, 3.73 and 2874 nm, respectively (n = 3–6 cells for each value), using cells incubated for > 10 min with Na+-rich saline solutions containing 20 μm ionomycin plus 20 mm EGTA (Rmin) or 15 mm Ca2+ (Rmax), or 20 mm EGTA and 15 mm Ca2+ (Kd*). All solutions used for the calibration contained carbonyl cyanide m-chloro-phenylhydrazone (10 μm), a mitochondrial Ca2+ uniporter blocker, and thapsigargin (5 μm), a sarco(endo)plasmic reticulum Ca2+-ATPase (SERCA) pump blocker, for a fast equilibration of cytoplasmic Ca2+ with the external Ca2+ calibration buffers.
When ionic currents and [Ca2+]i were simultaneously measured, PDEC were preloaded with indo-1 AM for 30 min and then patched with a pipette containing 100 μm indo-1 pentapotassium salt, allowing the recording to start immediately after rupture of the patched membrane. Under these conditions, Rmin, Rmax and Kd* were determined to be 0.36, 3.67 and 2591 nm, respectively (n = 3–5 for each value). For calibrations, the K+-rich internal pipette solution contained 100 μm indo-1 pentapotassium salt plus 50 mm EGTA (Rmin) or 15 mm CaCl2 (Rmax) or 20 mm EGTA plus 15 mm CaCl2 (Kd*).
Single-cell pHi measurement
The Cl−–HCO3− exchange activity was monitored by following intracellular pH (pHi) changes. Cells were preincubated with 2 μm BCECF-AM, the pH-sensitive fluorescent dye, for 20 min at room temperature in Na+-rich Hepes-buffered solution. BCECF was excited at 440 or 495 nm using a filter wheel (Lamda 10-2, Sutter Instrument, Navato, CA, USA), and the emissions at 535 nm were recorded at 1 s interval using a digital cooled CCD camera (Roper Scientific, Tucson, AZ, USA) equipped with the MetaFluor system (Universal Imaging, Downington, PA, USA). Background fluorescence, measured from a cell-free area, was subtracted. The ratio (R, F495/F440) was converted into pHi values using the equation
where Ra and Rb are the ratios at pH 5.0 and 9.0, respectively, and Kd* is the device-dependent effective dissociation constant of BCECF (Boyarsky et al. 1988). Ra, Rb and Kd* were measured using 10 μm nigericin, a K+–H+ exchanger, in solutions containing (mm): 130 KCl, 10 NaCl, 1 MgCl2, at different pH values using MES (pH 5.0), CHES (pH 9.0) and Hepes (pH 7.0) buffers. Ra, Rb and Kd* were 2.88, 13.75 and 87.8 nm, respectively (n = 10–17 cells for each value).
Na+-rich Hepes-buffered solution contained (mm): 137.5 NaCl, 2.5 KCl, 1 MgCl2, 2 CaCl2, 10 glucose, 10 Hepes (pH adjusted to 7.4 with NaOH). Na+-free Hepes-buffered solution contained (mm): 140 NMDG, ∼125 HCl, 2.5 KCl, 1 MgCl2, 2 CaCl2, 10 glucose, 10 Hepes (pH was 7.4 with ∼125 mm HCl). Na+-free and Cl−-free Hepes-buffered solution contained (mm): 140 NMDG, ∼130 methanesulphonic acid, 2.5 K-gluconate, 1 MgSO4, 2 CaSO4, 10 glucose, 10 Hepes (pH was 7.4 with KOH). Ca2+-free (‘0 Ca2+’) Hepes-buffered solution contained (mm): 137.5 NaCl, 2.5 KCl, 1 MgCl2, 0.1 EGTA, 10 glucose, 10 Hepes (pH adjusted to 7.4 with NaOH). Cl−-free Hepes-buffered solution contained (mm): 137.5 Na-gluconate, 2.5 K-gluconate, 1 MgSO4, 2 CaSO4, 10 glucose, 10 Hepes (pH adjusted to 7.4 with NaOH). HCO3−-buffered solution contained (mm): 120 NaCl, 2.5 KCl, 1 MgCl2, 2 CaCl2, 10 glucose, 15 Hepes, 20 NaHCO3 (pH adjusted to 7.4 with NaOH immediately before experiments). As pH was not constantly controlled by bubbling CO2 into the solution, this solution was only used for 3–4 h after preparation. Maximal pH change during this time period was 0.2 pH unit but pH change during each experiment was negligible.
Loading of dopamine and amperometric measurement of exocytosis
Carbon-fibre amperometry (Koh et al. 2000; Jung et al. 2004) was used to detect exocytosis from single cells in real time, as it provides the high resolution necessary to detect molecules released from single secretory vesicles. PDEC were incubated for 50 min at room temperature in a solution containing dopamine (70 mm) to load the exogenous monoamine into acidic secretory vesicles (Koh et al. 2000; Jung et al. 2004). After return to a dopamine-free Hepes-buffered solution, exocytosis was measured through vesicular release of the loaded dopamine. Dopamine oxidation at the tip of a carbon-fibre electrode polarized to +400 mV generated pulses of electric current recorded with an EPC9 patch-clamp amplifier (HEKA Elektronik, Lambrecht, Germany). The current signal was filtered at 0.1 kHz and sampled at 0.5 kHz.
Ruptured whole-cell patch-clamp recording
Whole-cell patch-clamp (Hamill et al. 1981) was performed with an EPC9 or EPC9/2 patch-clamp amplifier. Pipette resistance was 3–5 MΩ and whole-cell membrane capacitance, estimated from on-line compensation values, was 41 ± 21 pF (mean ± s.d., n = 34). The same Na+-rich Hepes-buffered external solution was used for Ca2+ photometry, pH measurement and amperometry. The pipette solution contained (mm): 130 KCl, 10 NaCl, 1 MgCl2, 10 Hepes, 2 Na2ATP, 0.1 K4-BAPTA (pH adjusted to 7.3 with KOH). To identify K+ current in Fig. 8, a K+-rich bath solution was used that contained (mm): 135 KCl, 5 NaCl, 2 CaCl2, 1 MgCl2, 10 glucose, 10 Hepes (pH adjusted to 7.3 with KOH). Whole-cell current recordings were filtered at 1 kHz and acquired at 1 or 3 kHz.
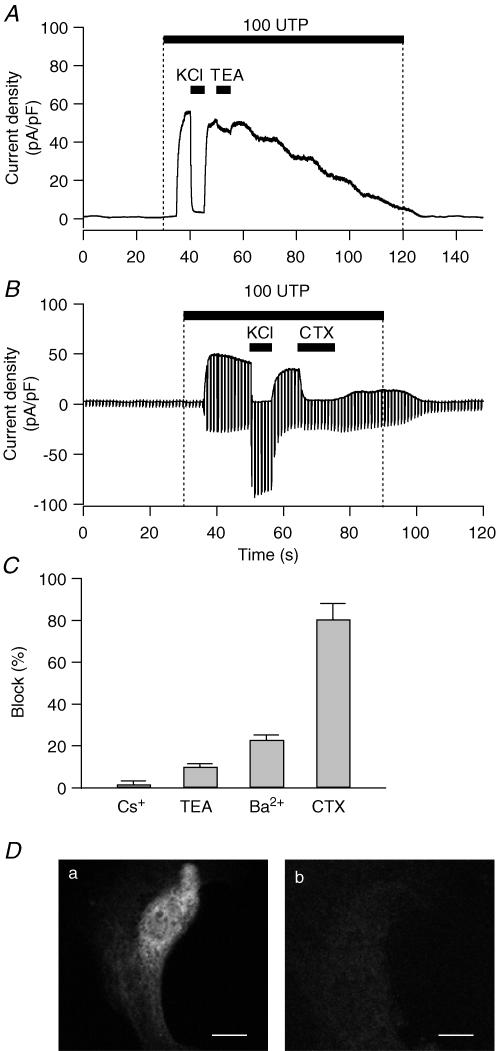
Figure 8. Pharmacology and immunostaining of the KCa channel in PDEC.
Cells were clamped at 0 mV in ruptured whole-cell configuration. A, effect of 10 mm TEA on K+ current activated by 100 μm UTP. To avoid non-specific effects caused by different osmolarity, the same amount of NaCl (10 mm) was added in the other solutions. B, effect of 100 nm CTX on K+ current mediated by 100 μm UTP. Membrane potential was held at 0 mV for 800 ms to measure KCa current and stepped to −80 mV for 200 ms to measure ClCa current every 1 s. C, effect of K+ channel blockers on PDEC KCa channels. Bar graph shows the inhibition observed with Cs+ (1 mm), TEA (10 mm), Ba2+ (5 mm), and CTX (100 nm). D, demonstration of IK1/SK4 channels in PDEC by immunofluorescence. Confocal images of cells treated with both primary and secondary antibody (a) or with secondary antibody alone (b). Scale bars indicate 10 μm.
Perforated-patch whole-cell recording
To avoid change of intracellular Cl− concentration or leakage into the patch pipette of factor(s) crucial to [Ca2+]i increase or K+ channel activation, the perforated patch technique using gramicidin D was employed. This antibiotic, permeable to K+ and Na+, but not Cl−, was prepared fresh every 1–2 h, dissolved in dimethyl sulfoxide and added to the filtered pipette solution to a final concentration of 0.2–0.4 mg ml−1 (Akaike, 1996). To exclude contamination with Cl− currents, cells were clamped at −40 mV, the reversal potential for Cl− current in PDEC determined by current–voltage relationships of UTP-induced ClCa currents when KCa currents are blocked with CTX. The pipette resistance was 2–3 MΩ when filled with a pipette solution containing (mm): 130 KCl, 20 NaCl, 10 Hepes (pH adjusted to 7.3 with KOH). Series resistance and membrane capacitance were estimated from the peak size and the time constant of capacitance current flowing in response to small voltage steps at 0 mV.
Single-channel recording
Single-channel activity was recorded in the excised inside-out patch-clamp configuration (Hamill et al. 1981). The bath and pipette solutions contained (mm): 115 K-gluconate, 5 KCl, 10 Hepes (pH adjusted to 7.3 with KOH). For a desired Ca2+ concentration, the necessary amount of CaCl2 in 5 mm EGTA was calculated using the Cabuffer program (http://iubio.bio.indiana.edu/soft/molbio/ibmpc/). Pipette resistance was 5–15 MΩ. These pipettes were coated externally with Sylgard (Dow Corning Co., Midland, MI, USA). Single-channel recordings were low-pass filtered at 0.5 or 1 kHz and sampled at 10 kHz.
All experiments in this report were performed at room temperature (22–24°C) and test solutions were applied using a local perfusion system that allowed a complete solution exchange within 0.5 s (Koh & Hille, 1997).
Detection of IK1/SK4 channels by immunofluorescence
Cells grown on Vitrogen-coated chips were fixed for 30 min with 3.7% formaldehyde in phosphate buffered saline (PBS) and permeabilized in 0.3% Triton X-100 in PBS for 10 min. These cells were next incubated in 2% bovine serum albumin (BSA) in PBS for 1 day to reduce non-specific binding and then labelled with rabbit antibodies against the IK1/SK4 channels (1: 25 dilution in 2% BSA) for 1 h followed by FITC-conjugated goat antirabbit IgG (H + l) 1: 50 dilution in 2% BSA for 30 min. Each step described above was followed by two washes with PBS. The samples mounted on slide glass were observed with a 100× oil/N.A. 1.4 lens in a confocal fluorescence microscope (Leica SP1). The FITC dye was excited with 488 nm argon laser and the fluorescence was observed in range of 500–600 nm.
Data analysis
Amperometric records were semiautomatically analysed using software written in Igor Pro (Wave Metrics, Lake Oswego, OR, USA). To adjust for cell-to-cell variation of background and stimulated exocytosis, the rate of exocytosis for each experiment was normalized to the baseline value prior to averaging and then the values were averaged (‘Normalized rate of exocytosis’). Relative exocytosis was calculated as the mean normalized rate of exocytosis during treatment. [Ca2+]i and pHi data were also analysed with Igor.
Single-channel recordings of Ca2+-activated K+ channels were analysed with TAC X4.1.3 (Bruxton, Seattle, WA, USA). Single-channel conductance was determined as the difference between mean amplitudes of closed and open states. The open probability (Popen) was calculated as Popen = Imean/Ni, where Imean is the mean current, N is the number of channels in each excised inside-out patch and i is the single channel current amplitude. Normalized Popen was defined as Popen divided by the response observed in saturating 10 μm Ca2+ (Popen = 0.38 ± 0.08, n = 7) in each experiment. The recording time for Popen measurement at different Ca2+ concentrations was 90 s except in Fig. 6A. Ca2+ sensitivity of K+ channels was estimated using the following equation:
where K1/2 and r are the half-maximal Ca2+ concentration and Hill coefficient, respectively. Percentage of block in Fig. 8 is the ratio of the current size during the application of drugs to the larger control value. Control value is the difference between current level after application of high K+ solution (denoted as KCl) and current level before application of the drug. All numerical values are given as the mean ± s.e.m. unless otherwise noted. Statistical significance was determined by Student's t test and P < 0.05 was considered significant.
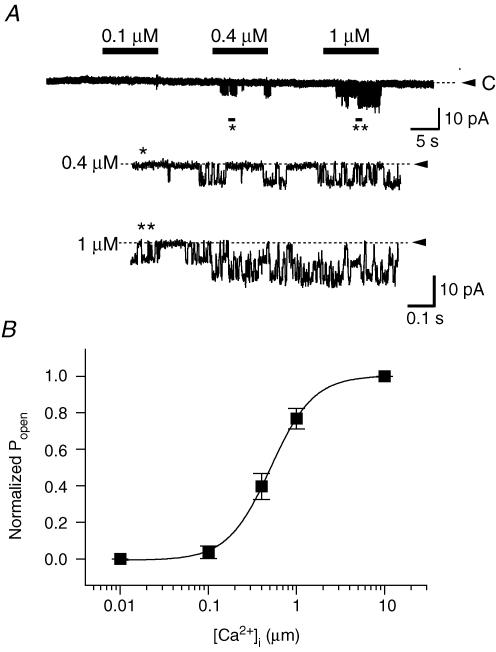
Figure 6. Single-channel recordings of Ca2+-activated K+ channels in PDEC.
A, channel activity recorded at different intracellular (bath) Ca2+ concentrations in an excised inside-out patch. Bars indicate application of Ca2+ in the bath solution. Between tests, the bath solution contained 5 mm EGTA without Ca2+. Patches were held at −100 mV with 120 mm K+ on both sides. Bottom panels represent expanded traces of the regions marked by asterisks. Dashed line and arrowhead denote the closed state of the channels. B, dose–response relation. Normalized Popen is plotted as a function of the Ca2+ concentration (2–7 patches for each point). The curve was obtained by fitting the data points with the Hill equation (see Data analysis).
Results
UTP was used to activate electrolyte secretion and exocytosis in most of this work because it stimulates mainly a [Ca2+]i increase via the P2Y2 receptor on PDEC (Nguyen et al. 1998b). This contrasts with ATP, which increases both [Ca2+]i and cAMP via P2Y2 and P2Y11 receptors (Nguyen et al. 2001).
Patterns of [Ca2+]i dynamics and Ca2+-induced exocytosis
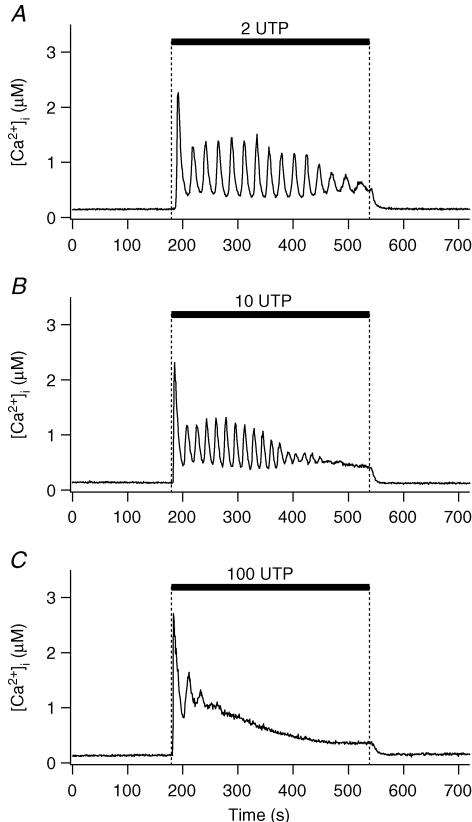
The effect of different UTP concentrations in modulating [Ca2+]i was first examined (Fig. 1). At a low concentration of 2 μm, UTP induced [Ca2+]i oscillations in 14 out of 15 cells. Period, duration and number of peaks were 19 ± 0.7 s, 234 ± 24 s, and 12 ± 2, respectively (n = 14 cells, Table 1). With 10 μm UTP, half of the cells tested exhibited prolonged [Ca2+]i oscillations, while the remaining cells exhibited a sustained [Ca2+]i increase after a few oscillations. As summarized in Table 1, the characteristics of the [Ca2+]i oscillation induced by 10 and 2 μm UTP were similar, except for a slightly shorter duration of the oscillatory phase at 10 μm. Low concentrations of ATP also evoked similar [Ca2+]i oscillations (Table 1). In contrast, 100 μm UTP induced a brief burst of [Ca2+]i oscillations followed by a sustained, but slowly decreasing, plateau (Fig. 1C). Amplitudes of the first [Ca2+]i peak were 2.0 ± 0.18 (n = 15), 2.7 ± 0.18 (n = 15) and 2.9 ± 0.21 μm (n = 8) for 2, 10 and 100 μm UTP, respectively.
Figure 1. UTP-stimulated [Ca2+]i increase.
Time course of [Ca2+]i measured photometrically as UTP is applied to a cell for 6 min, as indicated by black bars. Representative recordings at 2 (A), 10 (B), and 100 μm (C).
Table 1.
Parameters of [Ca2+]i or K+ current oscillation in PDEC
| Duration (s) | Number of peaks | Period (s) | Percentage of oscillatory cells | |
|---|---|---|---|---|
| Ca2+ oscillation in intact cells | ||||
| 2 μm UTP | 234 ± 24 | 12 ± 2 | 19 ± 0.7 * | 93 (14/15) |
| 10 μm UTP | 181 ± 31 | 11 ± 2 | 17 ± 0.9 | 50 (6/12) |
| 2 μm ATP | 196 ± 33 | 11 ± 2 | 17 ± 0.7 * | 100 (5/5) |
| 10 μm ATP | 177 ± 29 | 12 ± 2 | 15 ± 0.4 | 57 (4/7) |
| Current oscillation in perforated whole-cell configuration | ||||
| 2 μm UTP | 413 ± 30 | 17 ± 4 | 28 ± 7.5 | 67 (4/6) |
| 10 μm UTP | 470 ± 55 | 21 ± 3 | 24 ± 4.0 | 100 (4/4) |
| Current oscillation in ruptured whole-cell configuration | ||||
| 2 μm UTP | 209 ± 35 | 9 ± 2 | 23 ± 1.0 * | 88 (14/16) |
| 10 μm UTP | 161 ± 24 | 9 ± 1 | 18 ± 1.3 | 42 (5/12) |
Duration and number of peaks were defined as total time lapsed and the total number of peaks between the first and the final peaks. Period was calculated by dividing the duration by the number of peaks in each experiment. Only cells showing oscillations were included in the analysis.
Asterisks (P < 0.05) indicate that parameters at 2 μm UTP or ATP in same condition are significantly different compared with the values at 10 μm. Data are means ± s.e.m.
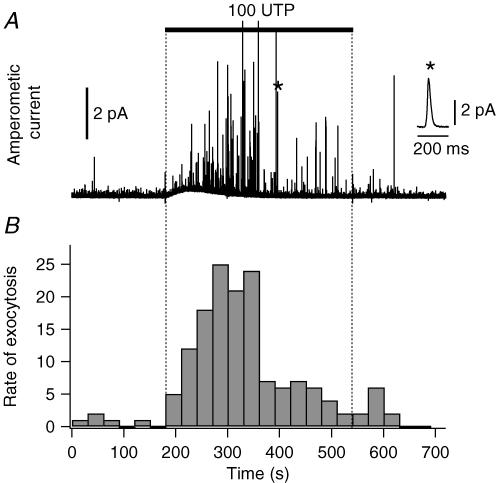
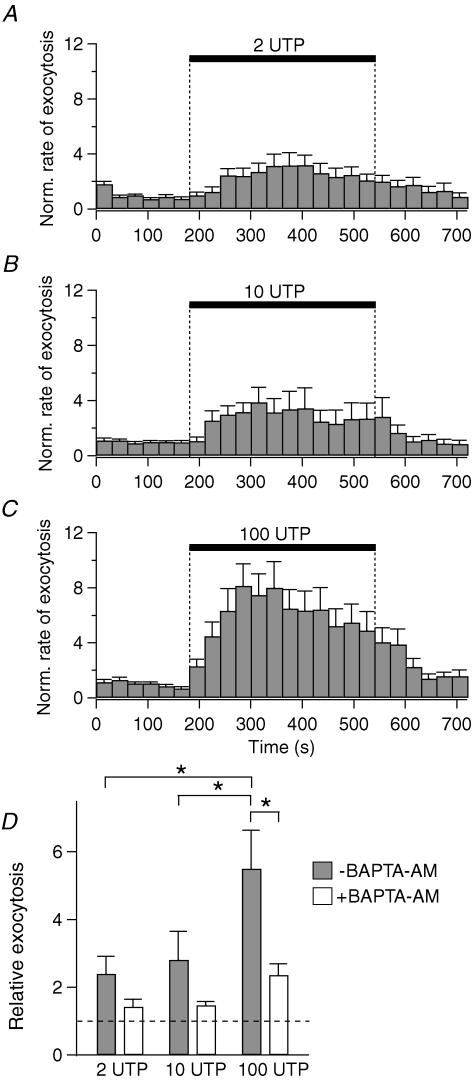
The effect of UTP on exocytosis was evaluated by carbon-fibre amperometry, using PDEC preloaded with exogenous dopamine (Koh et al. 2000; Jung et al. 2004). In this system an amperometric spike represents the oxidation current detected when dopamine is released from one secretory vesicle, i.e. a single exocytotic event (inset, Fig. 2A). When PDEC were treated with 100 μm UTP, the amperometric spike frequency showed a marked increase (Fig. 2A). Exocytosis rate peaked within 2 min and then decreased over the next 4 min (Fig. 2B). Relative exocytosis, defined as a ratio of mean rate of exocytosis during 6 min of UTP treatment compared to the 3 min control, was 14, indicating that the rate of exocytosis increased 14-fold in this specific experiment. Figure 3 summarizes the average response of several cells. Relative exocytosis evoked by 100 μm UTP was, on average, 5.5 ± 1.1 (n = 22). The values (2.4 ± 0.5 (n = 13) and 2.8 ± 0.8 (n = 15) for 2 and 10 μm UTP, respectively) were significantly lower. As indicated in Fig. 3D, the increase of exocytosis with 2 and 10 μm UTP was 31 ± 11% and 40 ± 19% of that stimulated by 100 μm UTP. To study the contribution of [Ca2+]i to exocytosis, we preincubated cells with 20 μM BAPTA-AM, a membrane-permeant Ca2+ chelator, for 1 h at 37°C. The subsequent [Ca2+]i increase induced by UTP was completely blocked (n = 6), and relative exocytosis was reduced to 1.4 ± 0.2 (n = 7), 1.5 ± 0.1 (n = 7) and 2.4 ± 0.3 (n = 10) for 2, 10 and 100 μm UTP, respectively (Fig. 3D). When only the component of Ca2+-dependent exocytosis (i.e. portion inhibited by BAPTA) was considered, 2 and 10 μm UTP stimulated, respectively, 29% and 36% of the exocytosis induced by 100 μm UTP (Fig. 3D). Combined with the data shown in Fig. 1, these results indicate that [Ca2+]i oscillations are less efficient than sustained [Ca2+]i increase in stimulating exocytosis.
Figure 2. UTP-stimulated exocytosis.
Time course of release of dopamine, measured amperometrically. A, an amperometric recording obtained in control condition for 3 min, to measure baseline exocytosis, and with 100 μm UTP for the next 6 min. Inset: a single exocytotic event, marked with the asterisk, is displayed on an expanded time scale. B, rate of exocytosis for the same recording as the number of events per 30 s time bin.
Figure 3. Concentration dependence of UTP-induced exocytosis.
A–C, normalized (Norm.) rate of exocytosis evoked by 2 (n = 13), 10 (n = 15) and 100 μm UTP (n = 22). Error bars are shown only in the upward direction. D, summary of relative exocytosis evoked in different conditions. White and grey bars indicate 20 μm BAPTA-AM treated and untreated groups, respectively. *P < 0.05, significantly different compared to 100 μm UTP response without BAPTA loading. The broken line in D denotes the value of the control without UTP.
K+ current activated by [Ca2+]i oscillation
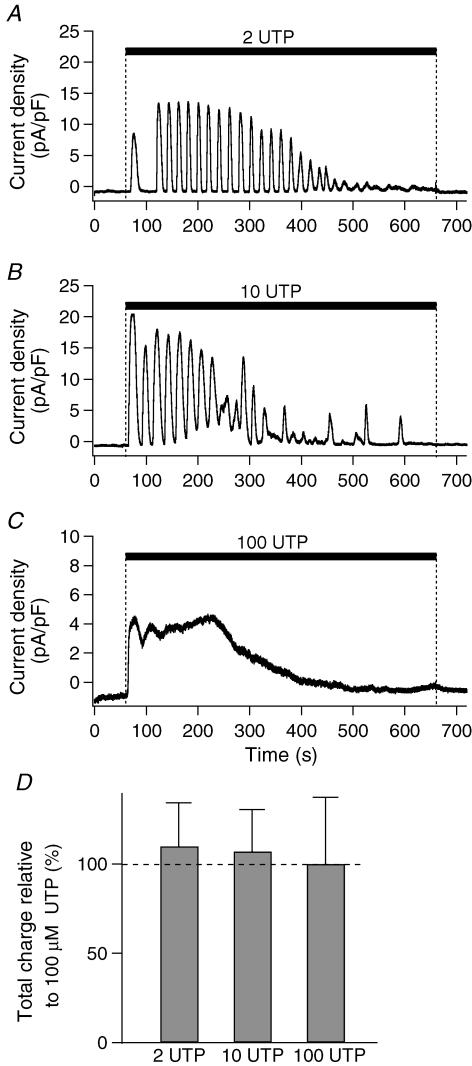
We next determined whether [Ca2+]i oscillations can modulate other Ca2+-dependent cellular functions observed in PDEC, such as Ca2+-activated K+ channels (KCa channels). K+ currents were measured in the perforated whole-cell configuration using gramicidin D. As illustrated in Fig. 4A and B, 2 or 10 μm UTP induced a strong oscillating outward K+ current in the majority of cells (Table 1). With 100 μm UTP (Fig. 4C), the K+ current exhibited an early transient rise followed by a sustained plateau, similar to the [Ca2+]i increase (Fig. 1C). At 2 and 10 μm UTP, the total charge of K+ current was 110 ± 24% (n = 6) and 107 ± 24% (n = 4), respectively, compared to the value achieved with 100 μm UTP (100 ± 38%, n = 6, Fig. 4D). Thus K+ channels, in contrast to exocytosis, were efficiently activated by [Ca2+]i oscillations.
Figure 4. UTP-induced K+ currents.
A–C, K+ currents evoked by different concentrations of UTP were measured in perforated whole-cell configuration using gramicidin D and presented as current density (current/membrane capacitance of each cell). Holding potential was −40 mV. D, summary of total charge relative to 100 μm UTP. Total channel activity induced by UTP was estimated by integrating whole-cell currents for 10 min (‘total charge’). The dashed line in D denotes the value of the 100 μm UTP.
Activation of the oscillatory K+ current by UTP was also observed in the ruptured whole-cell configuration, even when the cells were clamped at 0 mV to remove the driving force for Cl−. When compared to the K+ current in perforated-patch configuration (Table 1), the duration of the current oscillation was reduced, possibly reflecting dialysis of some component(s) required for [Ca2+]i oscillations or the different holding potential. The total charge of K+ current at 2 and 10 μm UTP was, respectively, 114 ± 18% (n = 16, P = 0.6) and 191 ± 37% (n = 12, P = 0.04) of the value observed with 100 μm UTP (100 ± 12%, n = 5).
UTP-stimulated activation of K+ channel mediated by [Ca2+]i increase
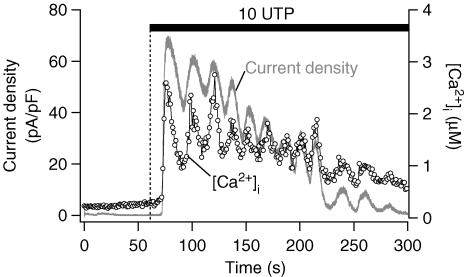
To test whether this current was directly activated by Ca2+, the K+ current and [Ca2+]i were monitored simultaneously in cells clamped at 0 mV in the ruptured whole-cell configuration (Fig. 5). The K+ current activated by 10 μm UTP was synchronous with the [Ca2+]i oscillations, suggesting that it was mediated by KCa channels (n = 3). Similar synchronous oscillations in [Ca2+]i and K+ current were observed with 2 μm UTP (n = 4, data not shown). The [Ca2+]i increase and KCa current stimulated by 100 μm UTP were again similar; they were not sustained but decayed slowly towards base line. From these dual recordings, the Ca2+ sensitivity of the KCa, measured as the half-maximal activation, was 1.0 ± 0.2 μm (n = 3).
Figure 5. Synchrony of [Ca2+]i and K+ current.
Simultaneous measurements of [Ca2+]i (○) and whole-cell current (grey line) induced by 10 μm UTP were obtained in a cell clamped at 0 mV in ruptured whole-cell configuration.
Characterization of KCa channels in PDEC
Activation of KCa channels by Ca2+ was directly demonstrated with inside-out membrane patches (Fig. 6A). The channel activity was stimulated by [Ca2+]i in a dose-dependent manner, with a half-maximal activity (K1/2) at 0.5 μm and a Hill coefficient of 1.8 (Fig. 6B).
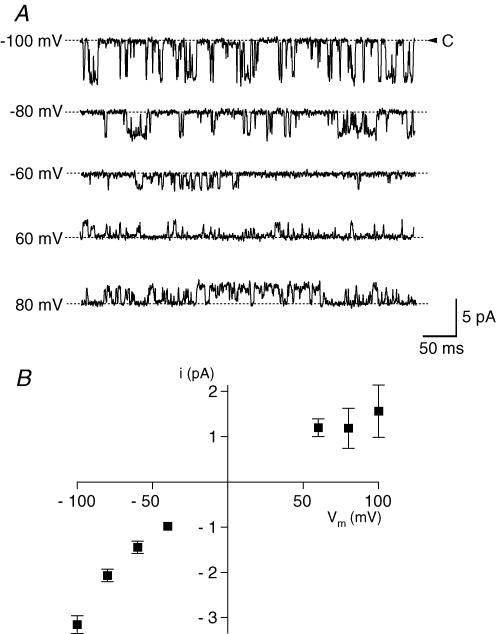
Figure 7A shows single-channel currents at different membrane potentials observed with 0.4 μm Ca2+ applied to the intracellular side and symmetrical 120 mm K+ solutions. The channels opened in bursts and fluctuated among the fully open and closed states and intermediate substates. Between these bursts, the channel sometimes entered a prolonged inactive state that lasted for up to 30 s. The single-channel current–voltage (i–V) relationship illustrates small inward rectification (Fig. 7B). Linear regression analysis of the i–V curve between −60 and −100 mV yielded a single-channel slope conductance of 48 ± 4.4 pS (n = 6). The chord conductance was 32 ± 1.9 pS (n = 9) at −100 mV and 16 ± 5.8 pS (n = 3) at 100 mV. Both the Ca2+ sensitivity and single-channel conductance indicate that the KCa channel on PDEC is an intermediate-conductance KCa (IK) channel. No additional types of KCa channels, e.g. BK type, were observed in our single-channel recordings. The IK channels slowly inactivated within about 10 min during recordings, possibly reflecting the loss of necessary intracellular factors (e.g. cAMP-dependent protein kinase or CAMKII) after the membrane patch is excised from the cell (Huang et al. 1998; Lu et al. 2002).
Figure 7. Single-channel current-voltage (i-V) relation of KCa channel in PDEC.
A, single-channel current recordings at different membrane potentials in an inside-out patch. Intracellular (bath) Ca2+ concentration was clamped at 0.4 μm. B, single-channel current-voltage relationship. Each point is the average from 2 to 9 patches.
The epithelial KCa channels were characterized pharmacologically using ruptured whole-cell recording and known inhibitors of K+ channels. As expected, the UTP-induced K+ current at 0 mV was eliminated in symmetrical K+ (135 mm) solutions (Fig. 8A and B). Extracellular tetraethylammonium (TEA, 10 mm), an effective inhibitor of BK-type KCa channels, reduced this current by only 10 ± 1.4% (n = 7, Fig. 8A and C). In Fig. 8B both UTP-stimulated KCa and Ca2+-activated Cl− (ClCa) current were measured using an alternating voltage protocol. K+-rich solution abolished the KCa current at 0 mV but increased the inward current at −80 mV mediated by both Cl− and K+ channels. Charybdotoxin (CTX, 100 nm), a strong inhibitor of both intermediate- and large-conductance KCa channels, effectively inhibited the UTP-stimulated K+ current but not Cl− current. As summarized in Fig. 8C, the UTP-activated K+ current was resistant to 1 mm Cs+ (inhibition of 2 ± 2%, n = 3), minimally inhibited by 10 mm TEA (10 ± 1.4%, n = 7), moderately inhibited by 5 mm Ba2+ (23 ± 2.3%, n = 3), and very sensitive to CTX (81 ± 7.6% at 100 nm, n = 6 and 89 ± 4.9% at 1 μm, n = 4). With 1 μm clotrimazole, a specific blocker of intermediate-conductance KCa channels, the K+ current was reduced by 50 ± 1.3% (P = 0.03), whereas the [Ca2+]i rise decreased by only 9 ± 3% (n = 4, data not shown) in simultaneous current and [Ca2+]i recordings. Prompted by this pharmacological profile, we further investigated whether the KCa channels expressed in PDEC are of the IK1/SK4-type. As observed through immunofluorescence, in all observed cells, the channels are expressed on the plasma membrane and seem to be localized to intracellular endoplasmic reticulum and Golgi complexes as well (Fig. 8D), similar to findings obtained with hIK1 expressed in HEK293 cells (Jones et al. 2005). In conclusion, electrophysiological, pharmacological, and immunohistochemical evidence indicates that UTP activates IK-type KCa channels in PDEC.
Role of IK channels and [Ca2+]i rise on secretion of HCO3−
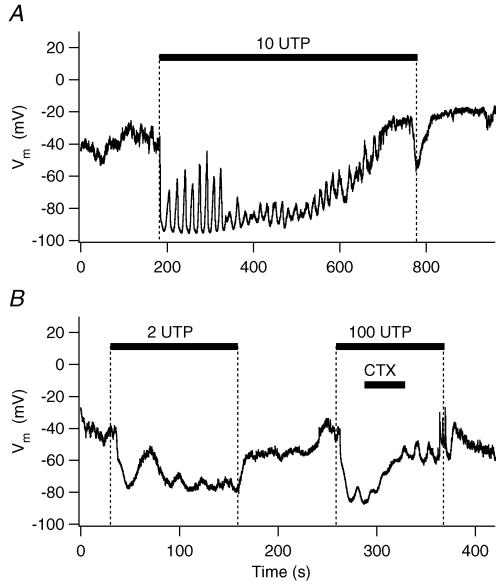
For secretory epithelia, the dominant hypothesis for regulation of HCO3− secretion is as follows. Opening of K+ channels mediates K+ efflux across the basolateral membrane and hyperpolarizes the plasma membrane thus increasing the electrical driving force for Cl− efflux (Argent & Case, 1994; Mall et al. 2003). The resulting depletion of intracellular Cl− enhances Cl−–HCO3− exchange activity, augmenting HCO3− secretion (Novak & Greger, 1988). We now test several predictions of this hypothesis. First we ask whether activation of IK channels by [Ca2+]i oscillations hyperpolarizes the membrane in perforated whole-cells (Fig. 9). Indeed, application of 10 μm UTP evoked an immediate hyperpolarization of the membrane potential, from a resting potential of −44 ± 3 mV (n = 15) to about − 90 mV with some oscillatory fluctuations (Fig. 9A). As shown in Fig. 9B, both low (2 μm) and high (100 μm) concentrations of UTP induced a hyperpolarization sensitive to CTX (n = 3).
Figure 9. Hyperpolarization of membrane potential induced by KCa current in perforated whole-cell configuration.
A, hyperpolarization induced by 10 μm UTP. This trace is representative of two similar experiments. B, inhibition of UTP-evoked hyperpolarization by 100 nm CTX.
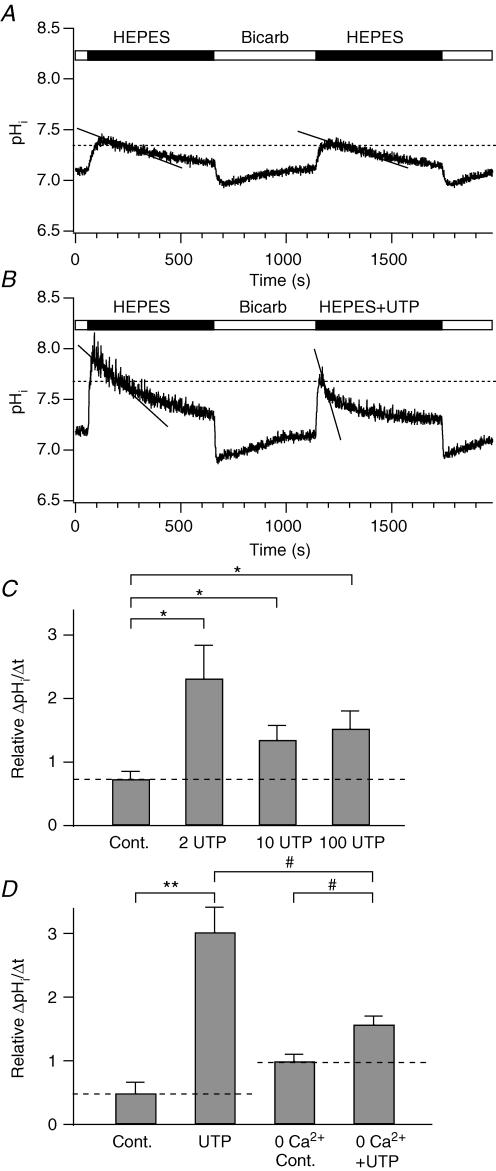
Second we determine the effect of IK channel activation on HCO3− secretion through the Cl−–HCO3− exchanger by monitoring rates of change in pHi (Figs 10 and 11, Muallem & Loessberg, 1990). PDEC respond to shifts from a HCO3−-buffered to a Hepes-buffered solution with abrupt pHi increases, due to rapid efflux of CO2 from the cell, followed by a slow return to the baseline, due to HCO3− efflux. The rate of HCO3− exchange will be proportional to the rate of change of pHi. Because this rate of change of pHi is determined by the buffer capacity of cytoplasm and the buffer capacity is quite pHi sensitive, internal comparisons need to be made at the same pHi (Boyarsky et al. 1988; Muallem & Loessberg, 1990). Therefore we used two Hepes challenges, the first under a stereotyped condition and the second as a test condition, and then compared the rate of pHi change at the same pHi for both of them (Fig. 10A). The measurement pHi was arbitrarily set at 95% of the peak pHi change occurring in whichever record had the lower peak. The rate of pHi recovery was taken as the slope of a fitted exponential curve at this 95% point. In control conditions with identical Hepes challenges, the rate of pHi recovery was, on average, 1.4 ± 0.3 × 10⁻³ (pH units) s−1 and 0.84 ± 0.14 × 10⁻³ (pH units) s−1 for the first and second Hepes challenges, respectively (n = 5, Fig. 10A). We defined the relative rate of pHi recovery as a ratio of the second to the first Hepes challenges, being 0.7 ± 0.2 (n = 5, Fig. 10C) in these control cells. When 100 μm UTP was used in the second challenge to activate IK channels, the relative rate of pHi recovery was 1.5 ± 0.3 (n = 8, P < 0.05, Fig. 10B and C), indicating an increased Cl−–HCO3− exchange activity with UTP. Lower concentrations of UTP had a similar effect and there was no statistical difference between relative rates of pHi recovery produced by 2 μm (2.3 ± 0.5, n = 6), 10 μm (1.3 ± 0.2, n = 13), and 100 μm UTP (Fig. 10C). Hence, low concentrations of UTP effectively evoke HCO3− secretion. Next we assessed whether the UTP effect on HCO3− secretion requires the [Ca2+]i increase and KCa channels. Cells were preincubated with the SERCA pump inhibitor thapsigargin (1 μm, 10 min) in a Ca2+-free Hepes-buffered solution (‘0 Ca2+’) to deplete intracellular Ca2+ stores. Under these conditions, 100 μm UTP no longer induced an increase in [Ca2+]i (data not shown), and the relative rate of pHi recovery was considerably smaller (‘UTP + 0 Ca2+’, 1.6 ± 0.1, n = 6, Fig. 10D) than that without Ca2+ depletion (‘UTP’, 3.0 ± 0.4, n = 5). Thus, HCO3− secretion during UTP treatment is primarily Ca2+ dependent. Nevertheless, UTP still increased the relative rate a little in Ca2+-depleted cells (‘UTP + 0 Ca2+’ versus ‘0 Ca2+’, 1.0 ± 0.1, n = 5), suggesting that some fraction of the HCO3− secretion does not require Ca2+ elevation but can be increased by UTP stimulation.
Figure 10. Increase of HCO3− secretion by UTP in Ca2+-dependent manner.
Intracellular pH (pHi) was measured with BCECF and HCO3− efflux was assessed by pHi recovery during Hepes challenges. A, two successive measurements of HCO3− efflux using the Na+-rich Hepes-buffered solution (‘HEPES’). ‘Bicarb’ indicates HCO3−-buffered solution. To estimate HCO3− efflux, we fitted a single exponential function to the time course of pHi recovery and we measured its slope, the rate of pHi recovery (continuous line), at 95% of the peak value (horizontal dashed line) of the Hepes-induced peak pHi change (see text). B, increased rate of pHi recovery by 100 μm UTP in the second Hepes challenge (‘Hepes + UTP’). C, summary of relative rate of pHi recovery of the second Hepes challenge compared to the first one at different concentrations (0, 2, 10, 100 μm) of UTP. D, summary of relative rate of pHi recovery in thapsigargin-treated (‘0 Ca2+ Cont.’ and ‘UTP + 0 Ca2+’) or -untreated cells (‘Control’ and ‘UTP’), where UTP is 100 μm. In this batch of cells 100 μm UTP evoked slightly larger increase of the recovery rate compared to the cells shown in C. The relative recovery rates are 0.5 ± 0.2 (n = 6) for control and 3.0 ± 0.4 (n = 5) for UTP. Some cells were pretreated with 1 μm thapsigargin for 10 min in the Ca2+-free (‘0 Ca2+’) solution to eliminate any Ca2+ rise induced by 100 μm UTP. Bath solutions for the measurements did not containing thapsigargin. The recovery rates in C and D were statistically compared to either control (*P < 0.05; **P < 0.005) or UTP-treated cells (#P < 0.05). The dashed lines in C and D denote the value of the control.
Figure 11. Involvement of IK channels and Cl−/HCO3− exchangers in HCO3− secretion.
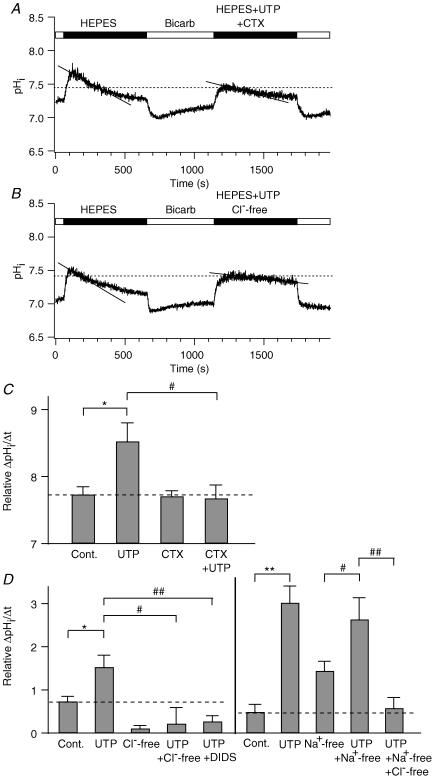
A and B, effect of 200 nm CTX (‘Hepes + UTP + CTX’, A) or the removal of extracellular Cl− (‘Hepes + UTP + Cl−-free’, B) on the time course of pHi recovery. C, summary of relative rates of pHi recovery in the presence or absence of CTX. The values for control and 100 μm UTP alone are the same as those in Fig. 10C. D, summary of relative rate of pHi recovery in Cl−-free, 100 μm DIDS, and Na+-free conditions. Left panel, in the DIDS experiments, the drug was applied to the bath 1 min after treatment with 100 μm UTP to reduce the effect of inhibition of DIDS-sensitive ClCa channels and Na+–HCO3− cotransporters. The values for control and UTP were obtained from Fig. 10C. Right panel, the values for control and UTP are same as those in Fig. 10D. The values were significantly different when compared to control (*P < 0.05; **P < 0.005) or 100 μm UTP (#P < 0.05; ##P < 0.005). In all figures, UTP concentration was 100 μm. Dashed lines in C and D denote relative rates of pHi recovery of the control cells.
A need for KCa channels was shown by using the channel blocker CTX. The pHi recovery was not influenced by the CTX alone (0.7 ± 0.1, n = 10, Fig. 11C) compared to control cells (0.7 ± 0.2), but the enhancement by UTP (100 μm) was lost (0.7 ± 0.2, n = 5, Fig. 11A and C).
Finally, we asked if the rate of pHi change had the properties expected for a Cl−–HCO3− exchanger. Removal of extracellular Cl− (0.2 ± 0.4, n = 6, Fig. 11B and D, left panel) or addition of 100 μm DIDS, a blocker of the Cl−–HCO3− exchanger (0.3 ± 0.1, n = 4, Fig. 11D, left panel), inhibited UTP enhancement of pHi recovery, consistent with a Cl−-dependent and DIDS-sensitive HCO3− transport mechanism. Basal secretion of HCO3− (pHi recovery) was also strongly depressed in the absence of Cl− (0.1 ± 0.1, n = 5, P < 0.005, Fig. 11D, left panel). The HCO3− transport did not seem to require a Na+ gradient (Fig. 11D, right panel). In a Na+-free Hepes-buffered solution, the pHi recovery induced by 100 μm UTP (2.6 ± 0.5, n = 16) was not significantly different from that in Na+-rich solution (3.0 ± 0.4, n = 5, P = 0.6), but was considerably different from that in Cl−-free and Na+-free solution (0.6 ± 0.2, n = 12), suggesting that mainly Na+-independent and Cl−-dependent HCO3− exchangers are involved. These experiments with Na+-free solutions might be complicated by reversal of transport through the Na+–H+ exchanger or the Na+–HCO3− cotransporter in a Na+-free solution, which would also produce pHi changes. Indeed, Na+-free solution by itself speeded up the pHi recovery (1.4 ± 0.2 (n = 16) versus 0.5 ± 0.2 (control, n = 6), Fig. 11D, right panel), which could be produced by import of protons by the Na+–H+ exchanger and export of HCO3− by the Na+–HCO3− cotransporter. These Na+-dependent transport mechanisms still contribute to pHi recovery in Na+-free and Cl−-free solution with UTP (0.6 ± 0.2) even when Cl−–HCO3− exchange is strongly blocked without external Cl−.
Taken together, these results show that Na+-independent, Cl−-dependent and DIDS-sensitive Cl−–HCO3− exchange activity is stimulated by both oscillatory and sustained activation of Ca2+-dependent IK channels in response to UTP.
Discussion
Encoding and decoding of [Ca2+]i signals in epithelia
We find here that exocytosis is efficiently stimulated by a sustained [Ca2+]i increase evoked by high UTP concentrations, but only a third as well (31%) by [Ca2+]i oscillations evoked by low UTP concentrations. This parallels similar findings we made with ATP (Jung et al. 2004); however, there, 2 μm ATP stimulated only ∼2% of the exocytosis obtained with 100 μm ATP. The greater potency of low UTP compared to ATP might relate to the BAPTA-resistant component of exocytosis in 2 μm UTP (Fig. 3D). A BAPTA-resistant component of ATP-evoked exocytosis (via P2Y11 receptors) is evident only above 10 μm (Nguyen et al. 2001; Jung et al. 2004).
The physiological ATP profile in the lumen of the pancreatic duct is not known. It could be as high as the 9 μm concentration observed in the vicinity of acini during secretion of pancreatic enzymes (Sørensen & Novak, 2001), or lower on account of dilution and degradation by extracellular ectoenzymes (Lazarowski et al. 1997; Schwiebert, 2001), and probably much lower during inactive periods of food intake. Therefore, the low concentrations of ATP or UTP that induce [Ca2+]i oscillations in PDEC would be the most physiologically relevant. We have demonstrated that these oscillations induce activation of KCa channels, hyperpolarize the membrane, and enhance Na+-independent, Cl−-dependent and DIDS-sensitive HCO3− transport. Therefore, electrolyte (e.g. K+ and HCO3−) secretion, a major function for PDEC, can be modulated by such mild purinergic input, whereas the exocytotic machinery responds only slowly and weakly to [Ca2+]i oscillations (Fig. 3). The slowness of the exocytotic response may reflect the absence of a pool of docked or primed vesicles near the plasma membrane in PDEC (Oda et al. 1996b). Indeed, following a sharp [Ca2+]i increase, exocytosis still occurs only after a ∼30 s delay (Figs 1 and 3). As the individual Ca2+ spikes within [Ca2+]i oscillations last only for < 10 s, they are too short to activate complete vesicle translocation and fusion with the plasma membrane (Kasai, 1999).
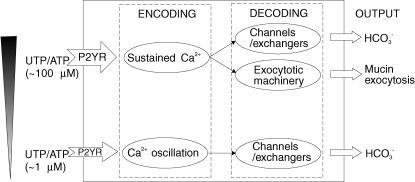
As summarized in Fig. 12, we have established in PDEC that different concentrations of ATP or UTP induce distinct patterns of [Ca2+]i responses (‘encoding’); these patterns, in turn, differentially modulate several cellular functions such as IK conduction, HCO3− secretion, and exocytosis (‘decoding’). These differential responses will be particularly relevant to the emerging autocrine and paracrine function of ATP (Schwiebert, 2001), as the concentration of ATP will be highly variable, due to release, diffusion, dilution and local metabolism. Whether other receptors coupled to Gq and phospholipase C (e.g. histamine H1, proteinase activated (PAR-2), muscarinic, and cholecystokinin receptors) alone or in combination in PDEC elicit similar responses should be paramount areas for further investigation (Nguyen et al. 1998a,b, 2001).
Figure 12. Ca2+ signalling in PDEC.
Agonist (UTP or ATP) concentration is ‘encoded’ as Ca2+ oscillation, sustained Ca2+ rise, or both via P2Y receptors in PDEC. The oscillatory signal is ‘decoded’ by a parallel activation of Ca2+-dependent K+ or Cl− channels, whereas the sustained Ca2+ signal is decoded by both the Ca2+-activated channels and the exocytotic machinery. Finally, the Ca2+-activated channels modulate the Cl−-dependent HCO3− secretion while the Ca2+-activated exocytotic machinery promotes the exocytosis of secretory vesicles. For clarity, this diagram does not include additional modulatory effects of cAMP signals generated by P2Y receptors on exocytosis and channels that were demonstrated in our previous studies (Nguyen et al. 2001; Jung et al. 2004).
The K+ channel activated by oscillatory [Ca2+]i rise in PDEC
In non-excitable cells, KCa channels of the IK type are involved in different functions, including ion transport (Devor et al. 1996; Koegel & Alzheimer, 2001), volume regulation (Khanna et al. 1999) and cell growth (Jensen et al. 1999; Peña & Rane, 1999). The PDEC KCa demonstrated in this report likely corresponds to the IK-type channel previously characterized in these cells by Ussing chamber and radioisotope efflux studies (Nguyen et al. 1998a). The dog pancreatic ductal IK channels are expressed on the basolateral membrane of polarized epithelial cells (Nguyen et al. 1998a). The molecular correlate of the dog PDEC IK channel is not yet defined. A Ca2+-activated K+ channel recently cloned from human pancreas using sequence homology corresponded to the channel named hIK1 by Ishii et al. (1997) or hSK4 by Joiner et al. (1997). When expressed in Xenopus oocytes, the hIK1 channel was activated by submicromolar [Ca2+]i (K1/2 = 0.3 μm, Hill coefficient of 1.7) in the presence of protein kinase A (Gerlach et al. 2000). Interestingly, we regularly observed slow run-down of PDEC IK channels after the excision of the patch membrane from the cell. Therefore, these channels may also require additional cytoplasmic factors, such as kinases, to maintain their activity. The dog PDEC IK channels exhibit the low sensitivity to TEA and high sensitivity to charybdotoxin seen in human IK1/SK4 channels (Ishii et al. 1997; Joiner et al. 1997).
Enhancement of HCO3− secretion by IK channel in epithelia
How does hyperpolarization induced by IK channel activation promote HCO3− secretion? Three models are commonly discussed. According to the conventional model postulated by Novak & Greger (1988), the Cl−–HCO3− exchanger on the apical membrane is the major pathway for HCO3− secretion in PDEC. The Cl− ions that accumulate intracellularly in exchange for HCO3− are recycled extracellularly through apical Cl− channels (mainly the cystic fibrosis transmembrane conductance regulator (CFTR) and Ca2+-activated Cl− channels) and activation of K+ channels creates a driving force that aids Cl− efflux via Cl− channels. Alternatively, HCO3− transport may use electrogenic Cl−–HCO3− exchangers that are directly accelerated by membrane hyperpolarization. In fact, at least two electrogenic exchangers (SLC26A3 and SLC26A6) are expressed in pancreatic duct cells (Lohi et al. 2000; Ko et al. 2004; Steward et al. 2005). The activity of one of these isoforms, SLC26A6, with a Cl−: HCO3− stoichiometry of 1: 2, would be increased by hyperpolarization. Recently a third model has been proposed, particularly to explain the high concentration of HCO3− (∼140 mm) in the pancreatic juice of certain species such as guinea pig, cat, dog and human (Sohma et al. 2000; Whitcomb & Ermentrout, 2004). It argues that Cl−–HCO3− exchangers could not play a major role in high HCO3− secretion because electroneutral exchangers would run backwards at high concentrations of serosal HCO3− (Sohma et al. 2000). Instead HCO3− is secreted directly through an apical HCO3−-permeable channel, such as CFTR, accounting for the high concentration of HCO3−. In this mechanism, hyperpolarization by IK channels could increase HCO3− secretion via a HCO3−-permeable channel as discussed by Steward et al. (2005).
The Cl− dependency of hyperpolarization on HCO3− secretion (Figs 9 and 11) in PDEC supports the exit of HCO3− through anion exchangers, not HCO3−-permeable channels. It should be mentioned that HCO3− secretion in pancreatic duct cell lines can be elevated by a [Ca2+]i rise even when the membrane potential is clamped with a symmetrical high K+ external solution (Namkung et al. 2003). The underlying mechanism of this Ca2+-dependent HCO3− secretion is not well identified.
Ductal HCO3− and mucin secretion
The major function of HCO3− secreted from PDEC is to neutralize acidic chyme as it enters the duodenum from the stomach. The ductal HCO3− may also alter the rheologic properties of the mucin, the main component of mucus that is secreted from the duct cells. The viscosity of mucin tends to increase at acidic pH (Smith et al. 1989; Bhaskar et al. 1991). If secretion of HCO3− is impaired, as in cystic fibrosis, mucin released from PDEC might not be cleared from the epithelial surface due to an increase of viscosity at low luminal pH. Formation of a mucin gel in the pancreatic ductal tree could lead to the blockage of the small ducts and eventual destruction of the gland (Johansen et al. 1968; Freedman et al. 2001; Namkung et al. 2003). Alkalinization of the pancreatic juice by ductal HCO3− is also critical to endocytosis, membrane recycling, exocytosis, and the secretory function of the neighbouring acinar cells (Freedman et al. 2001). As UTP analogues have been advocated in the treatment of cystic fibrosis, our findings suggest that low concentrations may be preferable to high concentration of these agents as they may increase HCO3− secretion through KCa channels while stimulating less mucin production (Chen et al. 2001).
Acknowledgments
The authors thank Dr J. Duman for comments on the manuscript, T. Wong, T. Wu and E. Tong for help with cell culture, and L. Miller for technical assistance. This work was supported by grants from R & D Program of Advanced Technologies and BK21 program (to D.-S.K), the National Institutes of Health (AR17803 to B.H. and DK55885 to T.D.N.), and the Department of Veterans Affairs (Merit Review to T.D.N.). S.-R.J. was supported by the International Research Internship Program from the Korea Research Foundation.
References
- Akaike N. Gramicidin perforated patch recording and intracellular chloride activity in excitable cells. Prog Biophys Molec Biol. 1996;65:251–264. doi: 10.1016/s0079-6107(96)00013-2. [DOI] [PubMed] [Google Scholar]
- Argent BE, Case RM. In: Physiology of the Gastrointestinal Tract. 3. Johnson ER, editor. New York: Raven Press; 1994. pp. 1473–1497. [Google Scholar]
- Ashton N, Evans RL, Elliott AC, Green R, Argent BE. Regulation of fluid secretion and intracellular messengers in isolated rat pancreatic ducts by acetylcholine. J Physiol. 1993;471:549–562. doi: 10.1113/jphysiol.1993.sp019915. [DOI] [PMC free article] [PubMed] [Google Scholar]
- Berridge MJ, Bootman MD, Roderick HL. Calcium signalling: dynamics, homeostasis and remodelling. Nat Rev Mol Cell Biol. 2003;4:517–529. doi: 10.1038/nrm1155. [DOI] [PubMed] [Google Scholar]
- Bhaskar KR, Gong D, Bansil R, Pajevic S, Hamilton JA, Turner BS, Lamont JT. Profound increase in viscosity and aggregation of pig gastric mucin at low pH. Am J Physiol. 1991;261:G827–G832. doi: 10.1152/ajpgi.1991.261.5.G827. [DOI] [PubMed] [Google Scholar]
- Boyarsky G, Ganz MB, Sterzel RE, Boron WF. pH regulation in single glomerular mesangial cells. I. Acid extrusion in absence and presence of HCO3−. Am J Physiol. 1988;255:C844–C856. doi: 10.1152/ajpcell.1988.255.6.C844. [DOI] [PubMed] [Google Scholar]
- Chen Y, Zhao YH, Wu R. Differential regulation of airway mucin gene expression and mucin secretion by extracellular nucleotide triphosphates. Am J Respir Cell Mol Biol. 2001;25:409–417. doi: 10.1165/ajrcmb.25.4.4413. [DOI] [PubMed] [Google Scholar]
- Devor DC, Singh AK, Frizzell RA, Bridges RJ. Modulation of Cl− secretion by benzimidazolones. I. Direct activation of a Ca2+-dependent K+ channel. Am J Physiol. 1996;271:L775–L784. doi: 10.1152/ajplung.1996.271.5.L775. [DOI] [PubMed] [Google Scholar]
- Dolmetsch RE, Xu K, Lewis RS. Calcium oscillations increase the efficiency and specificity of gene expression. Nature. 1998;392:933–936. doi: 10.1038/31960. [DOI] [PubMed] [Google Scholar]
- Eshete F, Fields RD. Spike frequency decoding and autonomous activation of Ca2+-calmodulin-dependent protein kinase II in dorsal root ganglion neurons. J Neurosci. 2001;21:6694–6705. doi: 10.1523/JNEUROSCI.21-17-06694.2001. [DOI] [PMC free article] [PubMed] [Google Scholar]
- Freedman SD, Kern HF, Scheele GA. Pancreatic acinar cell dysfunction in CFTR-/- mice is associated with impairments in luminal pH and endocytosis. Gastroenterology. 2001;121:950–957. doi: 10.1053/gast.2001.27992. [DOI] [PubMed] [Google Scholar]
- Gerlach AC, Gangopadhyay NN, Devor DC. Kinase-dependent regulation of the intermediate conductance, calcium-dependent potassium channel, hIK1. J Biol Chem. 2000;275:585–598. doi: 10.1074/jbc.275.1.585. [DOI] [PubMed] [Google Scholar]
- Grynkiewicz G, Poenie M, Tsien RY. A new generation of Ca2+ indicators with greatly improved fluorescence properties. J Biol Chem. 1985;260:3440–3450. [PubMed] [Google Scholar]
- Hajnóczky G, Robb-Gaspers LD, Seitz MB, Thomas AP. Decoding of cytosolic calcium oscillations in the mitochondria. Cell. 1995;82:415–424. doi: 10.1016/0092-8674(95)90430-1. [DOI] [PubMed] [Google Scholar]
- Hamill OP, Marty A, Neher E, Sakmann B, Sigworth FJ. Improved patch-clamp techniques for high-resolution current recording from cells and cell-free membrane patches. Pflugers Arch. 1981;391:85–100. doi: 10.1007/BF00656997. [DOI] [PubMed] [Google Scholar]
- Huang CL, Feng S, Hilgemann DW. Direct activation of inward rectifier potassium channels by PIP2 and its stabilization by Gβγ. Nature. 1998;391:803–806. doi: 10.1038/35882. [DOI] [PubMed] [Google Scholar]
- Ishiguro H, Naruse S, Kitagawa M, Hayakawa T, Case RM, Steward MC. Luminal ATP stimulates fluid and HCO3− secretion in guinea-pig pancreatic duct. J Physiol. 1999;591:551–558. doi: 10.1111/j.1469-7793.1999.0551m.x. [DOI] [PMC free article] [PubMed] [Google Scholar]
- Ishii TM, Silvia C, Hirschberg B, Bond CT, Adelman JP, Maylie J. A human intermediate conductance calcium-activated potassium channel. Proc Natl Acad Sci U S A. 1997;94:11651–11656. doi: 10.1073/pnas.94.21.11651. [DOI] [PMC free article] [PubMed] [Google Scholar]
- Jensen BS, Ødum N, Jørgensen NK, Christiophersen P, Olesen SP. Inhibition of T cell proliferation by selective block of Ca2+-activated K+ channels. Proc Natl Acad Sci U S A. 1999;96:10917–10921. doi: 10.1073/pnas.96.19.10917. [DOI] [PMC free article] [PubMed] [Google Scholar]
- Johansen PG, Anderson CM, Hadorn B. Cystic fibrosis of the pancreas. A generalised disturbance of water and electrolyte movement in exocrine tissues. Lancet. 1968;1:455–460. [PubMed] [Google Scholar]
- Joiner WJ, Wang LY, Tang MD, Kaczmarek LK. hSK4, a member of a novel subfamily of calcium-activated potassium channels. Proc Natl Acad Sci U S A. 1997;94:11013–11018. doi: 10.1073/pnas.94.20.11013. [DOI] [PMC free article] [PubMed] [Google Scholar]
- Jones HM, Hamilton KL, Devor DC. Role of an S4–S5 linker lysine in the trafficking of the Ca2+-activated K+ channels IK1 and SK3. J Biol Chem. 2005;280:37257–37265. doi: 10.1074/jbc.M508601200. [DOI] [PubMed] [Google Scholar]
- Jung SR, Kim MH, Hille B, Nguyen TD, Koh DS. Regulation of exocytosis by purinergic receptors in pancreatic duct epithelial cells. Am J Physiol. 2004;286:C573–C579. doi: 10.1152/ajpcell.00350.2003. [DOI] [PubMed] [Google Scholar]
- Kasai H. Comparative biology of Ca2+-dependent exocytosis: implications of kinetic diversity for secretory function. Trends Neurosci. 1999;22:88–93. doi: 10.1016/s0166-2236(98)01293-4. [DOI] [PubMed] [Google Scholar]
- Khanna R, Chang MC, Joiner WJ, Kaczmarek LK, Schlichter LC. hSK4/hIK1, a calmodulin-binding KCa channel in human T lymphocytes. Roles in proliferation and volume regulation. J Biol Chem. 1999;274:14838–14849. doi: 10.1074/jbc.274.21.14838. [DOI] [PubMed] [Google Scholar]
- Ko SB, Zeng W, Dorwart MR, Luo X, Kim KH, Millen L, Goto H, Naruse S, Soyombo A, Thomas PJ, Muallem S. Gating of CFTR by the STAS domain of SLC26 transporters. Nat Cell Biol. 2004;6:343–350. doi: 10.1038/ncb1115. [DOI] [PMC free article] [PubMed] [Google Scholar]
- Koegel H, Alzheimer C. Expression and biological significance of Ca2+-activated ion channels in human keratinocytes. FASEB J. 2001;15:145–154. doi: 10.1096/fj.00-0055com. [DOI] [PubMed] [Google Scholar]
- Koh DS, Hille B. Modulation by neurotransmitter of catecholamine secretion from sympathetic ganglion neurons detected by amperometry. Proc Natl Acad Sci U S A. 1997;94:1506–1511. doi: 10.1073/pnas.94.4.1506. [DOI] [PMC free article] [PubMed] [Google Scholar]
- Koh DS, Moody MW, Nguyen TD, Hille B. Regulation of exocytosis by protein kinases and Ca2+ in pancreatic duct epithelial cells. J General Physiol. 2000;116:507–519. doi: 10.1085/jgp.116.4.507. [DOI] [PMC free article] [PubMed] [Google Scholar]
- Larsen AZ, Kummer U. In: Understanding Calcium Dynamics: Experiments and Theory. Falke M, Malchow D, editors. Berlin: Springer; 2003. pp. 153–178. [Google Scholar]
- Lazarowski ER, Homolya L, Boucher RC, Harden TK. Direct demonstration of mechanically induced release of cellular UTP and its implication for uridine nucleotide receptor activation. J Biol Chem. 1997;272:24348–24354. doi: 10.1074/jbc.272.39.24348. [DOI] [PubMed] [Google Scholar]
- Lisman J, Schulman H, Cline H. The molecular basis of CaMKII function in synaptic and behavioural memory. Nat Rev Neurosci. 2002;3:175–190. doi: 10.1038/nrn753. [DOI] [PubMed] [Google Scholar]
- Lohi H, Kujala M, Kerkelä E, Saarialho-Kere U, Kestilä M, Kere J. Mapping of five new putative anion transporter genes in human and characterization of SLC26A6, a candidate gene for pancreatic anion exchanger. Genomics. 2000;70:102–112. doi: 10.1006/geno.2000.6355. [DOI] [PubMed] [Google Scholar]
- Lu M, Hebert SC, Giebisch G. Hydrolyzable ATP and PIP2 modulate the small-conductance K+ channel in apical membranes of rat cortical-collecting duct (CCD) J General Physiol. 2002;120:603–615. doi: 10.1085/jgp.20028677. [DOI] [PMC free article] [PubMed] [Google Scholar]
- Mall M, Gonska T, Thomas J, Schreiber R, Seydewitz HH, Kuehr J, Brandis M, Kunzelmann K. Modulation of Ca2+-activated Cl− secretion by basolateral K+ channels in human normal and cystic fibrosis airway epithelia. Pediatr Res. 2003;53:608–618. doi: 10.1203/01.PDR.0000057204.51420.DC. [DOI] [PubMed] [Google Scholar]
- Muallem S, Loessberg PA. Intracellular pH-regulatory mechanisms in pancreatic acinar cells. II. Regulation of H+ and HCO3− transporters by Ca2+-mobilizing agonists. J Biol Chem. 1990;265:12813–12819. [PubMed] [Google Scholar]
- Namkung W, Lee JA, Ahn W, Han WS, Kwon SW, Ahn DS, Kim KH, Lee MG. Ca2+ activates cystic fibrosis transmembrane conductance regulator- and Cl−-dependent HCO3− transport in pancreatic duct cells. J Biol Chem. 2003;278:200–207. doi: 10.1074/jbc.M207199200. [DOI] [PubMed] [Google Scholar]
- Nguyen TD, Meichle S, Kim US, Wong T, Moody MW. P2Y11, a purinergic receptor acting via cAMP, mediates secretion by pancreatic duct epithelial cells. Am J Physiol. 2001;280:G795–G804. doi: 10.1152/ajpgi.2001.280.5.G795. [DOI] [PubMed] [Google Scholar]
- Nguyen TD, Moody MW. Calcium-activated potassium conductances on cultured nontransformed dog pancreatic duct epithelial cells. Pancreas. 1998a;17:348–358. doi: 10.1097/00006676-199811000-00005. [DOI] [PubMed] [Google Scholar]
- Nguyen TD, Moody MW, Savard CE, Lee SP. Secretory effects of ATP on nontransformed dog pancreatic duct epithelial cells. Am J Physiol. 1998b;275:G104–G113. doi: 10.1152/ajpgi.1998.275.1.G104. [DOI] [PubMed] [Google Scholar]
- Novak I, Greger R. Properties of the luminal membrane of isolated perfused rat pancreatic ducts. Effect of cyclic AMP and blockers of chloride transport. Pflugers Arch. 1988;411:546–553. doi: 10.1007/BF00582376. [DOI] [PubMed] [Google Scholar]
- Oancea E, Meyer T. Protein kinase C as a molecular machine for decoding calcium and diacylglycerol signals. Cell. 1998;95:307–318. doi: 10.1016/s0092-8674(00)81763-8. [DOI] [PubMed] [Google Scholar]
- Oda D, Savard CE, Nguyen TD, Eng L, Lee SP. The Effect of N-methyl-N-nitro-N-nitrosoguanidine (MNNG) on cultured dog pancreatic duct epithelial cells. Pancreas. 1996a;2:109–116. doi: 10.1097/00006676-199603000-00001. [DOI] [PubMed] [Google Scholar]
- Oda D, Savard CE, Nguyen TD, Eng L, Swenson ER, Lee SP. Dog pancreatic duct epithelial cells: long-term culture and characterization. Am J Pathol. 1996b;148:977–985. [PMC free article] [PubMed] [Google Scholar]
- Peña TL, Rane SG. The fibroblast intermediate conductance KCa channel, FIK, as a prototype for the cell growth regulatory function of the IK channel family. J Membr Biol. 1999;172:249–257. doi: 10.1007/s002329900601. [DOI] [PubMed] [Google Scholar]
- Schuster S, Marhl M, Höfer T. Modelling of simple and complex calcium oscillations. From single-cell responses to intercellular signalling. Eur J Biochem. 2002;269:1333–1355. doi: 10.1046/j.0014-2956.2001.02720.x. [DOI] [PubMed] [Google Scholar]
- Schwiebert EM. ATP release mechanisms, ATP receptors and purinergic signalling along the nephron. Clin Exp Pharmacol Physiol. 2001;28:340–350. doi: 10.1046/j.1440-1681.2001.03451.x. [DOI] [PubMed] [Google Scholar]
- Smith BF, Peetermans JA, Tanaka T, LaMont JT. Subunit interactions and physical properties of bovine gallbladder mucin. Gastroenterology. 1989;97:179–187. doi: 10.1016/0016-5085(89)91433-9. [DOI] [PubMed] [Google Scholar]
- Sohma Y, Gray MA, Imai Y, Argent BE. HCO3− transport in a mathematical model of the pancreatic ductal epithelium. J Membr Biol. 2000;176:77–100. doi: 10.1007/s00232001077. [DOI] [PubMed] [Google Scholar]
- Sørensen CE, Novak I. Visualization of ATP release in pancreatic acini in response to cholinergic stimulus. Use of fluorescent probes and confocal microscopy. J Biol Chem. 2001;276:32925–32932. doi: 10.1074/jbc.M103313200. [DOI] [PubMed] [Google Scholar]
- Steward MC, Ishiguro H, Case RM. Mechanisms of bicarbonate secretion in the pancreatic duct. Annu Rev Physiol. 2005;67:377–409. doi: 10.1146/annurev.physiol.67.031103.153247. [DOI] [PubMed] [Google Scholar]
- Whitcomb DC, Ermentrout GB. A mathematical model of the pancreatic duct cell generating high bicarbonate concentrations in pancreatic juice. Pancreas. 2004;29:e30–e40. doi: 10.1097/00006676-200408000-00016. [DOI] [PubMed] [Google Scholar]


