Abstract
In cone beam breast computed tomography (CT), scattered radiation leads to nonuniform biasing of CT numbers known as a cupping artifact. Besides being visual distractions, cupping artifacts appear as background nonuniformities, which impair efficient gray scale windowing and pose a problem in threshold based volume visualization/segmentation. To overcome this problem, we have developed a background nonuniformity correction method specifically designed for cone beam breast CT. With this technique, the cupping artifact is modeled as an additive background signal profile in the reconstructed breast images. Due to the largely circularly symmetric shape of a typical breast, the additive background signal profile was also assumed to be circularly symmetric. The radial variation of the background signals were estimated by measuring the spatial variation of adipose tissue signals in front view breast images. To extract adipose tissue signals in an automated manner, a signal sampling scheme in polar coordinates and a background trend fitting algorithm were implemented. The background fits compared with targeted adipose tissue signal value (constant throughout the breast volume) to get an additive correction value for each tissue voxel. To test the accuracy, we applied the technique to cone beam CT images of mastectomy specimens. After correction, the images demonstrated significantly improved signal uniformity in both front and side view slices. The reduction of both intra-slice and inter-slice variations in adipose tissue CT numbers supported our observations.
Keywords: cone beam computed tomography, cupping artifact, background nonuniformity, breast CT
1. Introduction
Scattered radiation remains one of the most challenging problems to address in cone beam computed tomography (CBCT). Presence of scatter in the projection images leads to a reduction of low contrast sensitivity, artifacts such as dark bands behind dense objects, and slowly varying CT number nonlinearities known as the cupping artifacts in reconstructed 3D images. Beam hardening is also known to be a source of similar CT image artifacts. However we have observed that the x-ray scatter is the dominant cause of cupping artifacts in CBCT breast scanning geometry1. Similar observations were also reported in the literature2.
To reduce scatter-induced image quality degradation, either scatter rejection or scatter correction techniques may be used with different effects. Anti-scatter grids3, 4 are also used in CBCT to preferentially reduce detected scattered radiation during image acquisition. It has been shown to reduce the cupping and shading artifacts and improve the CT number accuracy. However, there is little improvement on degradation in the contrast sensitivity due to the significant attenuation of the primary x-rays by the anti-scatter grid.
To correct for the scatter component in the image data, the scatter signal can be estimated from either modeling or measurement, and then subtracted from the projection images to obtain largely scatter free image data. In the scatter modeling approach, the scatter signals in projection images could be calculated by analytical, empirical, or Monte Carlo methods for objects with predetermined compositions and shapes5-9. In the scatter measurement approach, the scatter signals could be measured directly in the shadows of a beam stop array1, 10-12 or tube collimator blades13. After the image acquisition phase, a 2D scatter signal map can be generated by interpolating the signals behind the beam stops or collimator blades in each projection image. Subsequently, this scatter map is subtracted from the corresponding projection images to obtain largely scatter free image data.
Although the image correction approach cannot be used to recover the contrast sensitivity, it is effective in recovering the accuracy of the projection image data for x-ray transmission measurement, and in reducing the non-uniformity of the CBCT signals that may be depicted as the cupping artifacts. However, scatter correction performed on the projection images requires extensive computation to estimate the two dimensional scatter signal profile in conjunction with the use of sampled physical scatter measurements that are integrated with the image acquisition process or performed with additional exposures.
In cone beam breast CT14-19 images from a dedicated scanner in which the breast is imaged in pendant geometry, scatter-induced artifacts follow a more predictable pattern. With these images, the cupping artifacts appear to be largely circularly symmetric and streak artifacts do not exist because of the circular shape and soft tissue-only composition of the breast. These features have allowed us to develop a practical, yet effective, technique to correct for the cupping artifacts and improve the CT number uniformity in the reconstructed images. In this paper, the principle and implementation of this technique are described. Application of this technique to cone beam breast CT images is used to demonstrate the correction procedure and the resulting benefits. Issues in the implementation of the technique are also discussed.
2. Materials and methods
We have constructed a bench top experimental cone beam CT system and use it to image mastectomy specimens. For the specimen imaging studies, specimens were delivered directly from the mastectomy operation room to the imaging laboratory located in the same building. Mastectomy specimens were placed and scanned in a thin plastic holder by using a flat panel detector based bench top CBCT system20. During the scans the imaging geometry of the specimen mimicked the pendant breast scanning geometry; the rotation axis (the z axis) was almost parallel to the chest wall-nipple direction which was referred as axial direction in the rest of the text. The front view images (axial slices) and side view images shown in figures correspond to imaging planes orthogonal and parallel to the axial direction respectively.
Scans were acquired at 80kVp using a clinical, tungsten anode x-ray tube without added filtration. The estimated mean glandular dose varied between 12 and 24 mGy, and the whole volume of specimen was scanned in all studies. The images were reconstructed by using the FDK algorithm21 and the ramp filter. The resulting images demonstrate that the breast tissue consists mainly of two distinctively different types of tissue: the adipose tissue and the dense tissue. The latter include the fibroglandular tissue, tumor and skin tissue. Thus, voxels in the cone beam CT images cover either the adipose tissue or the dense tissue. Only along the border of the dense tissue structures may the voxels cover a combination of both the adipose tissue and the dense tissue. Otherwise, the adipose and the dense tissue are visually well separated from each other. The breast is a relatively simple object consisting of only soft tissue, thus there is generally no shading and streak artifacts. The shape of the breast approximates part of an ellipsoid. With the breast centered with the rotating axis and scanned in the pendant geometry, it may be considered as a circularly symmetric object with which the cupping artifacts would be symmetric around the breast center in each axial view image.
Based on our observations above and physics behind the scatter artifacts2, 20, effects of scatted x-rays and the basis for the correction algorithm may be illustrated with a hypothetical example in Fig. 1: In Fig.1a, a noise-free axial view of the breast phantom, which is composed of fibroglandular (solid white circles, we will refer to fibroglandular tissue as dense tissue in the rest of the text) and adipose tissue is shown. Fig. 1b shows the signal profile along the dotted line for both x-ray scatter free and x-ray scatter included cases. The bias introduced by scatter depends on the location (more towards the center) and the tissue CT number (more bias for higher CT numbers). As a result, the dense tissue close the center had the most CT number degradation. In Fig. 1c, we illustrated this problem as a nonuniform background and degraded contrast difference with respect to the background. In breast CBCT images, the nonuniformity of the background may be so severe that the dense tissue to the center may have smaller CT numbers than the adipose tissue at the periphery. Therefore, the need for background nonuniformity correction arises in the implementation of visualization and segmentation techniques using CT number thresholding. To correct the background nonuniformity ideally, we assume that we have the prior knowledge about the true background signal. Hence, we can generate a simple additive background correction value to map back the nonuniform background to the true background (Fig. 1d). Unlike the ideal scatter correction, where degraded CT numbers are mapped back to true CT numbers, the ideal background correction improves the CT number uniformity; the degradation of conrast difference will remain the same. Although we do not have prior information about the true background signal, which is a constant, we can pick an “expected” background signal value for the correction procedure. The difference between true and expected background value will simply introduce a DC shift to all signals, which has minimal impact on visualization and segmentation techniques.
Figure 1.

Illustration of an axial breast CBCT image is shown in (a). White solid circles represent fibroglandular tissue and the gray area represents the adipose tissue. The signal profiles along the dotted line is plotted in (b). (b) shows the signal profile with and without scatter artifacts, and the background profiles are marked in (c). The comparison of corrected signal profiles after ideal scatter correction and ideal background correction is shown in (d).
The above characterization of the cupping artifacts in cone beam breast CT allow us to develop a post-reconstruction technique to correct for these artifacts. With this technique, the cupping artifacts can be approximated as an additive background signal profile which lowers the true tissue signals in a non-uniform way-greater bias towards the breast center. Based on this approximation, the adipose or dense tissue signal at the voxel located at (x, y) in an axial slice located at z in the reconstruction volume, Qtissue (x, y, z) can be expressed as follows:
| (1) |
where,
| (2) |
Qexptissue is the expected adipose or dense tissue signals after cupping correction and it is a constant; C(x, y, z) is the smooth bias signal introduced by the cupping artifact. From Eq. 1, C(x, y, z) can be estimated by choosing an expected value for Qexpadipose and subtracting it from Qadipose (x, y, z). To reduce the noise level for the estimated C(x, y, z), Qadipose (x, y, z) may be smoothed to be Zadipose (x, y, z) and C(x, y, z) may be estimated and expressed as follows:
| (3) |
Thus, once estimated, C(x, y, z) can be subtracted from the cone beam CT signals, Qtissue (x, y, z), to obtain a more accurate representation of the tissue signals, Qcortissue (x, y, z), as follows:
| (4) |
From Eq. 3, it appears that in order to estimate C(x, y, z), Zadipose (x, y, z) needs to be measured for every point in the reconstructed volume. However, dense tissue structures are usually present in a breast and the adipose tissue signals cannot be measured in these structures. Thus, Zadipose (x, y, z) must be estimated for any non-adipose tissue voxel by employing 2D interpolation.
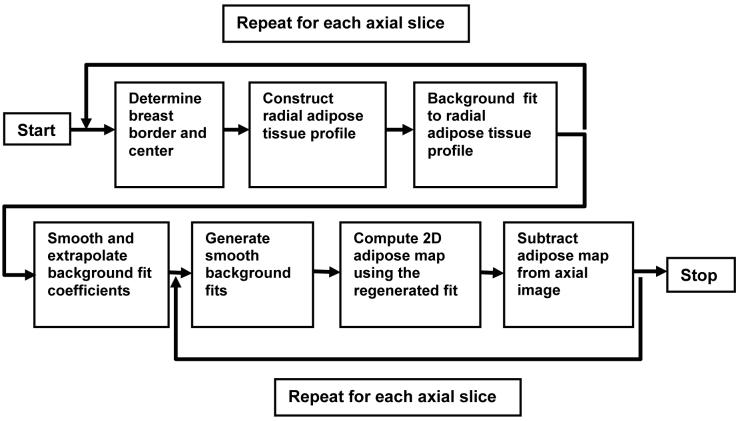
However, the problem then arises as how to automatically sample the adipose tissue pixels needed for 2D interpolation. This can be done by reducing the 2D problem to 1D by using the circular symmetry assumption for the cupping artifact. For a typical breast scanned in the pendant geometry, we can assume it to be a circularly symmetric object centered with the rotating axis of the scanner. Thus, we can also assume that the scatter (cupping) effect is symmetric around the isocenter. This means that in an axial image, Zadipose (x, y, z) and C(x, y, z) have similar values along a ring at the same distance from the isocenter. Thus, they may be measured at a few selected sampling points and used to construct the correction signals for all points on the ring. We have developed and tested a concentric rings sampling technique to obtain sampled measurement of the adipose tissue signal for each different radius and use the measurement result to construct a 1D radial adipose tissue signal profile (RATP) which can then be used to form a circularly symmetric background correction signal profile. The sampling and correction procedures are described and discussed in the following sections. A flow chart is shown to illustrate the correction technique in Fig. 2.
Figure 2.
Flow chart of the cupping artifact correction method.
2.1 Sampling of adipose tissue signals
To reduce fluctuation due to image noise, the images were first smoothed using an averaging filter with a small kernel (e.g. 3x3) to reduce the noise level. Next, the breast tissue-air border was detected to determine the region of interest (ROI) to be sampled. A threshold based method was used for this detection, and a binary ROI mask was created. Pixels with partial volume effects near the breast borders or in the specimen were discarded to avoid erroneous measurements. Center of gravity, (x0 (z), y0 (z)), of the binary ROI mask was determined for each axial slice along z direction. In the following sections, we assume that the center of the circularly symmetric cupping artifact was located at x0, y0.
To exploit the circular symmetry of the cupping artifact, each axial image, Q(x, y, z)|z=const, was expressed again in polar coordinates as Q′(r,θ,z), where the origin of the polar coordinate system was at the center of the breast and r and θ are related to x, y as follows:
| (5) |
and
| (6) |
Since each axial image was processed independently, we omitted the variable z from the expressions and equations in the rest of the paper for simplification purpose. Due to the symmetry of the cupping effect, the adipose tissue signals should be roughly the same along any ring centered with the breast. Thus, the radial adipose tissue signal profile (RATP) was measured by extracting the adipose tissue signals over a series of concentric rings with various radii. Over each ring, the image signals were sampled every 10 degrees, resulting in 36 samples for each different radius. As the adipose tissue is supposed to have the lowest density and therefore the lowest CT number on each ring, the adipose tissue signal was determined by extracting the minimum value from the 36 sampled signals for each radius, ri, to form the RATP, R(ri):
| (7) |
This processing is sometimes referred to as the order statistics filtering (OSF). This tissue sampling scheme can also be used to create a radial dense tissue profile by selecting the maximum value from the sample set. In Fig. 3 the axial (front view) image of a mastectomy specimen is shown. The ring with the radius r shows where 36 samples are collected to determine the value of R(ri) at ri = r. Fig. 4 shows two randomly picked radial signal profiles, (Q′(r,90°) and Q′(r,180°)), and the RATP, R(ri), generated from the image in Fig. 3. As shown by Fig. 4, dense tissue signals have been filtered out and the extracted adipose tissue signals in R(ri) clearly demonstrate the radial dependence of the cupping artifacts. Although the RATP may be slightly underestimated by selecting the minimum value of all image signals to represent the adipose tissue signal in Eq. 7, it is less noisy than the radial signal profiles due to the low-pass filtering effect of the OSF.
Figure 3.
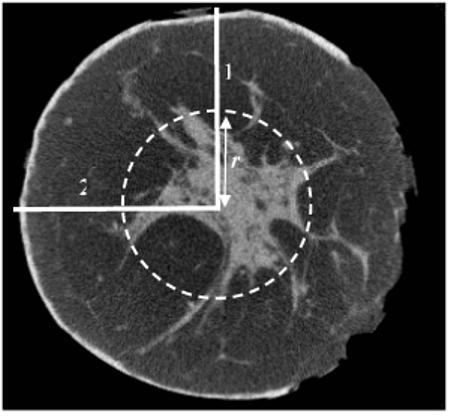
An axial view of the breast mastectomy specimen CBCT image. Two lines represent the radial profiles of the image at θ equal to 90 (1) and 180 (2). The intersection points of the circle and the radial profiles show two sample locations at a distance r from the origin.
Figure 4.
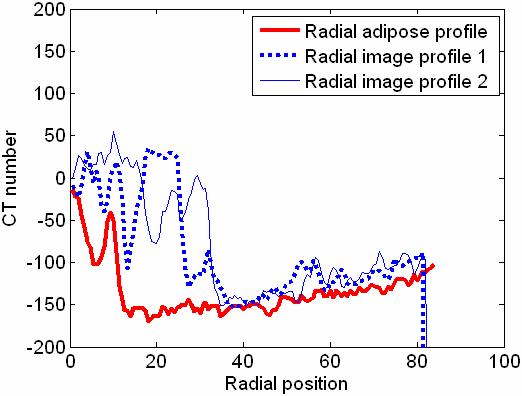
Radial adipose tissue profile (RATP) of the axial slice shown in Fig. 3. Two sample radial profiles taken from Fig. 3 were also plotted for comparison.
2.2 Curve fitting for the radial adipose tissue profiles (RATPs)
To successfully use OSF to filter out dense tissue signals and extract an adipose tissue signal in forming the RATPs, one of the sampled voxels must cover the adipose tissue region. This is generally the case when the radius is large and the sampled voxels cover a large region. However, when the radius is small, the sampling ring covers a smaller region which may not cover any adipose tissue and dense tissue signals would be erroneously extracted for the RATPs. Thus, the probability of dense tissue contamination in an RATP is inevitably higher for samples taken close to the origin. An example of this contamination is shown in the 0−14 position range in Fig. 4. A further concern was that samples taken from the outer rings near the breast border may contain all skin tissue signals and no adipose tissue signals. As a result, the skin tissue signals would be extracted for the RATPs. Thus, two peaks, one near the center and one near the border, may appear in the RATPs.
To overcome this problem, we adopted an automated, least-square background estimation method introduced by Steenstrup22. With this method, an orthogonal polynomial is fitted using the least-square technique to an array consisting of true background values and non-background values to obtain a smooth approximation of the background. A weighting factor is assigned to each data point and adjusted in an iterative fashion so that non-background values get smaller weights. A more detailed description of this method is given in the Appendix. The background curve fitting method was applied to the RATP for each axial image and the background fit of the RATP, Z(r) , instead of the RATP itself, was used in the rest of the correction procedure. Fig. 5 shows a second order background fit to a simulated RATP, consisting of a slowly varying noisy background profile to mimic the adipose tissue signals superimposed with the cupping artifact and two peaks to simulate the dense tissue signals near the center and the skin signals near the breast border. As Fig. 5 shows, the effects of the two peaks on the fit are minimal, and the background estimation is in good agreement with the true background.
Figure 5.
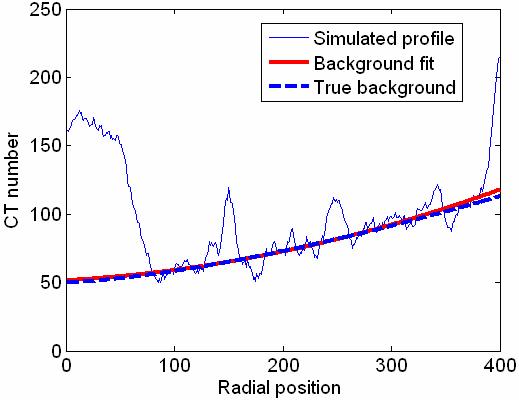
Background fit to a simulated RATP. The curve fit is in agreement with the true background.
2.3 Smoothing the RATP background fits along the axial direction
Although the above described background fitting procedure was effective in minimizing the contamination of the dense tissue or skin signals, the accuracy of the background fit depended on the magnitude of fluctuations in the RATPs. Furthermore, the dense tissue signals would not always appear as peaks in RATPs. In some instances, they might appear as slowly varying perturbations indistinguishable from the noisy background. Thus, the transition of the background fits from one slice to the next is not uniformly smooth.
This problem was overcome by forcing the background fits to be smooth and slowly varying by smoothing the polynomial coefficients rather than smoothing the background fits. A theoretical basis for this technique and applications of this technique has been discussed in previous literature23-25. The background fitting method described in section 2.2 was employed again for smoothing the polynomial coefficients. Smooth background fits, Zsmooth (r), were regenerated by computing the fits with the smoothed coefficients.
In addition to smoothing the background fits in the axial direction, this smoothing technique was also useful for extrapolation. For instance, the adipose tissue fraction and the area of the breast tissue drop significantly in the proximity of the nipple, degrading the accuracy of the background fits. Extrapolated polynomial coefficients were used for these slices if the area of ROI was smaller than a predetermined threshold.
2.4 Correction of axial images
For each axial image, the smoothed RATP background fits were transformed back to the Cartesian coordinates, and used to compute the 2D adipose tissue signal map:
| (8) |
Using Eq. 3 and the expected adipose tissue signal, Qexpadipose, the correction signal profiles, C(x, y, z), were computed and subtracted from the cone beam CT image signals, Qtissue (x, y, z), for correction of the cupping artifacts. As we indicated earlier, the value of Qexpadipose represents the expected adipose tissue CT number after correction, and its value was picked as −50.
3. Results
Fig. 6a shows the cupping artifact signal profile estimated by independently fitting the RATPs extracted from 200 consecutive axial slice images of a mastectomy specimen. Although most of the fits seem to follow a slowly varying trend as along the axial direction, transition between two consecutive slices was not uniformly smooth. Also, a small number of the fits deviated substantially from the trend, e.g. those at around the 190th slice. The profiles formed by the fits regenerated with smoothed polynomial coefficients are shown in Fig. 6b. As can be seen, the slice-to-slice discontinuities were smoothed out, and the outlying inaccurate fits largely eliminated.
Figure 6.
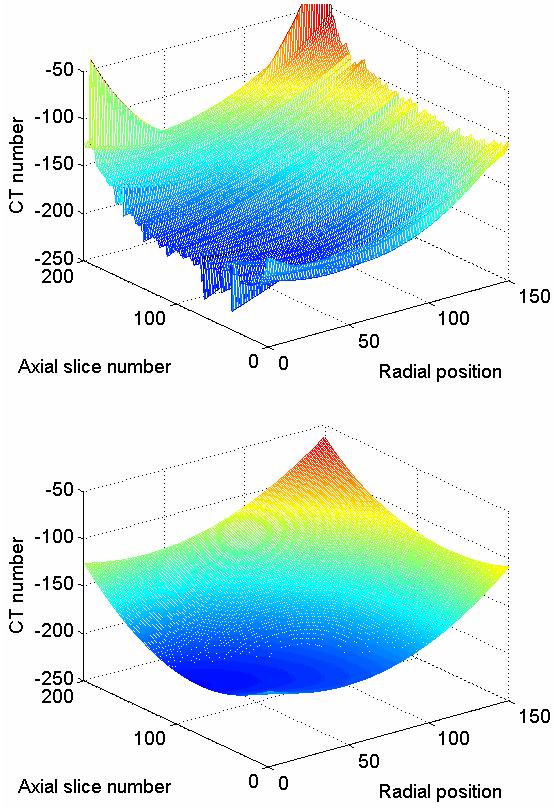
Background fits to RATPs are shown as a function of axial slice location. (a) Fits before polynomial coefficient smoothing. (b) Regenerated fits obtained after polynomial coefficient smoothing.
We applied the cupping artifact correction to different sets of mastectomy specimen images where full reconstructed volumes were corrected. Example axial images from three different specimens are shown in Fig. 7. First and second row correspond to uncorrected and corrected images respectively. All images are displayed using the same gray scale window setting. Two of the specimens were medium sized (Figs. 7a and 7b), with a volume of approximately 800 and 1000 cc respectively, the third one was large (Fig. 7c), with a volume of approximately 2000 cc. As all three specimens had different volumes and are represented by different image sizes, images were rescaled to the same size for printing. In these images, fibroglandular tissue (higher CT number, spiculated white colored regions) is visually separated well from the adipose tissue. The skin is only partially included at the perimeter in Fig. 7a and 7b. Also several air pockets are visible in Fig. 7a and 7b. Cupping artifacts are clearly demonstrated as lower signals (darker gray scale levels) towards the center in Figs. 7a, 7b and 7c. Fig. 7d, 7e, and 7f show the corresponding corrected images in which the cupping artifacts were reduced to visually undetectable levels. Similar image quality improvements were observed in the rest of the axial images for all three specimens.
Figure 7.
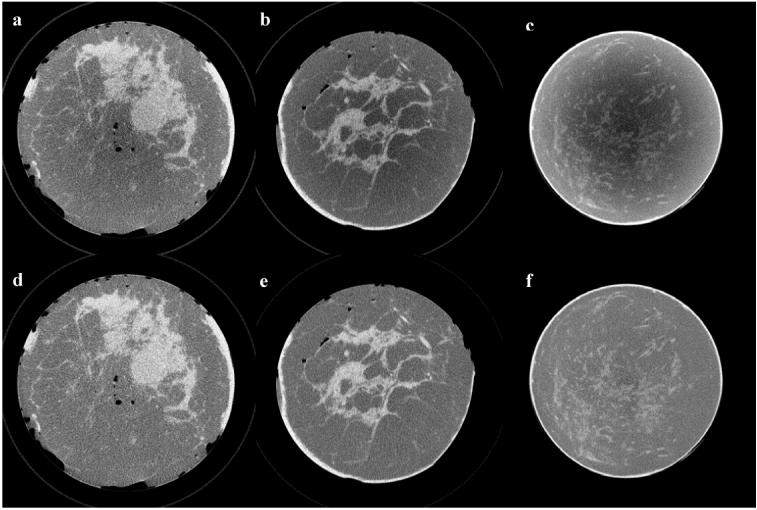
Sample axial views picked from three different mastectomy specimen CBCT image sets are shown before (a, b, c) and after correction (d, e, f). Images were rescaled to the same size to display in the same figure and they are displayed at the same gray scale window setting.
Figs. 8a and 8b show the side view images of a medium-sized specimen (axial view is shown in Fig. 7b) without and with the correction, respectively. Both images are displayed at the same gray scale window setting. As seen in the images, the CT number nonuniformity varies slowly along the vertical direction, indicating that the magnitude of cupping artifact changes from axial slice to axial slice. After cupping correction, gray scale values appear to be more uniform along the central axis of the breast. Also, row-to-row signal variation is smooth, demonstrating the benefit of using smoothed polynomial coefficients to generate correction signals for different slices. The horizontal streaks in the upper section of the images are metal artifacts due to metal surgical clips in the tissue.
Figure 8.
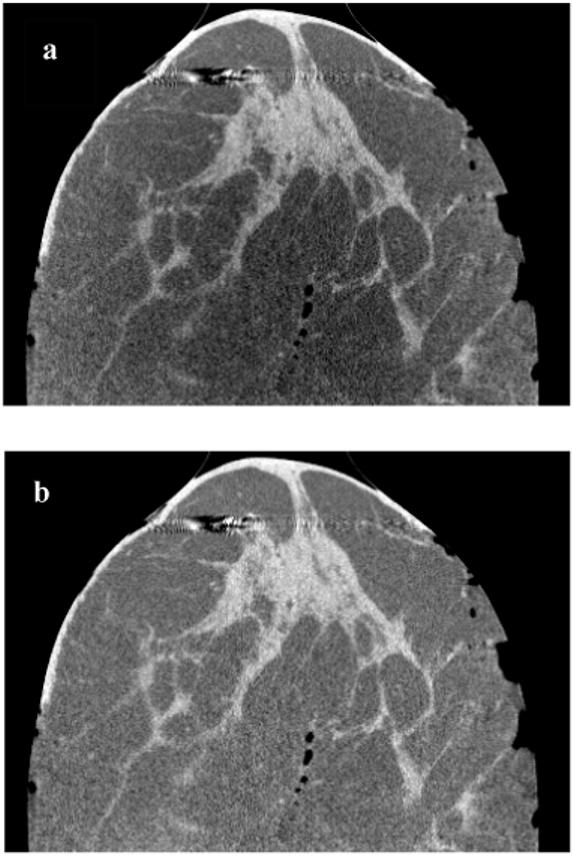
Side views of a medium size mastectomy specimen CBCT images are shown before (a) and after correction (b). Both images are displayed at the same gray scale window setting. In (a), it’s clearly visible that the magnitude of nonuniformity due to cupping varies in the vertical direction. In (b), nonuniformity was reduced to visually undetectable levels.
The CT number histograms of a corrected and an uncorrected image are shown in Fig. 9. The improvement in signal uniformity is indicated by the narrower peaks, and better separation of the adipose and dense tissue signals in the corrected image. It should be noted that the adipose tissue peak in the histogram is close to the expected adipose tissue signal value, −50.
Figure 9.
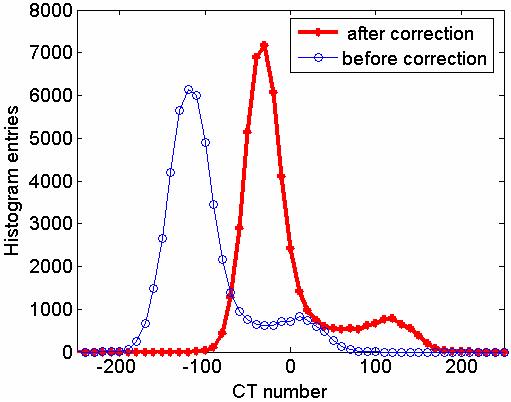
CT number histogram for uncorrected and corrected images of an axial slice is shown. Note that the difference between the adipose tissue and dense tissue signal peak is 150.
Since the ground truth for cupping nonuniformity was not known, we investigated the relative improvement in adipose tissue CT number uniformity by segmenting the adipose tissue in the reconstructed volume. To achieve this, we employed a seeded region growing algorithm26 with a fixed threshold to create a binary adipose tissue mask from the cupping artifact corrected images. The binary mask was then applied to both corrected and uncorrected images to get identical sets of adipose tissue–only voxels. Segmented regions were smoothed to reduce the stochastic noise. We analyzed the images by computing the mean and standard deviation of image data in the segmented regions in each axial image. The variation of the mean along the axial direction measures the inter-slice uniformity. The standard deviation for data in each slice measures the intra-slice uniformity.
In Fig. 10a and 10b, the mean and standard deviation of adipose tissue signals are plotted as a function of the axial position for a medium-sized and a large specimen, respectively. (Axial images of these specimens are shown in Fig. 7b and Fig. 7c, respectively.) The variation range of the mean and standard deviation values are summarized in Table I. In Fig. 10a, the mean CT numbers varied from −136 to −116 before correction and from −36 to −21 after correction. The standard deviations of the adipose tissue signals in the uncorrected axial images varied from 16 to 31 before correction. After correction, the standard deviation values were smaller and more uniform, varying from 10 to 10.5. As shown by Fig. 10b, the mean CT numbers were significantly lower for the large specimen before correction, ranging from −225 to −190. After correction, they ranged from −35 and −14. The standard deviations of the adipose tissue signals in the uncorrected axial images were quite high as the result of severe cupping artifacts associated with the higher scatter component in the projection images of a large specimen. They varied from 60 to 72 before correction but were reduced to from 11 to 14 after correction.
Figure 10.
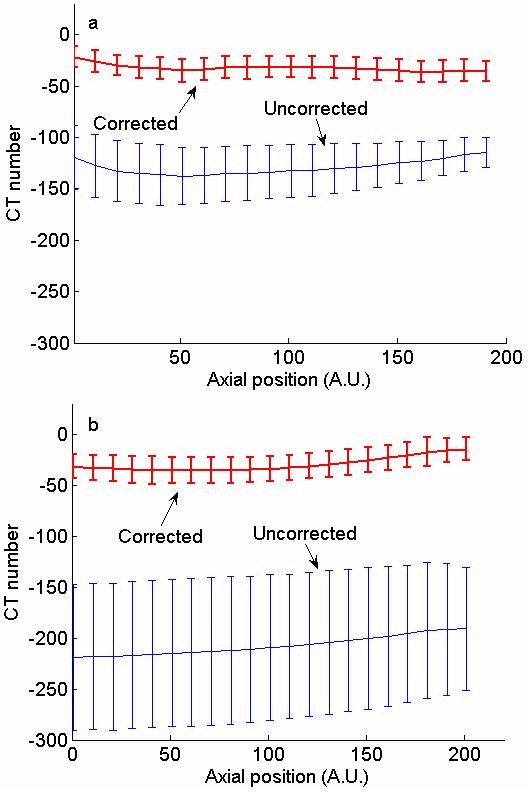
Means and standard deviations of adipose tissue CT numbers in axial slices of medium (a) and large size (b) specimens. Values are plotted as a function of position along the axial direction.
Table I.
Mean and standard deviation of adipose tissue CT numbers in axial breast mastectomy specimen CBCT images.
| Variation in mean value (CT #) | Variation in standard deviation (CT #) | |||
|---|---|---|---|---|
| Min | Max | Min | Max | |
| Medium size specimen | ||||
| Before correction | −136 | −116 | 16 | 31 |
| After correction | −36 | −21 | 10 | 10.5 |
| Large size specimen | ||||
| Before correction | −225 | −190 | 60 | 72 |
| After correction | −35 | −14 | 11 | 14 |
4. Discussion
A post-reconstruction technique to correct for cupping artifacts has been developed for CBCT images of mastectomy specimens. With this technique, cupping artifacts are assumed to be additive background signals in the reconstructed images and quantified by measuring the spatial variation of the adipose tissue CT numbers. Using this correction technique, we could reduce the cupping artifacts to a visually undetectable level, making it easier to adjust the gray scale window/level for proper display of the entire CBCT image. The quantitative accuracy of the CBCT data was also improved, making it possible to apply threshold based visualization techniques or quantitative studies.
As can be seen in Fig. 9 and Fig. 10, a threshold-based image segmentation could be inaccurate in differentiating between adipose and fibroglandular tissue without first correcting for the cupping artifacts. As shown in Fig. 10b, the standard deviation of the adipose tissue CT number can exceed 70 in an uncorrected axial image. Hence, the adipose tissue CT numbers in the central region of the specimen can be 140 units lower than those in the periphery. Given that the contrast difference between the adipose and dense tissues is about 150, the CT numbers of the dense tissue in the central region could be at a similar level as those of the adipose tissue in the periphery. However, after correction using our technique, the standard deviation of the adipose tissue signals could be reduced to around 14, allowing image segmentation to be accurately performed.
As our correction technique involves processing of the reconstructed images only, it does not require any prior calibration or hardware modifications for scatter signal measurements. Furthermore, empirically determined parameters such as order of the background fit are insensitive to the breast tissue size, composition, or x-ray technique settings. Thus, manual selection of a region-of-interest or threshold level is not required, allowing the correction to be performed with minimal user intervention.
Due to the simplicity of our technique, only modest computation power is required. First of all, the iterative background fits were performed on the one dimensional RATPs extracted from the axial images instead of the images themselves, leading to a significant reduction of the computation required. Moreover, the RATPs may be measured and sampled every several slices to generate the background fit coefficients for all axial slices. Background fit coefficients for skipped slices could be obtained by interpolation while smoothing the polynomial coefficients. This would further reduce the computation requirement without significantly affecting the accuracy of the correction.
In actual scanning situations, the central axis of the breast may not align well with the isocenter. To investigate the effect of this misalignment, we scanned cylindrical water phantoms placed off the rotating axis of the CBCT scanner. Despite the resulting asymmetric scatter distribution in the projection images, the correction technique still worked and could be used to reduce the cupping artifacts to an undetectable level both visually and quantitatively. A further concern was that since our cupping artifact correction technique is based on the analysis of the adipose tissue signals, it may not apply to very dense breasts. This may constitute a problem for a small fraction of breast tissues (∼10%) which appear very dense in mammograms27. To address this issue, the tissue sampling scheme and background fitting algorithm can be modified to create a second correction algorithm that exploits the nonuniformity in fibrogladular tissue signals. Although such a modification of the algorithm is trivial, it requires implementation of a selection step to decide on which algorithm to use depending on the dominant tissue type in the image data. Since none of the mastectomy specimens studied were classified as very dense, this issue needs to be investigated in future studies.
It should be noted that in addition to introducing a cupping bias, scattered radiation detected as part of the image signals also degrades the contrast sensitivity. The correction technique described in this paper is intended for improving uniformity of tissue signals but not for fully recovering the true CT numbers or the image contrast. With the correction technique described in this paper, the local contrast and noise level of the reconstructed images remain unchanged. A detailed discussion on effects of x-ray scatter on CT number accuracy can be found in 2.
Based on our initial experiences with cone beam breast CT, superior tissue contrast can be achieved while overlapping of tissue structures is eliminated. However, tumors are still detected and recognized on the basis of their distinctively different morphological appearance rather than on the contrast between dense tissues and tumors. Thus, volume visualization and segmentation techniques may become the key tools for detecting and recognizing tumors. However, the development of such techniques requires efficient gray scale thresholding of the image data, which may be hampered by the background nonuniformities associated with cupping artifacts. The correction technique reported here may improve the uniformity of the CBCT image data thus facilitating the development of accurate volume visualization and image segmentation techniques.
Acknowledgments
We would like to thank Wei Yang from the Department of Diagnostic Radiology and Aysegul Sahin from the Department of Pathology for their help on imaging mastectomy specimens, and Anant Gopal from Toshiba Stroke Research Center (Buffalo, NY) for discussions on the curve-fitting procedures. This work was supported in part by a research grant (CA104759) from the NIH-NCI and a research grant EB00117 from the NIH-NIBIB.
Appendix
Background trend fitting algorithm is explained in this section. For any given axial slice, the value of an RATP at ri can be approximated by an nth order background fit, Z(ri), and it is given as:
| (9) |
where pj(ri) is a polynomial of degree j. During the weighted least squares fit, the coefficients, cj’s, are determined iteratively by minimizing the error function, E:
| (10) |
where wi is a weighting factor assigned to R(ri). Each polynomial pj(ri) satisfies the following orthogonality condition:
| (11) |
where gk is a normalization constant. Also, each higher order polynomial may be obtained using the following recurrence relation:
| (12) |
where aj and bj are constants that depend on the polynomial order. aj, bj, and cj are calculated by applying the orthogonality condition in Eq. 8. For example, cj’s may be computed as follows:
| (13) |
Proper selection of wi’s is the key to achieving optimal background fitting. wi’s for points with background signals are selected to be higher than those for points with non-background signals as follows:
If R(ri) ≤ Z(ri) + m × rms then R(ri) is considered as a background point and
| (14a) |
Similarly, if R(ri) > Z(ri) + m × rms then R(ri) is considered as a non-background point and
| (14b) |
In Eqs. 14a and 14b, rms is calculated as follows:
| (15) |
where Nb is the number of all background points identified in the previous iteration, and f is the order of the polynomial. For the first iteration, since there is no previous iteration, the summation is operated on all points. In using Eqs. 14a and 14b to compute wi‘s, m needs to be determined empirically and we have set m to 2 to successfully minimize the effects of the non-background data points in the background fit. The iteration was repeated until E converged to a minimum value. Since the background signal trend in the RATPs was a slowly varying one, we employed second order polynomial for the fits. Higher-order polynomial fits were found to have little impact on the quality of the fit but result in oscillations near the end points.
The criteria for determining weighting factors in 14a and 14b is tailored where the the peaks appear as larger numbers with respct to background. The weighting criteria can also be modified to estimate a background hidden behind dips rather than peaks.
The method described above was also implemented to smooth the background fits in the axial direction. However, instead of directly smoothing the fitted background (adipose tissue) signals, the coefficients of the background fits were smoothed and then used to regenerate the background signal profile. Eqs. 9-15 can be easily modified to obtain a smoothed coefficient, ajsmooth(zl), from the original coeffient, aj (zl), by weighted least square fit as follows:
| (16) |
Unlike fitting the RATPs, the outlying data values could be either larger or smaller than the fitted value. Thus, the weighting scheme was modified as follows:
If > m·rms then aj (zl) is considered as a nonbackground point and
| (17a) |
Otherwise, ajsmooth(zl) is considered as a background point, and:
| (17b) |
The value of m was kept as two. Because the differential change in polynomial coefficients of the same order should be smooth and slowly varying along the z-axis, a third order polynomial was fit to each coefficient set. The background fits were then regenerated with smoothed coefficients.
References
- 1.Liu X, Shaw CC, Wang T, Chen L, Altunbas MC, Kappadath SC. An accurate scatter measurement and correction technique for cone beam breast CT imaging using scanning sampled measurement (SSM)technique. Medical Imaging 2006: Physics of Medical Imaging. 2006;6142:614234. doi: 10.1117/12.656655. [DOI] [PMC free article] [PubMed] [Google Scholar]
- 2.Siewerdsen JH, Jaffray DA. Cone-beam computed tomography with a flat-panel imager: magnitude and effects of x-ray scatter. Med Phys. 2001;28:220–231. doi: 10.1118/1.1339879. [DOI] [PubMed] [Google Scholar]
- 3.Siewerdsen JH, Moseley DJ, Bakhtiar B, Richard S, Jaffray DA. The influence of antiscatter grids on soft-tissue detectability in cone-beam computed tomography with flat-panel detectors. Med Phys. 2004;31:3506–3520. doi: 10.1118/1.1819789. [DOI] [PubMed] [Google Scholar]
- 4.Kwan AL, Boone JM, Shah N. Evaluation of x-ray scatter properties in a dedicated cone-beam breast CT scanner. Med Phys. 2005;32:2967–2975. doi: 10.1118/1.1954908. [DOI] [PubMed] [Google Scholar]
- 5.Bertram M, Wiegert J, Rose G. Potential of software-based scatter corrections in cone-beam volume CT. Medical Imaging 2005: Physics of Medical Imaging. 2005;5745:259–270. [Google Scholar]
- 6.Bertram M, Wiegert J, Rose G. Scatter correction for cone-beam computed tomography using simulated object models. Medical Imaging 2006: Physics of Medical Imaging. 2006;6142:61421C. [Google Scholar]
- 7.Jarry G, Graham SA, Jaffray DA, Moseley DJ, Verhaegen F. Scatter correction for kilovoltage cone-beam computed tomography (CBCT) images using Monte Carlo simulations. Medical Imaging 2006: Physics of Medical Imaging. 2006;6142:614254. [Google Scholar]
- 8.Suri RE, Virshup G, Zurkirchen L, Kaissl W. Comparison of scatter correction methods for CBCT. Medical Imaging 2006: Physics of Medical Imaging. 2006;6142:614238. [Google Scholar]
- 9.Rinkel J, Gerfault L, Esteve F, Dinten J-M. Evaluation of a physical based approach of scattered radiation correction in cone beam CT with an anthropomorphic thorax phantom. Medical Imaging 2006: Physics of Medical Imaging. 2006;6142:61421B. [Google Scholar]
- 10.Ning R, Tang X, Conover DL. X-ray scatter suppression algorithm for cone-beam volume CT. Medical Imaging 2002: Physics of Medical Imaging. 2002;4682:774–781. [Google Scholar]
- 11.Zhu L, Strobel N, Fahrig R. X-ray scatter correction for cone-beam CT using moving blocker array. Medical Imaging 2005: Physics of Medical Imaging. 2005;5745:251–258. [Google Scholar]
- 12.Cai W, Ning R, Conover D. Scatter correction using beam stop array algorithm for cone-beam CT breast imaging. Medical Imaging 2006: Physics of Medical Imaging. 2006;6142:61423E. [Google Scholar]
- 13.Siewerdsen JH, Daly MJ, Bakhtiar B, Moseley DJ, Richard S, Keller H, Jaffray DA. A simple, direct method for x-ray scatter estimation and correction in digital radiography and cone-beam CT. Med Phys. 2006;33:187–197. doi: 10.1118/1.2148916. [DOI] [PubMed] [Google Scholar]
- 14.Boone JM, Nelson TR, Lindfors KK, Seibert JA. Dedicated breast CT: radiation dose and image quality evaluation. Radiology. 2001;221:657–667. doi: 10.1148/radiol.2213010334. [DOI] [PubMed] [Google Scholar]
- 15.Chen B, Ning R. Cone-beam volume CT breast imaging: feasibility study. Med Phys. 2002;29:755–770. doi: 10.1118/1.1461843. [DOI] [PubMed] [Google Scholar]
- 16.Shaw C, Chen L, Altunbas M, Wang T, Lai C, Tu S, Liu X, Kappadath S. Imaging Properties of Cone Beam Breast CT- Effects of Detector Properties and Imaging Conditions(Abstract) Medical Physics. 2005;32:2064. [Google Scholar]
- 17.Yang W, Shaw C, Chen L, Altunbas C, Wang T, Lai C.-j., Kappadath C, Tu S.-j., Liu X, Whitman G. Cone beam breast CT: a feasibility study with surgical mastectomy specimens. 28th Annual San Antonio Breast Cancer Symposium; San Antonio, TX. 2006. [Google Scholar]
- 18.Gong X, Vedula AA, Glick SJ. Microcalcification detection using cone-beam CT mammography with a flat-panel imager. Phys Med Biol. 2004;49:2183–2195. doi: 10.1088/0031-9155/49/11/005. [DOI] [PubMed] [Google Scholar]
- 19.McKinley RL, Bryzmialkiewicz CN, Madhav P, Tornai MP. Investigation of cone-beam acquisitions implemented using a novel dedicated mammotomography system with unique arbitrary orbit capability. Medical Imaging 2005: Physics of Medical Imaging. 2005;5745:609–617. [Google Scholar]
- 20.Altunbas MC, Shaw C, Chen L, Wang T, Tu S. Effects of scattered radiation and beam quality on low contrast performance in cone beam breast CT. Medical Imaging 2006: Physics of Medical Imaging. 2006;6142:614236. [Google Scholar]
- 21.Feldkamp LA, Davis LC, Kress JW. Practical cone-beam algorithm. J. Opt. Soc. Am. 1984;1:612–619. [Google Scholar]
- 22.Steenstrup S. A simple procedure for fitting a background to a certain class of measured spectra. J. Appl. Cryst. 1981;14:226–229. [Google Scholar]
- 23.Pan X. A general approach for multidimensional smoothing. Med Phys. 1998;25:562–570. doi: 10.1118/1.598231. [DOI] [PubMed] [Google Scholar]
- 24.Anastasio MA, Pan X, Kao C-M. Multidimensional smoothing using orthogonal expansions. Signal Processing Letters, IEEE. 1999;6:91–94. [Google Scholar]
- 25.Gopal A, Hoffmann KR. Extraction and Reconstruction of Asymmetric Vessel Lumen in Radiographic Images Using Vessel Continuity (abstract) Med. Phys. 2003;301330 [Google Scholar]
- 26.Gonzales RC, Woods RE. Digital image processing. Addison-Wesley Publishing Co.; 1992. [Google Scholar]
- 27.Titus-Ernstoff L, Tosteson AN, Kasales C, Weiss J, Goodrich M, Hatch EE, Carney PA. Breast cancer risk factors in relation to breast density (United States) Cancer Causes Control. 2006;17:1281–1290. doi: 10.1007/s10552-006-0071-1. [DOI] [PMC free article] [PubMed] [Google Scholar]


