

Abstract
The most widely cited road block to successful treatment outcomes for psychological and substance use disorders has been described as the return to the previous behavior, or “relapse.” The operational definition of “relapse” varies from study to study and between clinicians, but in general the term is used to indicate the return to previous levels of symptomatic behavior. One explanation for the variation in the operationalization of relapse is the wide variety of behaviors for which the term is applied, including (but not limited to): depression, substance abuse, schizophrenia, mania, sexual offending, risky sexual behavior, dieting, and the anxiety disorders. A second explanation for the multitude of definitions for relapse is the inherent complexity in the process of behavior change. In this paper we present the most recent treatment outcome research evaluating relapse rates, with a special focus on the substance use disorders. Following this review of the literature we present an argument for the operationalization of relapse as a dynamic process, which can be empirically characterized using dynamical systems theory. We support this argument by presenting results from the analysis of alcohol treatment outcomes using catastrophe modeling techniques. These results demonstrate the utility of catastrophe theory in modeling the alcohol relapse process. The implications of these analyses for the treatment of alcohol use disorders, as well as a discussion of future research incorporating nonlinear dynamical systems theory is provided.
An inspection of the majority of treatment outcome studies will lead most individuals to two conclusions: 1) most active treatments (e.g., cognitive-behavior therapy; interpersonal psychotherapy, dialectical behavior therapy) generally are effective treatments for many psychological and substance use disorders; 2) most individuals who initially experience improved functioning following treatment will experience some backsliding to the return of pre-treatment behavior patterns within the first year after treatment. This high rate of relapse has led to the incorporation of relapse prevention as a component in most treatment manuals. Originally described as an aftercare program for individuals who received treatment for an alcohol use disorder (Marlatt & Gordon, 1985), the term relapse prevention has since been used as an umbrella term for any skills-based intervention that addresses relapse risk factors, risky situations, and effective coping responses. Focusing on the relapse process and relapse prevention marks the attempt to better understand the post-treatment process of change, including the question of why and how an individual may return to pre-treatment, problematic behavior.
In this paper we present the most recent treatment outcome research evaluating relapse rates following treatment for a variety of disorders, with a special focus on depression and substance use disorders. We then review the cognitive behavioral model of relapse, Marlatt’s (1978) original taxonomy of relapse precipitants, and more recent investigations of important relapse risk factors. Following this review of the literature we present an argument for the operationalization of relapse as a dynamic process, which can be empirically characterized using dynamical systems theory. To this end, we conducted analyses on the dynamic relationship between drinking outcomes and precipitants of relapse in a large group of participants who received inpatient and outpatient alcohol treatment (Project MATCH Research Group, 1997).
The Relapse Road Trip
One of the most challenging aspects of assessing treatment outcomes and relapse rates is the lack of consensus regarding the definition of “relapse.” In general, characterizations of relapse vary between researchers, clinicians, and, more importantly, among clients. The term has typically been used to indicate the return to previous levels of symptomatic behavior, but definitions range from: a dichotomous outcome based on a single transgression (Miller, 1996) to a continuous process defined by a series of transgressive behaviors (Larimer, Palmer, & Marlatt, 1999). Some have differentiated between lapse, relapse, and prolapse, to provide some indication of direction or severity of the transgression (Marlatt, 1996). A “lapse” has been defined as an initial set-back, whereas a “relapse” could be described as a more severe return to previous behavior, and a “prolapse” would indicate behavior that is consistent with getting back on track in the direction of positive behavior change. For example, in the sex offending literature stalking potential sex victims is considered a lapse, committing a sexual offense would be considered a relapse, and attending a session of Sex Addicts Anonymous or returning to therapy following a lapse would be considered a prolapse (Pithers, Marques, Gibat, & Marlatt, 1983; Wheeler, George, & Stoner, in press).
The ways in which clinicians quantify and qualify relapse may have major implications on the client’s attributions of their behavior, particularly when the term “relapse” is associated with failure. Furthermore, the quantification of relapse may influence the evaluation and determination of treatment outcomes. For example, many treatment centers define any drinking as a relapse; whereas other treatment centers define relapse as drinking an amount that is greater than 50% of the client’s pre-treatment drinking quantity (Miller, 1996). If a client from the first treatment center (any drinking = relapse) has one drink, then the client is likely to interpret that drink as a failure. This attribution of “blowing it” may actually increase the probability of heavier drinking behavior (a phenomenon called the abstinence violation effect) (Marlatt, 1985; Miller, 1996). However, if the same client received treatment from the second treatment center (drinking greater than 50% of pre-treatment drinking = relapse), then drinking one drink may increase the client’s awareness of their reactions to drinking, but is less likely to elicit the attribution of “blowing it.”
Characterizations of lapse and prolapse are often based on the definition of relapse. When relapse is defined as a single drink, then lapses may be defined as thinking about drinking or placing oneself in a risky situation; and a prolapse may be defined as any behavior that prevents continued drinking. These definitions represent an all-or-nothing approach. When relapse is defined by a certain quantity (e.g., 50% of baseline drinking) then a lapse may be defined as any number of drinks less than that quantity. Under these circumstances a prolapse may be characterized by the individual’s recognition of their drinking and attempts to reduce or stop their drinking. Prolapse is also defined by temporal factors, such as getting back on track as soon as possible at the end of a discrete drinking episode (e.g., one drink or a weekend binge). Lapse and relapse may be based on individual’s goals for change. If abstinence is the goal, then a drink may be considered a lapse; but if the individual maintains harm reduction goals, then a lapse may be defined as a harmful consequence that is related to drinking (e.g., missing work, fighting with spouse).
Regardless of how we define relapse, the treatment outcome literature clearly demonstrates that some transgression is the most common outcome following treatment for a variety of psychological and substance use disorders. For example, numerous follow-up studies have evaluated the role of cognitive-behavior therapy (CBT) in preventing relapse for obsessive compulsive disorders (Eisen et al., 1999; Franklin & Foa, 2002; Freeston & Ladouceur, 1997; Hiss, Foa, & Kozak, 1994); schizophrenia (Kane, 2003), bipolar disorder (Craighead, Miklowitz, Frank, & Vajk, 2002; Lam et al., 2003; Patelis-Siotis, 2001); panic disorder (Bruce, Spiegel, & Hegel, 1999); generalized anxiety disorder (Borkovec & Costello, 1993); and post-traumatic stress disorder (Taylor, Fedoroff, Koch, Thordarson, Fecteau, & Nicki, 2001). In the treatment of eating disorders relapse often occurs in more than 20% of patients who receive treatment (Agras et al., 2000; Fichter & Quadflieg, 1999; Halmi et al., 2002). Pike and colleagues (2003) demonstrated that CBT was more effective than nutritional counseling at preventing relapse following hospitalization for anorexia-nervosa, yet 22% of the CBT group relapsed (defined as losing weight below a BMI of 17.5, medical status requiring inpatient hospitalization, and suicidality). Halmi and colleagues (2002) found that 44% of bulimic patients who received CBT and achieved total remittance of binge eating and purging behavior relapsed within the first 4-months following treatment.
Several authors have looked at the rates of relapse following the treatment of depression (Lewinson, Zeiss, & Duncan, 1989; Paykel et al., 1999; Shea et al., 1992; Teasdale, Scott, Moore, Hayhurst, Pope & Paykel, 2001), with anywhere from 35 to 55% of patients experiencing a return of depressive symptoms (e.g., persistent negative mood, sleeping difficulties, interpersonal problems) within one year following treatment (Belsher & Costello, 1988; Klerman & Weissman, 1990; Quiring, Monroe, Simons, & Thase, 2002). Paykel and colleagues (1999) demonstrated that cognitive therapy led to lower relapse rates (29% relapsed), as compared to clinical management (47% relapsed) at 68 weeks following treatment. Teasdale and colleagues (2001) tested cognitive mediators of depressive symptomatology and found that cognitive behavior therapy may reduce patterns of negative thinking, which in turn reduces the probability of relapse. On the contrary, Gortner and colleagues (1998) demonstrated that CBT was not differentially effective in preventing relapse. Tang and DeRubeis (1999) investigated the individual variability in longitudinal course of depression and found that discontinuous, “sudden gains” following treatment were predicted from the effective implementation of CBT techniques. This study used a nonlinear model of the discontinuous changes in Beck Depression Inventory scores. This unique data analytic strategy may provide some explanation as to why the findings are discrepant from previous studies that looked solely at mediators using a linear modeling approach (Gortner et al., 1998; Teasdale et al., 2001).
Substance abuse researchers and clinicians have been particularly challenged with the objective of defining, measuring, and predicting relapse. In a review of addiction treatment outcome research De Leon (1993) states: “relapse is the rule” (p. 105), not the exception. The rates of relapse vary between studies and across substances, but the tendency to experience a lapse is the modal treatment outcome. For example, Hunt, Barnett, and Branch (1971) used survival curves to model relapse to drinking, smoking, and heroin use, demonstrating that an average of 65% of the sample drank, smoked, or used heroin within the first three months following treatment. Using the same relapse curves, Sutton (1979) maintained that 71% of the 35% who remained abstinent through three months also remained abstinent through 12 months post-treatment, indicating that the “increase in survival rate or probability of survival is not linear but slows down as length of abstinence increases” (p. 97).
In a seminal paper on relapse in addictive behaviors, Brownell and colleagues (1986) outlined relapse rates, precipitants, and prevention guidelines for all addictive behaviors. They highlighted the importance of thinking about the process of relapse and pointed to consideration of predispositions, immediate precipitants, and related consequences as predictors of relapse. Since the publication of this paper several researchers have explicitly studied the “relapse process” in all types of addictive behavior, including: cocaine treatment outcomes (McKay, Rutherford, Alterman, Cacciola, & Kaplan, 1995), heroin treatment outcomes (Gossop, 1989; Rawson, Obert, McCann, Marinelli-Casey, 1993), smoking cessation (Piasecki, Fiore, McCarthy, & Baker, 2002; Shiffman et al., 2000), marijuana treatment outcomes (Moore & Budney, 2003; Stephens, Roffman, & Simpson, 1994), methamphetamine treatment (Castro, Barrington, Walton, & Rawson, 2000), and alcohol treatment outcomes (Donovan, 1996; Hufford, Witkiewitz, Shields, Kodya, & Caruso, 2003; Marlatt, 1996).
It has been proposed that the path to and from dependence to different substances varies (Castro et al., 2000), but the relapse process may be highly similar across the different drugs of abuse (Brownell et al., 1986, Marlatt & Witkiewitz, 2005; Witkiewitz & Marlatt, 2004). For example, the focus on high-risk situations has been critical for understanding relapse to smoking (Cinciripini, Cinciripini, Wallfisch, Haque, & Vunakis, 1996; Curry, Gordon, & Marlatt, 1987), cocaine abuse (Carroll, Nich, Frankforter, & Bisighini, 1999), opioid abuse (Reilly et al., 1995), heroin abuse (Heather, Stallard, & Tebbutt, 1991), alcohol abuse (Annis, 1982; Chaney, O’Leary, & Marlatt, 1978), and marijuana abuse (Stephens, Wertz, & Roffman, 1995). Many clinicians and researchers have relied on the assessment of high-risk situations using the measures developed by Annis and colleagues (Annis, 1982). The Inventory of Drinking Situations (IDS; Annis, Graham, & Davis, 1987) and Inventory of Drug-Taking Situations (IDTS; Annis, Martin, & Graham, 1988) are used to assess an individual’s past history of risky situations and triggers for drinking and drugging. The Situation Confidence Questionnaire (SCQ; Annis & Graham, 1988) assesses the individual’s confidence in their ability to abstain from alcohol and drugs in a variety of potentially high-risk situations.
Even with these measures of high-risk situations, the prediction of lapses may be more complex than we would hope. When removed from the contexts provided by these questionnaires an individual may report being very confident about their ability to abstain, but the true test would have to occur in the real environment during a high-risk situation. For example, Curry and colleagues (1987) found that prospectively predicted attributions of smoking lapses in hypothetical situations were not significantly associated with the attributions for lapses during actual smoking episodes. These findings point to the importance of assessing baseline and post-treatment high-risk situations in conjunction with the assessment of non-situational relapse risk factors. Incorporating real time assessment techniques, such as ecological momentary assessment (EMA; Stone & Shiffman, 1994), will further researchers ability to monitor behavior in the real environment and provide a more complex understanding of the relapse process. For example in a study that used EMA, Shiffman and Waters (2004) demonstrated that negative affect in the days prior to a smoking lapse were not predictive of the lapse event, but negative affect steadily rises in the 6 hours prior to a smoking lapse. They also found that smoking lapses were often preceded by the combination of negative affect, stress, and arguing with another individual. In the author’s discussion of their findings, they state: “An argument can easily spring up in minutes and lead quickly to a lapse, without any advance build-up or predictability” (p. 198).
Relapse Risk Factors: The Potholes
In this section we review the Marlatt relapse taxonomy and the most commonly identified relapse precipitants. As described above, Marlatt (1978) gathered qualitative information from 70 male patients who experienced a relapse following treatment for an alcohol use disorder. Marlatt organized this information into two major categories and thirteen specific categories. The first category, Intrapersonal Determinants, includes all relapse risk factors that reside within the individual, including the subdivisions: coping with frustration and/or anger, coping with other negative emotional states, coping with physical states associated with prior substance use, coping with other negative physical states, enhancement of positive emotional states, testing personal control, giving in to temptations in the presence of substance cues, giving in to temptation in the absence of substance cues. The second category, Interpersonal Determinants, was used to describe any relapse risk factors that are interpersonal in nature. The subdivisions include coping with interpersonal conflict resulting in frustration and/or anger, coping with other interpersonal conflict, direct social pressure, indirect social pressure, enhancement of positive emotional states in an interpersonal situation (e.g., celebrations). Negative emotional states was the most commonly identified relapse situation in the initial sample of 70 patients (Marlatt, 1978) and is a common relapse predictor across most studies of relapse precipitants (e.g., Brandon, Tiffany, Obremski, & Baker, 1990; Cooney, Litt, Morse, Bauer, & Guapp, 1997; Hodgins, el Guebaly, & Armstrong, 1995; Litman, et al., 1983; Litt, Cooney, Kadden, & Gaupp, 1990; McKay, Rutherford, Alterman, Cacciola, & Kaplan, 1995; Shiffman, Paty, Gnys, Kassel, & Hickcox, 1996).
In addition to the relapse taxonomy, several authors have proposed relapse precipitant categorizations that incorporate the timing of the risk factor in relation to the transgressive behavior. Shiffman (1989) argued that distal risk factors in combination with intermediate background factors identify who will relapse, but not when the relapse will occur. The when is determined by proximal precipitating factors. Distal risk factors may include: family history of alcoholism, the nature and severity of the alcoholism, comorbid psychiatric and substance abuse diagnoses, impaired cognitive capabilities, or a tendency to be reactive towards alcohol-related cues (Donovan, 1996). Proximal risk factors may include: situational threats to self-efficacy, craving, social cue reactivity, affective states, stressful life events, the rapid deterioration of social support (e.g. loss of a friend), or acute psychological distress (Donovan, 1996).
Donovan (1996) followed this conceptualization and included transitional factors (e.g., abstinence violation effect), which influence the continuation of the transgressive behavior, after the initial lapse. More recently, Baker and colleagues (Baker et al., 2004; Piasecki, Fiore, McCarthy, & Baker, 2002) delineated two states of relapse proneness represented by tonic and phasic processes. Tonic processes indicate an underlying level of risk and phasic processes represent the dynamic precipitants to the transgressive behavior. In the next section we provide a complete picture of these relapse risk factors by applying a dynamical systems model to the relapse process. First we present the conceptual model of the relapse process as a dynamic system, as described by Witkiewitz and Marlatt (2004) and Hufford and colleagues (2003). Second we review the extant empirical evidence that lends support for the proposed model.
Relapse Process: In Motion
It has been proposed that the relapse risk factors described above are networked, dynamic, and multifaceted (Donovan, 1996; Marlatt, 1996; Shiffman, 1989; Witkiewitz & Marlatt, 2004). Building on previous descriptions of relapse as complex, Witkiewitz and Marlatt (2004) proposed a dynamic model of the relapse process. Shown in Figure 1, this model incorporates the temporal relationships between cognitive (self-efficacy, outcome expectancies, motivation, craving), behavioral (coping strategies), affective (depressed mood, anxiety, anger), and physical (withdrawal) processes leading up to and during a high-risk situation. According to the model, the inter-relationship between these processes is often contextual, but the driving force behind the processes may be traced back to an individual’s vulnerability to relapse.
Figure 1.
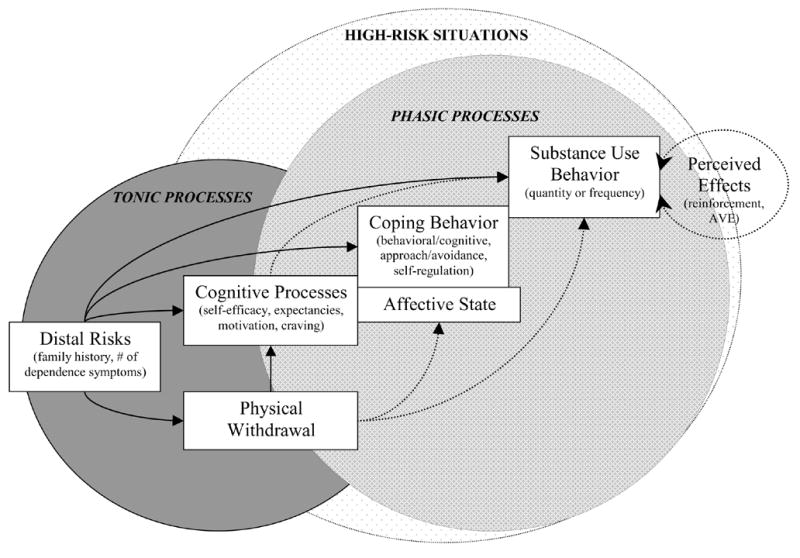
Dynamic model of relapse proposed by Witkiewitz and Marlatt (2004).
The source of support for the Witkiewitz and Marlatt (2004) model comes from clinical anecdotes and recent empirical studies on the complexity of substance use behavior. For example, Boker and Graham (1998) identified a linear oscillator in the development of adolescent substance abuse, indicating that periods of increased substance use alternate with periods of decreased substance use before leveling out at a more stable level of substance use. Piasecki and colleagues (2000) demonstrated that relapse to smoking is influenced by the severity, trajectory and variation in withdrawal symptoms. Warran and colleagues (2003) more accurately characterized daily variation in an individual’s alcohol intake using nonlinear time series analysis, as compared to linear modeling techniques. Hawkins and Hawkins (1998) collected data on one person’s alcohol intake over a 6 year period, which resulted in 2,000 data points. Analyses of these data revealed a periodic cycle in which the drinking trajectory changed in consistent, albeit discontinuous, ways.
These findings lead us to the hypothesis that relapse is a complex process that cannot be easily dissected by simple linear predictions. Seemingly insignificant changes in one risk factor (e.g., an undetected reduction in self-efficacy) may kindle a downward spiral of increased craving, positive outcome expectancies and intensified negative affect. These small changes may result in a major relapse, often initiated by a minor cue. The sheer disaster of a relapse crisis after an individual has been maintaining abstinence has bewildered patients, researchers, and clinicians for years. The symbolism of “falling from the wagon,” provides an illustration of the sudden, devastating experience of the chronic return to previous levels of abuse. This experience is often followed by the harsh realization that getting back on the wagon will not be as effortless as the fall from it.
We propose that researchers and clinicians have traditionally been unsuccessful at predicting most relapses because of the reliance on linear, continuous models of relapse precipitants and events, yet the process itself is more likely discontinuous. As an example consider an individual with a high level of distal risk, severity of dependence, and stress, who is able to maintain abstinence for the first 3 months following treatment for an alcohol use disorder. A continuous model of change would predict that this individual returns to drinking at a proportional rate to the change in relevant risk factors. This type of model would be unable to predict the sudden fall from the wagon, whereby a person returns to a high level of drinking subsequent to minor changes in risk. Discontinuous change, such as the discrepancy in this example, may be better estimated using an application of nonlinear dynamical systems theory, specifically catastrophe modeling.
Catastrophe theory is the study of sudden discontinuous change in a measured behavior resulting from slight continuous changes in the system parameters (Thom, 1975). Zeeman (1977) identified five essential qualities that suggest the presence of a catastrophe, (1) bimodality, the existence of two statistical modes or probable behaviors; (2) sudden transitions, where behavior may change rapidly between the two modes (e.g., movement from the top of the fold to the bottom); (3) divergence, a slight change in the control parameters can result in a substantial change in the expressed behavior; (4) hysteresis, the transitions from one mode of behavior to the other mode does not necessarily take place at the same point, therefore the same values of control parameters may not facilitate the same transition; and (5) inaccessibility, the finding that behavior is unlikely in the area between the two statistical modes of behavior.
The cusp catastrophe model, the most commonly applied form in the social sciences, includes three system parameters: two control parameters (called the splitting and normal parameters) and one behavioral parameter. The relationship between the control parameters and the behavioral parameter in the cusp catastrophe model can be represented by a dynamic system that continually seeks to optimize the cusp function (Stewart & Peregoy, 1983). The process of optimization introduces the concept of equilibrium, when, for fixed values of the control parameters, the behavior changes until it reaches a stable state. The critical points of interest are those that result in the system being in equilibrium. These points can be identified by setting the first derivative of the cusp function (V(Z)),
| (1) |
equal to zero:
| (2) |
where Z is the behavior, b is the splitting parameter, and a is the normal parameter. By substituting a range of values for the splitting (b) and normal (a) parameters, a range of values for Z is obtained and can be plotted in three dimensions, as shown in Figure 2. The bottom surface of the model, called the control plane, is defined by the range of the two control parameters. The top surface, called the behavior plane, is defined as the range of behavior values based on the values of the two control parameters (the values obtained when solving for Equation 2). The folded part of the behavior plane represents the discontinuity that is characteristic of the model, whereby two values of the control parameters can result in more than one value of the behavior variable. The two modes of behavior expression, labeled the bifurcation set, exist in a range of instability where major changes in drinking are controlled by minor shifts in the control parameters of Equation 2.
Figure 2.
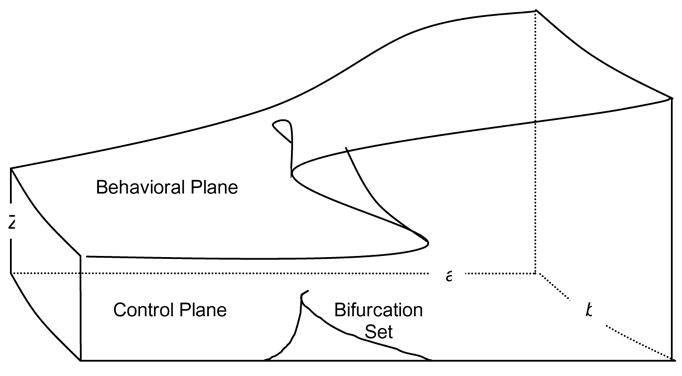
Canonical form of the cusp catastrophe model.
There are several ways to evaluate the applicability of the catastrophe model to an observed or measured behavior. One approach involves the analysis of the qualitative properties of the cusp catastrophe using “catastrophe flags” (Gilmore, 1981). Expanding on the work of Zeeman (1977), Gilmore (1981) proposed seven distinct properties of a cusp catastrophe: multimodality, inaccessibility, sudden jumps, hysteresis, anomalous variance, divergence of linear response, and critical slowing down. Catastrophe flag detection is essentially the qualitative review of previous empirical findings in search for evidence of these qualities of a cusp catastrophe.
The second approach to evaluating a catastrophe model is called stochastic catastrophe modeling, which involves the mathematical restructuring of the deterministic catastrophe equation (equation 1) into a model defined in probabilistic terms (Cobb, 1978). Using this approach, the surface of the cusp catastrophe model can be described by a prototypical probability density function, where the modes and “anti-modes” (i.e., lack of representation in the data) of the probability density function are analogous to the stable and unstable equilibrium states of the deterministic system. Stochastic catastrophe theory seeks to describe the most probable position of parameters in a deterministic system, thus the stochastic catastrophe can be thought of as a “snapshot” of the deterministic system at one point in time, based on one set of control parameters.
Catastrophe model of relapse
Using a metaphor of relapse provided by Brownell and colleagues (1986), several qualities of the cusp catastrophe can be illuminated.
A metaphor that describes traditional thought on relapse is of a person existing perilously close to the edge of a cliff. The slightest disruption can precipitate a fall from which there is no return. A person is always on the brink of relapse, ready to fall at any disturbance. There may be physiological, psychological, or social causes of the disturbance, but the outcome is just as final. The first slip creates momentum so that a complete relapse is certain (p. 776).
This metaphor accurately portrays the observation of the sudden transition from abstinence to pre-treatment levels of alcohol consumption that has been demonstrated in empirical investigations (Hore, 1971; Sutton, 1979). Treatment outcomes are so marked by sudden jumps that the cliché “fall off the wagon” has been used to describe the abrupt changes in drinking behavior following treatment (Miller, 1996). Likewise, Miller and C’de Baca (2001) identified that sudden gains often occur in recovery from alcohol problems.
The Brownell metaphor also introduces the concept of divergence, in their description of a person falling at any disturbance, implying that relatively small changes in physiological, psychological, and social factors can cause a dramatic change in drinking behavior. The quality of bimodality has been described by several researchers and clinicians, in that individuals tend to either remain abstinent or they return to heavy drinking (e.g., Hore, 1971; Marlatt & Gordon, 1985). Furthermore, once a person has taken a drink (a lapse) there are also two modal outcomes: individuals either return to heavy drinking (relapse) or they return to abstinence (prolapse) (Brownell, et al., 1986; Marlatt & Gordon, 1985; Shiffman, 1989).
Brownell and colleagues (1986) and others (Donovan, 1996; Marlatt, 1996a) have described the problem of traditional views of relapse not accounting for variations in the timing and causes of relapses. These variations are characterizations of hysteresis, which occurs when a sudden jump in the output (dependent) variable corresponds with different values of the input (independent) variable, depending on the direction of the change in the value of the input variable. For example, Hodgins and colleagues (1995) found that increases in negative emotions were related to large “major relapse” episodes, whereas decreases in negative emotions predicted light drinking episodes. Finally, the quality of inaccessibility is captured in the definition of a lapse, as a transitory state between abstinence and relapse. Individuals are not capable of staying within the lapse without returning to abstinence, controlled drinking, or falling off the wagon to heavy drinking (Marlatt & Gordon, 1985; Miller, 1996).
Recently, Hufford and colleagues (2003) utilized catastrophe theory in the prediction of alcohol relapse based on different combinations of relapse determinants. In two separate studies (Hufford, et al, 2003), a cusp catastrophe was used to model treatment outcomes in a small group of individuals who had received inpatient (n = 51) and outpatient (n = 43) substance abuse treatment. As shown in Figure 3, the control parameters were represented by linear composites of distal and proximal risk variables. In both studies, the distal risk variable was defined as a linear combination of family history of alcoholism, comorbid substance abuse, and severity of alcohol dependence; and the proximal risk variable was the linear combination of emotional states, self-efficacy, level of family conflict, and psychological distress. The dependent variable for both studies was based on the change in the frequency of drinking in the 30 days prior to intake to the 30 days prior to the 6-month follow-up. The catastrophe model with distal risk as the normal parameter and proximal risk as the splitting parameter provided an excellent fit to the data in the first sample (inpatient) and this model was replicated in the outpatient sample. In both samples a comparison linear model, which included all of the same parameters, provided a poor fit to the data.
Figure 3.
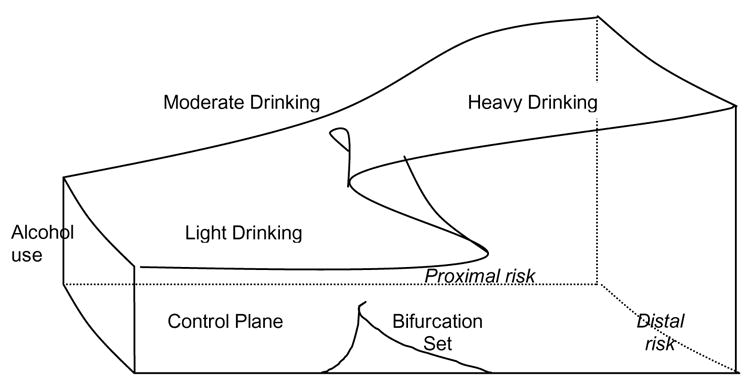
Cusp catastrophe model of relapse process.
The Hufford et al (2003) analyses provided preliminary support for the utility of catastrophe theory in modeling the relapse process; however these results need to be tempered by a number of limitations and methodological weakness of the two studies. As pointed out by the authors of the study, the small sample sizes and high attrition rates in both samples severely limits the generalizability of these findings to the total population. The authors suggested that future research replicate their findings with larger sample sizes and more advanced catastrophe modeling techniques (see Cobb, 1998; Oliva, Desarbo, Day, & Jedidi, 1987). Responding to these limitations of the Hufford et al. (2003) study, the current study presents two different methodologies for evaluating a catastrophe model using a much larger sample of individuals and a wider array of assessment measures and a longer follow-up.
Methods
Two approaches to evaluating the application of catastrophe theory to alcohol relapse were utilized in the current study. First, catastrophe flag detection (Gilmore, 1981) of previous empirical results was used to illustrate the specific predictions derived from catastrophe theory. Second, stochastic catastrophe models were estimated from existing alcohol treatment outcome data and compared to linear and logistic models. Data for the stochastic catastrophe analyses was taken from Project Matching Alcoholism Treatment to Client Heterogeneity (Project MATCH). Project MATCH was designed to test the hypothesis that certain client variables would predict differential response to three types of therapy. Participants (n = 1,726) were randomly assigned to one of three treatment modalities (Cognitive Behavioral, Twelve-Step Facilitation, or Motivation Enhancement) and received twelve weeks of highly controlled inpatient (n = 774) and outpatient treatment (n = 952). Follow-up assessments were conducted at 3, 6, 9, 12, and 15 months after the initial therapy session.
Catastrophe Flag Detection
Gilmore’s (1981) catastrophe flag detection methodology was used to access the qualities of the cusp catastrophe. The seven catastrophe flags: multimodality, inaccessibility, sudden jumps, hysteresis, anomalous variance, divergence of linear response, and critical slowing down; were evaluated by reviewing previous empirical studies of alcohol treatment outcomes
Stochastic Catastrophe Models
The stochastic catastrophe models were estimated using Cuspfit (Hartelman, 1997). Cuspfit (Hartelman, 1997) is an expanded version of Cobb’s Cusp Surface Analysis Program (CUSP; Cobb, 1978). CUSP is a stochastic method for fitting a cusp catastrophe surface, using a parameter estimation technique based on a multimodal probability density function. Cuspfit expands upon CUSP by fitting and comparing three different models: a linear model, logistic growth model, and a cusp catastrophe model. The parameters for the logistic and cusp models are estimated by maximizing the loglikehood of the actual data through multiple iterations (using a Quasi-Newton method). The linear, logistic, and cusp models are compared using Akaike’s Information Criterion (AIC) and the Bayes Information Criterion (BIC). The AIC is based on the loglikehood ratio and number of parameters, and the BIC is a function of the loglikehood, number of parameters, and sample size. Lower values of AIC and BIC indicate a better fit, with low BIC indicating a model that fits well and is more parsimonious.
One of the unique features of Cuspfit is the ability to enter up to five independent variables as control parameters. In addition, the user may impose up to five constraints on the model. For example if a cusp model was proposed in which two variables were theoretically consistent with the splitting parameter and one variable was theoretically consistent with the normal parameter, then the user could constrain these three variables to test this hypothesis. It is also possible to model the behavior with all independent variables constrained to zero, therefore testing the fit of a catastrophe model without control parameters influencing the shape or position of the cusp.
For the current study, two catastrophe models were estimated and compared to linear and logistic models. The linear and logistic models included distal and proximal risk factors as predictors of 12-month drinking. In the linear model, drinking was measured continuously. In the logistic model, dichotomized drinking scores were regressed on proximal and distal risk factors; the logistic model can be described as a parsimonious alternative to a cusp catastrophe model when the behavior is highly bimodal. The first catastrophe model (Cusp Model 1) provided a direct replication of the findings from Hufford et al. (2003), with distal risk constrained as the splitting parameter and proximal risk constrained as the normal parameter. In the second catastrophe model (Cusp Model 2), the proximal and distal risk factors were constrained to zero and the bimodality of the 12-month drinking behavior was evaluated without the influence of control parameters. If Cusp Model 2 fit the observed data as good, or better, than Cusp Model 1, then the importance of the proposed control parameters is challenged. In this case, we would conclude that the empirically defined proximal and distal risk factors were not influencing the bifurcation of drinking behavior.
Measures
For the stochastic catastrophe analyses the criterion variable (or behavioral parameter) was drinks per drinking day (DDD) in the 90-day period prior to the 12-month assessment using the Form-90 instrument (Miller & Del Boca, 1994). The predictor variables were empirically-derived composite scores representing proximal and distal risk factors. The composite scores were derived using principal components analysis (PCA). Six relapse determinants were entered into a PCA: (1) Self-efficacy, measured by the Alcohol Abstinence Self-Efficacy scale (AASE; DiClemente, et al., 1994); (2) negative affect, assessed by the Beck Depression Inventory (BDI; Beck, 1967); (3) psychological distress, measured with the Addiction Severity Index (ASI; McLellan, et al., 1983); (4) family history as measured by alcoholic typology (Litt & Babor, 2001); (5) family conflict, measured with the Social Support Questionnaire (SSQ; Sarason, Levine, Basham, & Sarason, 1983); and (6) alcohol dependence symptoms as measured by the Ethanol Dependence Syndrome Scale (EDSS; Babor, 1996). More information about these measures can be found in Project MATCH Research Group (1997).
The PCA resulted in two components with eigenvalues greater than 1.0 and varimax rotation was used to enhance the interpretability of the resulting components. The first component, called “proximal risk,” had sums of squared loadings for the first rotated component of 1.58 (26.2% of the variance) and the second component, called “distal risk,” had sums of squared loadings of 1.41 (23.5% of the variance). Consistent with previous conceptualizations of risk factors (Shiffman, 1989), alcohol dependence and typology had the highest loadings on the distal risk component, and self-efficacy, depression, family conflict and psychiatric severity had the highest loadings on the proximal risk component. The weighted component scores were used as the predictor variables in the tested models.
Results
Catastrophe Flag Detection
The seven catastrophe flags (Gilmore, 1981): multimodality, inaccessibility, sudden jumps, hysteresis, anomalous variance, divergence of linear response, and critical slowing down; were evaluated by reviewing previous empirical studies of alcohol treatment outcomes. In this section each catastrophe flag is illustrated and evidence supporting the presence of each flag in the evaluation of relapse is provided.
Multimodality and inaccessibility are characteristics of a catastrophe model that are most consistent with observed drinking behavior following treatment. Multimodality is indicated by the presence of more than one mode of the behavior based on specific values of the control parameters. One common characteristic of alcohol treatment outcome data is the presence of strong floor effects, where the majority of individuals at any one discrete time point are not drinking and the other mode is notoriously characterized by heavy drinking patterns (Hunt et al., 1971; Sutton, 1979).
Inaccessibility is similar to multimodality, but represents the anti-mode or the likelihood that a behavior will not be observed. Individuals with very low or very high risk often drink very heavily or remain abstinent and few individuals remain in a “lapsed” state. In fact the conceptual definitions of lapse and relapse do not allow for an individual to be in a stable lapse state (Witkiewitz & Marlatt, 2004). Witkiewitz (2004, 2005) used a type of person-centered analysis called latent growth mixture modeling to assess the within-person variability in drinking behavior during the 12-months following treatment. The results showed the majority of individuals (76%) returned to abstinence or light drinking following a light initial lapse (64%) or heavy initial lapse (12%). Only 13% of individuals maintained a moderate drinking pattern following the initial lapse, and within this group of individuals many returned to heavier drinking by the 12-month follow-up.
The sudden jump flag can only be demonstrated with time series data and individual growth curves with multiple time points. Although data of this type are rare, alcohol treatment outcomes are so marked by sudden jumps that the cliché “fall off the wagon” has been used to describe the abrupt changes in drinking behavior following treatment (Miller, 1996). Likewise, Miller and colleagues (2001) identified that sudden gains, described as “quantum changes,” often occur in recovery from alcohol problems.
Hysteresis may occur when a sudden jump in the dependent variable corresponds with different values of the independent variable, depending on the direction of the change in the value of the independent variable. For example, Hodgins and colleagues (1995) found that increases in negative emotions were related to large “major relapse” episodes, whereas decreases in negative emotions predicted light drinking episodes. Furthermore, the timing of depressive episodes in individuals with major depression has been shown to predict relapse following treatment for substance dependence (Hasin, Liu, Nunes, McCloud, Samet, & Endicott, 2002).
Anomalous variance is indicated by an increase in variance as the behavior becomes more bifurcated. Witkiewitz (2004) evaluated the variability in drinking frequencies in a sample of 563 individuals who were treated for alcohol dependence and followed for 12-months following treatment. Individuals classified as low-risk, based on a composite of risk factors, the variance in percentage of days abstinent was 448.77 and individuals classified as high-risk the variance in percentage of days abstinence was 1214.78. Thus, the variance in drinking behavior is much greater as the level of risk increases.
The divergence of linear response and critical slowing down catastrophe flags require data that includes a perturbation of the system. Evidence of divergence of linear response was demonstrated by Boker and Graham (1998) who investigated dynamic instability and self-regulation in the development of adolescent substance abuse showing relatively small changes feedback into the system and lead to large changes in substance abuse over a relatively short period of time. Critical slowing down can be demonstrated by looking at the pattern of changes in drinking behavior following treatment. For example, Hawkins and Hawkins (1998) present a case study of an individual’s alcohol intake over a 6-year period. Based on more than 2,000 data points analyses revealed a periodic cycle in which sudden shifts in drinking behavior were observed after periods of stability.
Stochastic Catastrophe Analyses (Cuspfit)
The primary goals of this analysis were to replicate the findings from the Hufford et al (2003) study using a much larger sample size, a longer follow-up, and an improved methodology for analyzing catastrophe models (Hartelman, 1997). Cuspfit was used to model the quantity of drinking (measured as the number of drinks per drinking day) based on configurations of proximal and distal risk factors following inpatient and outpatient alcohol treatment. A large percentage of participants (56% inpatient and 39% outpatient) were abstinent at the 12-month follow-up, and zero drinks per drinking day can be described as one of the modes of drinking behavior. In order to evaluate the role of proximal and distal risk factors as controlling the bimodality of drinking behavior, individuals who were not drinking at the 12-month follow-up were excluded from the analyses.1 As shown in Table 1, the Cusp Model 1, with proximal risk as the normal parameter and distal risk as the splitting parameter, provided the best fit to the data based on the AIC, BIC, and pseudo-R2. Both of the cusp catastrophe models provided a better fit to the observed data, as compared to the linear and logistic models.
Table 1.
Cusp Catastrophe Fit Statistics for Drinkers in the MATCH Sample (Excluding Abstainers)
| Treatment Group | Model | k | Likelihood | AIC | BIC | pseudoR2 |
|---|---|---|---|---|---|---|
| Outpatient | Linear | 4 | −712.10 | 1432.0 | 1449.0 | .08 |
| Logistic | 5 | −670.10 | 1350.0 | 1371.0 | .08 | |
| Cusp Model 1 | 6 | −538.40 | 1088.8 | 1113.9 | .38 | |
| Cusp Model 2 | 4 | −558.63 | 1125.3 | 1142.0 | .34 | |
|
|
||||||
| Inpatient | Linear | 4 | −405.50 | 813.0 | 833.6 | .06 |
| Logistic | 5 | −385.80 | 781.5 | 799.7 | .08 | |
| Cusp Model 1 | 6 | −325.99 | 664.0 | 685.8 | .16 | |
| Cusp Model 2 | 4 | −332.24 | 672.5 | 687.0 | .00 | |
Discussion
The findings from this study provide qualitative and quantitative support for the conceptualization of post-treatment drinking behavior as a cusp catastrophe. The qualitative characteristics of relapse as a catastrophe were supported by reviewing results from a variety of empirical studies. The stochastic catastrophe models fit much better than comparison linear and logistic models. A theoretically derived model of proximal and distal relapse risk factors, replicating the model proposed by Hufford et al. (2003), provided the best fit in a catastrophe model of post-treatment drinking quantity, when the model only included those individuals who were drinking. The models that included non-drinkers did not provide a better fit to the observed data when control parameters were added to the model. It is hypothesized that including non-drinkers creates a mode of zeros and under these circumstances the complexity and variation in drinking behavior is not actualized by the proposed risk factors. This finding demonstrates that models of the relapse process will not provide a complete description of the nonlinear dynamical process of post-treatment dinking if relapse is defined as a dichotomous event (e.g., drinking or abstaining). This finding also supports a conceptualization of treatment outcome that does not consider any drinking as a treatment failure, rather the complete, dynamic picture of the relapse process can be defined as a range of drinking outcomes. From a harm reduction perspective (Marlatt & Witkiewitz, 2002) alcohol treatment outcomes may be characterized by the severity of alcohol-related problems, not the specific quantity or frequency of drinking.
The relationship between specific risk factors and drinking in this sample of individuals who received three unique treatments (CBT, MET, and TSF) is of particular interest to treatment providers and clinical researchers. The Project MATCH researchers did not find differences in outcome between the three treatment types so treatment type was not used as a controlling variable in the current study, but future research should investigate the role of treatment type in a complex model of the relapse process. Given that CBT specifically targets self-efficacy, it is possible that the dynamic role of self-efficacy in predicting relapse (Shiffman et al., 2001) could be demonstrated in a catastrophe model of drinking outcomes following CBT. In this way, catastrophe modeling could be used as a method for testing dynamic mediation models. Morganstern and Longabaugh (2001) critically questioned the role of coping skills acquisition as a mediator of alcohol treatment outcomes following CBT, suggesting there was not strong evidence to support coping as a mechanism of action in CBT. Using different methods for the assessment of coping (see Carroll et al., 1999) and/or unique data analytic strategies might provide statistical support for the complex relationship between coping and treatment outcome that is often observed in practice (Buhringer, 2000).
There are several limitations with the current study. The Project MATCH data, while comprehensive and extensive, was not initially collected for the purposes of this study, and the hypotheses were necessarily limited by the availability of data. For example, a measure of coping was not assessed in the MATCH data and we were unable to evaluate the role of coping in modeling relapse. Currently we are running analyses using data that include a measure of coping and the preliminary findings suggest that coping is a significant parameter in a catastrophe model of drinking frequency. The overall limitations of the Project MATCH investigation are also applicable to this study, particularly the retrospective data collection and possibility of self-report biases. Unfortunately, the lack of collateral informants did not allow the MATCH researchers to examine the reliability of participant responses.
The Cuspfit program is currently the best available methodology for assessing the fit of a catastrophe model to observed data (van der Maas & Molenar, 1992), but it is not without limitations. Cuspfit does not provide the requisite information for statistical hypothesis testing. Even though certain models have better fit, as measured by BIC, they may not fit significantly better than comparison models. A second major limitation of Cuspfit is the inability to handle missing data. In the current study we used listwise deletion, such that any participant contributing any missing information is deleted from the analyses. Other investigators may chose to use an imputation procedure, such as multiple imputation (Schafer & Graham, 2002), which would allow for missing data to be generated by the relationships between the missing information and the full information available to the researcher.
Future research should continue to explicate the complex relationships between risk factors and post-treatment drinking outcomes found in the current study. The dynamical nature of relapse may be further studied by a dynamic time-series design, which would capture information about the movement of a person through the recovery process. Future studies could also incorporate other methods for estimating post-treatment outcomes (e.g., Ecological Momentary Assessment, see Stone & Shiffman, 1994) and different operationalizations of relapse risk factors (e.g., a role-play test to measure coping skills, see Carroll et al., 1999).
Ultimately, we may be able to determine which risk factors play a prominent role in predicting the complexity of relapse process. Explaining the interaction between relapse risk factors and post-treatment drinking using a dynamical analysis, such as catastrophe theory, may increase our ability to better target unique combinations of risk factors in clinical interventions. Based on the current findings, as well as the findings from Hufford and colleagues (2003), it appears that a higher level of distal risk at intake to treatment increases a client’s susceptibility to drastic differences in drinking behavior following treatment. If the client is high in distal risk, then the treatment provider may educate the client about the possibility of “falling from the wagon,” given small changes in proximal risks. Furthermore, relapse may be forestalled by targeting treatments to reduce a client’s level of proximal risk. Clients would benefit from skills training for managing lapses and encouragement to maintain lifestyle balance. When distal risk is low, clients can be educated about the probability of experiencing a steady increase in drinking that is proportional to increases in proximal risk. The client may be taught to monitor their proximal risks in conjunction with continuous monitoring of drinking, and be provided with skills for seeking support when proximal risks are on the rise.
Knowledge of the complex relationship between relapse and a particular risk factor will also guide future research and statistical analyses. Researchers may be able to design experiments specifically for the purpose of testing dynamic models of relapse. One of the most promising research designs for this purpose comes from the recent applications of ecological momentary assessment, in which each client is assessed in the moment on numerous (often greater than 100) occasions (see Shiffman et al., 2002; 2004). For these data and many other types of analysis a linear, continuous model may not be appropriate for modeling the relationship between risk factors and drinking behavior. The current study attempts to address this problem by examining the discontinuous relationship between risk factors and alcohol relapse. The ultimate goal of this inquiry is to provide clinicians and their clients with a heightened awareness of the roadblocks, speed traps, and other hazards operating within the often unpredictable relapse process.
Acknowledgments
This research was supported by grant R21 AA013942-01 from the National Institute of Alcohol Abuse and Alcoholism.
Footnotes
All analyses were also conducted with the entire sample of drinkers and non-drinkers. The cusp models provided a better fit than linear and logistic models based on lower AIC and BIC and the higher pseudo-R2 values. Pseudo- R2 is provided as a general measure of model fit that is calculated using the difference between observed values and the expected value of the nearest mode (Cobb, 1978). Interpretations of the Pseudo- R2 values need to be considered cautiously, because they are not like traditional interpretations of R2, in that the Pseudo- R2 does not equate to a measure of the amount variance explained by the model (Hartelman, 1997).
Publisher's Disclaimer: This is a PDF file of an unedited manuscript that has been accepted for publication. As a service to our customers we are providing this early version of the manuscript. The manuscript will undergo copyediting, typesetting, and review of the resulting proof before it is published in its final citable form. Please note that during the production process errors may be discovered which could affect the content, and all legal disclaimers that apply to the journal pertain.
References
- Agras WS, Crow SJ, Halmi KA, Mitchell J, Wilson T, Kraemer Outcome predictors for the cognitive behavioral treatment of bulimia nervosa: data from a multisite study. American Journal of Psychiatry. 2000;15:1302–1308. doi: 10.1176/appi.ajp.157.8.1302. [DOI] [PubMed] [Google Scholar]
- Annis HM. Inventory of Drinking Situations. Toronto, Canada: Addiction Research Foundation; 1982. [Google Scholar]
- Annis HM, Graham JM. Situational Confidence Questionnaire (SCQ) Toronto: Addiction Research Foundation; 1988. [Google Scholar]
- Annis HM, Graham JM, Davis CS. Inventory of Drinking Situations (IDS) user’s guide. Addiction Research Foundation; Toronto, Ontario: 1987. [Google Scholar]
- Annis H, Martin G, Graham JM. Inventory of Drug–Taking Situations: Users’ guide. Addiction Research Foundation; Toronto, Ontario: 1992. [Google Scholar]
- Babor T. Reliability of the ethanol dependence syndrome scale. Psychology of Addictive Behaviors. 1996;10(2):97–103. [Google Scholar]
- Baker TB, Piper ME, McCarthy DE, Majeskie MR, Fiore MC. Addiction motivation: An affective processing model of negative reinforcement. Psychological Review. 2004;111:33–51. doi: 10.1037/0033-295X.111.1.33. [DOI] [PubMed] [Google Scholar]
- Beck AT. Depression Inventory. Philadelphia: Center for Cognitive Therapy; 1978. [Google Scholar]
- Belsher G, Costello CG. Relapse after recovery from unipolar depression: A critical review. Psychological Bulletin. 1988;104:84–96. doi: 10.1037/0033-2909.104.1.84. [DOI] [PubMed] [Google Scholar]
- Boker SM, Graham J. A dynamical systems analysis of adolescent substance abuse. Multivariate Behavioral Research. 1998;33(4):479–507. doi: 10.1207/s15327906mbr3304_3. [DOI] [PubMed] [Google Scholar]
- Borkovec TD, Costello E. Efficacy of applied relaxation and cognitive-behavioral therapy in the treatment of generalized anxiety disorder. Journal of Consulting and Clinical Psychology. 1993;61:611–619. doi: 10.1037//0022-006x.61.4.611. [DOI] [PubMed] [Google Scholar]
- Brandon TH, Tiffany ST, Obremski KM, Baker TB. Postcessation cigarette use: the process of relapse. Addictive Behaviors. 1990;15:105–114. doi: 10.1016/0306-4603(90)90013-n. [DOI] [PubMed] [Google Scholar]
- Brownell KD, Marlatt GA, Lichtenstein E, Wilson GT. Understanding and preventing relapse. American Psychologist. 1986;41:765–782. doi: 10.1037//0003-066x.41.7.765. [DOI] [PubMed] [Google Scholar]
- Bruce TJ, Spiegel DA, Hegel MT. Cognitive-behavioral therapy helps prevent relapse and recurrence of panic disorder following alprazolam discontinuation: A long-term follow-up of the Peoria and Dartmouth studies. Journal of Consulting and Clinical Psychology. 1999;67(1):151–156. doi: 10.1037//0022-006x.67.1.151. [DOI] [PubMed] [Google Scholar]
- Buhringer G. Testing CBT mechanisms of action: Humans behave in a more complex way than our treatment studies would predict. Addiction. 2000;95(11):1715–1716. [PubMed] [Google Scholar]
- Burgess ES, Brown RA, Kahler CW, Niaura R, Abrams DB, Goldstein MG, Miller IW. Patterns of change in depressive symptoms during smoking cessation: Who’s at risk for relapse? Journal of Consulting & Clinical Psychology. 2002;70(2):356–361. doi: 10.1037//0022-006X.70.2.356. [DOI] [PMC free article] [PubMed] [Google Scholar]
- Burling TA, Reilly PM, Molten JO, Ziff DC. Self-efficacy and relapse among inpatient drug and alcohol abusers: A predictor of outcome. Journal of Studies on Alcohol. 1989;50(4):354–360. doi: 10.15288/jsa.1989.50.354. [DOI] [PubMed] [Google Scholar]
- Burns DD, Nolen-Hoeksema S. Coping styles, homework compliance, and the effectiveness of cognitive-behavioral therapy. Journal of Consulting and Clinical Psychology. 1991;59(2):305–311. doi: 10.1037//0022-006x.59.2.305. [DOI] [PubMed] [Google Scholar]
- Carroll KM, Nich C, Frankforter TL, Bisighini RM. Do patients change in the ways we intend? Assessing acquisition of coping skills among cocaine-dependent patients. Psychological Assessment. 1999;11(1):77–85. [Google Scholar]
- Castro FG, Barrington EH, Walton MA, Rawson RA. Cocaine and methamphetamine: Differential addiction rates. Psychology of Addictive Behaviors. 2000;14(4):390–396. [PubMed] [Google Scholar]
- Chaney ER, O’Leary MR, Marlatt GA. Skill training with alcoholics. Journal of Consulting and Clinical Psychology. 1978;46:1092–1104. doi: 10.1037//0022-006x.46.5.1092. [DOI] [PubMed] [Google Scholar]
- Cinciripini P, Cinciripini L, Wallfisch A, Haque W. Behavior therapy and the transdermal nicotine patch: effects on cessation outcome, affect, and coping. Journal of Consulting and Clinical Psychology. 1996;64:314–323. doi: 10.1037//0022-006x.64.2.314. [DOI] [PubMed] [Google Scholar]
- Cobb L. Stochastic catastrophe models and multimodal distributions. Behavioral Science. 1978;23:360–374. [Google Scholar]
- Cobb L. An Introduction to Cusp Surface Analysis. Carbondale, CO: Aetheling; 1998. [Google Scholar]
- Cooney NL, Litt MD, Morse PA, Bauer LO, Gaupp L. Alcohol cue reactivity, negative-mood reactivity, and relapse in treated alcoholic men. Journal of Abnormal Psychology. 1997;106:243. doi: 10.1037//0021-843x.106.2.243. [DOI] [PubMed] [Google Scholar]
- Craighead WE, Miklowitz DJ, Frank E, Vajk FC. Psychosocial treatments for bipolar disorder. In: Nathan P, Gorman J, editors. A guide to treatments that work. 2. 2002. pp. 263–275. [Google Scholar]
- Curry S, Marlatt GA, Gordon JR. Abstinence violation effect: Validation of an attributional construct with smoking cessation. Journal of Consulting and Clinical Psychology. 1987;55:145–149. doi: 10.1037//0022-006x.55.2.145. [DOI] [PubMed] [Google Scholar]
- De Leon G. What psychologists can learn from addiction treatment research. Psychology of Addictive Behaviors. 1993;7(2):103–109. [Google Scholar]
- DiClemente CC, Carbonari JP, Montgomery RPG, Hughes SO. The Alcohol Abstinence Self-Efficacy scale. Journal of Studies on Alcohol. 1994;55(2):141–148. doi: 10.15288/jsa.1994.55.141. [DOI] [PubMed] [Google Scholar]
- Donovan DM. Marlatt’s classification of relapse precipitants: Is the Emperor still wearing clothes? Addiction. 1996;91(Suppl):131–137. [PubMed] [Google Scholar]
- Eisen JL, Goodman WK, Keller MB, Warshaw MG, DeMarco LM, Luce DD, Rasmussen SA. Patterns of remission and relapse in obsessive-compulsive disorder: A 2-year prospective study. Journal of Clinical Psychiatry. 1999;60(5):346–351. doi: 10.4088/jcp.v60n0514. [DOI] [PubMed] [Google Scholar]
- Fichter MM, Quadflieg N. Six-year course and outcome of anorexia nervosa. International Journal of Eating Disorders. 1999;26(4):359–385. doi: 10.1002/(sici)1098-108x(199912)26:4<359::aid-eat2>3.0.co;2-7. [DOI] [PubMed] [Google Scholar]
- Franklin ME, Foa EB. Cognitive behavioral treatments for obsessive compulsive disorder. In: Nathan P, Gorman J, editors. A guide to treatments that work. 2. 2002. pp. 367–386. [Google Scholar]
- Freeston MH, Ladouceur R. What do patients do with their obsessive thoughts? Behaviour Research & Therapy. 1996;35(4):335–348. doi: 10.1016/s0005-7967(96)00094-0. [DOI] [PubMed] [Google Scholar]
- Gilmore R. Catastrophe theory for scientists and engineers. New York: Wiley; 1981. [Google Scholar]
- Gortner ET, Gollan JK, Dobson KS, Jacobson NS. Cognitive-behavioral treatment for depression: Relapse prevention. Journal of Consulting and Clinical Psychology. 1998;66:377–384. doi: 10.1037//0022-006x.66.2.377. [DOI] [PubMed] [Google Scholar]
- Gossop M. Relapse and addictive behavior. London: Tavistock/Routledge; 1989. [Google Scholar]
- Guastello SJ. Chaos, catastrophe, and human affairs: Applications of nonlinear dynamics to work, organizations, and social evolution. Mahwah, NJ: Lawrence Erlbaum; 1995. [Google Scholar]
- Halmi KA, Agras WS, Mitchell J, Wilson GT, Crow S, Bryson SW, et al. Relapse predictors of patients with bulimia nervosa who achieved abstinence though cognitive behavioral therapy. Archives of General Psychiatry. 2002;59:1105–1109. doi: 10.1001/archpsyc.59.12.1105. [DOI] [PubMed] [Google Scholar]
- Hartelman P. Unpublished doctoral dissertation. University of Amsterdam: 1997. Stochastic catastrophe theory. [Google Scholar]
- Hasin D, Liu XH, Nunes E, McCloud S, Samet S, Endicott J. Effects of major depression on remission and relapse of substance dependence. Archives of General Psychiatry. 2002;59:375–380. doi: 10.1001/archpsyc.59.4.375. [DOI] [PubMed] [Google Scholar]
- Hawkins RC, Hawkins CA. Dynamics of substance abuse: implications of chaos theory for clinical research. In: Chamberlain L, Butz MR, editors. Clinical chaos: a therapist’s guide to nonlinear dynamics and therapeutic change. Philadelphia, PA: Brunner/Mazel; 1998. pp. 89–101. [Google Scholar]
- Heather N, Stallard A, Tebbutt J. Importance of substance cues in relapse among heroine users: comparison of two methods of investigation. Addictive Behaviours. 1991;16:41–49. doi: 10.1016/0306-4603(91)90038-j. [DOI] [PubMed] [Google Scholar]
- Hiss H, Foa E, Kozak MJ. Relapse prevention for treatment of obsessive-compulsive disorder. Journal of Consulting and Clinical Psychology. 1994;62(4):801–808. doi: 10.1037//0022-006x.62.4.801. [DOI] [PubMed] [Google Scholar]
- Hodgins DC, el Guebaly N, Armstrong S. Prospective and retrospective reports of mood states before relapse to substance use. Journal of Consulting and Clinical Psychology. 1995;63:400–407. doi: 10.1037//0022-006x.63.3.400. [DOI] [PubMed] [Google Scholar]
- Hodgson R. Coping skills and Tiger Woods. Addiction. 2000;95:1716–1717. [PubMed] [Google Scholar]
- Hore BD. Factors in alcoholic relapse. British Journal of Addiction. 1971;66:89–96. doi: 10.1111/j.1360-0443.1971.tb02371.x. [DOI] [PubMed] [Google Scholar]
- Hufford MH, Witkiewitz K, Shields AL, Kodya S, Caruso JC. Applying nonlinear dynamics to the prediction of alcohol use disorder treatment outcomes. Journal of Abnormal Psychology. 2003;112(2):219–227. doi: 10.1037/0021-843x.112.2.219. [DOI] [PubMed] [Google Scholar]
- Hunt WA, Barnett LW, Branch LG. Relapse rates in addiction programs. Journal of Clinical Psychology. 1971;27:455–456. doi: 10.1002/1097-4679(197110)27:4<455::aid-jclp2270270412>3.0.co;2-r. [DOI] [PubMed] [Google Scholar]
- Kane JM. Long-term treatment of schizophrenia: Moving from a relapse-prevention model to a recovery model. Journal of Clinical Psychiatry. 2003;64(11):1384–1385. [Google Scholar]
- Lam DH, Watkins ER, Hayward P, Bright J, Wright K, Kerr N. A randomized controlled study of cognitive therapy for relapse prevention for bipolar affective disorder. Archives of General Psychiatry. 2003;60:145–152. doi: 10.1001/archpsyc.60.2.145. [DOI] [PubMed] [Google Scholar]
- Larimer ME, Palmer RS, Marlatt GA. Relapse prevention: An overview of Marlatt’s cognitive-behavioral model. Alcohol Research and Health. 1999;23:151–160. [PMC free article] [PubMed] [Google Scholar]
- Lewinsohn PM, Zeiss AM, Duncan EM. Probability of relapse after recovery from an episode of depression. Journal of Abnormal Psychology. 1989;98(2):107–116. doi: 10.1037//0021-843x.98.2.107. [DOI] [PubMed] [Google Scholar]
- Litman GK, Stapleton J, Oppenheim AN, Peleg M. An instrument for measuring coping behaviors in hospitalized alcoholics: implications for relapse prevention and treatment. British Journal of Addiction. 1983;78:269–276. doi: 10.1111/j.1360-0443.1983.tb02511.x. [DOI] [PubMed] [Google Scholar]
- Litt MD, Babor TF. Alcoholic typology as an attribute for matching clients to treatment: Results from Project MATCH. In: Longabaugh R, Wirtz P, editors. Project MATCH Hypotheses: Results and Causal Chain Analyses Project MATCH Monograph Series Volume 8 DHHS Pub No.(01-4238) Rockville, MD: US Government Printing Office; 2001. [Google Scholar]
- Litt MD, Cooney NL, Morse P. Reactivity to alcohol-related stimuli in the laboratory and in the field: Predictors of craving in treated alcoholics. Addiction. 2000;95(6):889–900. doi: 10.1046/j.1360-0443.2000.9568896.x. [DOI] [PubMed] [Google Scholar]
- Marlatt GA. Craving for alcohol, loss of control, and relapse: A cognitive-behavioral analysis. In: Nathan PE, Marlatt GA, Loberg T, editors. New directions in behavioral research and treatment. New Brunswick, NJ: Rutgers Center of Alcohol Studies; 1978. pp. 271–314. [Google Scholar]
- Marlatt GA. Taxonomy of high-risk situations for alcohol relapse: Evolution and development of a cognitive-behavioral model of relapse. Addiction. 1996;91(Suppl):37–50. [PubMed] [Google Scholar]
- Marlatt GA, Gordon JR. Relapse prevention: Maintenance strategies in the treatment of addictive behaviors. New York: Guilford; 1985. [Google Scholar]
- Marlatt GA, Witkiewitz K. Harm reduction approaches to alcohol use: Health promotion, prevention, and treatment. Addictive Behaviors. 2002;27 (6):867–886. doi: 10.1016/s0306-4603(02)00294-0. [DOI] [PubMed] [Google Scholar]
- Marlatt GA, Witkiewitz K. Relapse prevention for alcohol and drug problems. In: Marlatt GA, Donovan DD, editors. Relapse Prevention. 2. New York: Guilford; 2005. pp. 1–44. [Google Scholar]
- McKay JR, Rutherford MJ, Alterman AI, Cacciola JS, Kaplan MR. An examination of the cocaine relapse process. Drug and Alcohol Dependence. 1995;38(1):35–43. doi: 10.1016/0376-8716(95)01098-j. [DOI] [PubMed] [Google Scholar]
- Miller WR. What is relapse? Fifty ways to leave the wagon. Addiction. 1996;91(Suppl):15–27. [PubMed] [Google Scholar]
- Miller WR, C’de Baca J. Quantum change: When epiphanies and sudden insights transform ordinary lives. New York: Guilford Press; 2001. [Google Scholar]
- Miller WR, Del Boca FK. Measurement of drinking behavior using the Form-90 family of instruments. Journal of Studies on Alcohol. 1994;(Supplement No 12):112–118. doi: 10.15288/jsas.1994.s12.112. [DOI] [PubMed] [Google Scholar]
- Moore BA, Budney AJ. Relapse in outpatient treatment for marijuana dependence. Journal of Substance Abuse Treatment. 2003;25(2):85–89. doi: 10.1016/s0740-5472(03)00083-7. [DOI] [PubMed] [Google Scholar]
- Morganstern J, Longabaugh R. Cognitive-behavioral treatment for alcohol dependence: A review of evidence for its hypothesized mechanisms of action. Addiction. 2000;95(10):1475–1490. doi: 10.1046/j.1360-0443.2000.951014753.x. [DOI] [PubMed] [Google Scholar]
- Oliva TA, Desarbo WS, Day DL, Jedidi K. GEMCAT: A general multivariate methodology for estimating catastrophe models. Behavioral Science. 1987;32:121–137. [Google Scholar]
- Patelis-Siotis I. Cognitive-behavioral therapy: Applications for the management of bipolar disorder. Bipolar Disorders. 2001;3(1):1–10. doi: 10.1034/j.1399-5618.2001.030101.x. [DOI] [PubMed] [Google Scholar]
- Paykel ES, Scott J, Teasdale JD, Johnson AL, Garland A, Moore R, Jenaway A, Cornwall PL, Hayhurst H, Abbott R, Pope M. Prevention of relapse in residual depression by cognitive therapy: A controlled trial. Archives of General Psychiatry. 1999;56:829–835. doi: 10.1001/archpsyc.56.9.829. [DOI] [PubMed] [Google Scholar]
- Piasecki TM, Fiore MC, McCarthy D, Baker TB. Have we lost our way? The need for dynamic formulations of smoking relapse proneness. Addictions. 2002;97 (9):1093–1108. doi: 10.1046/j.1360-0443.2002.00216.x. [DOI] [PubMed] [Google Scholar]
- Piasecki TM, Niaura R, Shadel WG, Abrams D, Goldstein M, Fiore MC, Baker TB. Smoking withdrawal dynamics in unaided quitters. Journal of Abnormal Psychology. 2000;109:74–86. doi: 10.1037//0021-843x.109.1.74. [DOI] [PubMed] [Google Scholar]
- Pike K, Walsh T, Vitousek K, Wilson GT, Bauer J. Cognitive behavior therapy in the posthospitalization treatment of anorexia nervosa. American Journal of Psychiatry. 2003;160:2046–2049. doi: 10.1176/appi.ajp.160.11.2046. [DOI] [PubMed] [Google Scholar]
- Pithers WD, Marques JK, Gibat CC, Marlatt GA. Relapse prevention with sexual aggressives: A self-control model of treatment and maintenance of change. In: Greer JG, Stuart IR, editors. The sexual aggressor: Current perspectives on treatment. New York: Van Nostrand Reinhold; 1983. pp. 214–239. [Google Scholar]
- Project MATCH Research Group. Matching alcoholism treatment to client heterogeneity: Post-treatment drinking outcomes. Journal of Studies on Alcohol. 1997;58:7–29. [PubMed] [Google Scholar]
- Rawson RA, Obert JL, McCann MJ, Marinelli-Casey P. Relapse prevention strategies in outpatient substance abuse treatment. Psychology of Addictive Behaviors. 1993;7(2):85–95. [Google Scholar]
- Reilly PM, Sees KL, Shopshire MS, Hall SM, Delucchi KL, Tusel DJ, et al. Self-efficacy and illicit opioid use in a 180 day methadone detoxification treatment. Journal of Consulting & Clinical Psychology. 1995;63(1):158–162. doi: 10.1037//0022-006x.63.1.158. [DOI] [PubMed] [Google Scholar]
- Sarason IG, Levine HM, Basham RB, Sarason BR. Assessing Social Support: The Social Support Questionnaire. Journal of Personality and Social Psychology. 1983;44(1):127–139. [Google Scholar]
- Schafer JL, Graham JW. Missing data: our view of the state of the art. Psychological Methods. 2002;7:147–177. [PubMed] [Google Scholar]
- Shea MT, Elkin I, Imber SD, Sotsky FM, Watkins JT, Collins JF, Pilkonis PA, Beckham E, Glass R, Dolan RT, Parloff MB. Course of depressive symptoms over follow-up: Findings from the NIMH Treatment of Depression Collaborative Research Program. Archives of General Psychiatry. 1992;49:782–787. doi: 10.1001/archpsyc.1992.01820100026006. [DOI] [PubMed] [Google Scholar]
- Shiffman S. Conceptual issues in the study of relapse. In: Gossop M, editor. Relapse and addictive behavior. London: Routledge; 1989. pp. 149–179. [Google Scholar]
- Shiffman S, Balabanis M, Paty J, Engberg J, Gwaltney C, Liu K, et al. Dynamic effects of self-efficacy on smoking lapse and relapse. Health Psychology. 2000;19:315–323. doi: 10.1037//0278-6133.19.4.315. [DOI] [PubMed] [Google Scholar]
- Shiffman S, Paty JA, Gnys M, Kassel JD, Hickox M. First lapses to smoking: Within subjects analysis of real time reports. Journal of Consulting and Clinical Psychology. 1996;2:366–379. doi: 10.1037//0022-006x.64.2.366. [DOI] [PubMed] [Google Scholar]
- Shiffman S, Waters AJ. Negative affect and smoking lapses: A prospective analysis. Journal of Consulting and Clinical Psychology. 2004;72:192–201. doi: 10.1037/0022-006X.72.2.192. [DOI] [PubMed] [Google Scholar]
- Sklar SM, Annis HM, Turner NE. Group comparisons of coping self-efficacy between alcohol and cocaine abusers seeking treatment. Psychology of Addictive Behaviors. 1999;13(2):123–133. [Google Scholar]
- Somerfield MR, McCrae RR. Stress and coping research: Methodological challenges, theoretical advances, and clinical applications. American Psychologist. 2000;55(6):620–625. [PubMed] [Google Scholar]
- Stephens RS, Wertz JS, Roffman RA. Self-efficacy and marijuana cessation: A construct validity analysis. Journal of Consulting and Clinical Psychology. 1995;63:1022–1031. doi: 10.1037//0022-006x.63.6.1022. [DOI] [PubMed] [Google Scholar]
- Stewart IN, Peregoy PL. Catastrophe theory modeling in psychology. Psychological Bulletin. 1983;94:336–362. [Google Scholar]
- Stone AA, Shiffman S. Ecological momentary assessment (EMA) in behavioral medicine. Annals of Behavioral Medicine. 1994;16(3):199–202. [Google Scholar]
- Sutton SR. Interpreting relapse curves. Journal of Consulting and Clinical Psychology. 1979;47:96–98. doi: 10.1037//0022-006x.47.1.96. [DOI] [PubMed] [Google Scholar]
- Tang TZ, DeRubeis RJ. Reconsidering rapid early response in cognitive behavioral therapy for depression. Clinical Psychology: Science and Practice. 1999;6:283–288. doi: 10.1037//0022-006x.67.6.894. [DOI] [PubMed] [Google Scholar]
- Taylor S, Fedoroff I, Koch W, Thordarson D, Fecteau G, Nicki R. Posttraumatic stress disorder arising after road traffic collisions: Patterns of response to cognitive behavior therapy. Journal of Consulting and Clinical Psychology. 2001;69(3):541–551. [PubMed] [Google Scholar]
- Teasdale JD, Scott J, Moore RG, Hayhurst H, Pope M, Paykel ES. How does cognitive therapy prevent relapse in residual depression? Evidence from a controlled trial. Journal of Consulting and Clinical Psychology. 2001;69:347–357. doi: 10.1037//0022-006x.69.3.347. [DOI] [PubMed] [Google Scholar]
- Thom R. In: Stabilité structurelle et morphogenèse (Structural stability and morphogenesis) Fowler H, translator. Reading; Benjamin: 1975. [Google Scholar]
- van der Maas H, Molenaar P. A catastrophe-theoretical approach to cognitive development. Psychological Review. 1992;99:395–417. doi: 10.1037/0033-295x.99.3.395. [DOI] [PubMed] [Google Scholar]
- Warran K, Hawkins RC, Sprott JC. Substance abuse as a dynamical disease: Evidence and clinical implications of nonlinearity in a time series of daily alcohol consumption. Addictive Behaviors. 2003;28:369–374. doi: 10.1016/s0306-4603(01)00234-9. [DOI] [PubMed] [Google Scholar]
- Wheeler JG, George WH, Stoner SA. Enhancing the relapse prevention model for sex offenders: Adding recidivism risk reduction therapy to target offenders’ dynamic risk needs. In: Marlatt GA, Donovan DD, editors. Relapse Prevention. 2. New York: Guilford Publications; 2005. [Google Scholar]
- Witkiewitz K, Hufford MR, Caruso JC, Shields AS. Increasing the prediction of alcohol relapse using catastrophe theory: Findings from Project MATCH; Poster session presented at the annual meeting of the Association for the Advancement of Behavior Therapy; Reno, NV. 2002. Nov, [Google Scholar]
- Witkiewitz K. Predicting Alcohol Relapse Using Nonlinear Dynamics and Growth Mixture Modeling. Unpublished Doctoral Dissertation,; University of Washington: 2004. [Google Scholar]
- Witkiewitz K. Defining relapse from a harm reduction perspective. Journal of Evidence-Based Social Work. 2005;2 (1):191–206. [Google Scholar]
- Witkiewitz K, Marlatt GA. Relapse prevention for alcohol and drug problems: That was zen, this is tao. American Psychologist. 2004;59(4):224–235. doi: 10.1037/0003-066X.59.4.224. [DOI] [PubMed] [Google Scholar]
- Zeeman EC. Catastrophe theory. Scientific American. 1977;234:65–83. [Google Scholar]