Abstract
During G2 phase of cell cycle, centrosomes function as a scaffold for activation of mitotic kinases. Aurora-A is first activated at late G2 phase at the centrosome, facilitates centrosome maturation, and induces activation of cyclin B-Cdk1 at the centrosome for mitotic entry. Although several molecules including HEF1 and PAK are implicated in centrosomal activation of Aurora-A, signaling pathways leading to Aurora-A activation at the centrosome, and hence mitotic commitment in vertebrate cells remains largely unknown. Here, we have used Clostridium difficile toxin B and examined the role of Rho GTPases in G2/M transition of HeLa cells. Inactivation of Rho GTPases by the toxin B treatment delayed by 2 h histone H3 phosphorylation, Cdk1/cyclin B activation, and Aurora-A activation. Furthermore, PAK activation at the centrosome that was already present before the toxin addition was significantly attenuated for 2 h by the addition of toxin B, and HEF1 accumulation at the centrosome that occurred in late G2 phase was also delayed. These results suggest that Rho GTPases function in G2/M transition of mammalian cells by mediating multiple signaling pathways converging to centrosomal activation of Aurora-A.
INTRODUCTION
During the G2/M transition cells undergo dramatic morphological and biochemical changes to prepare for cell division. The most prominent changes during this phase are centrosome maturation and separation, chromosome condensation, and cell rounding (Palazzo et al., 2000; Belmont, 2006; Théry and Bornens, 2006). The centrosome starts to mature in late G2 phase, accumulating γ-tubulin and other pericentriolar components and increasing its size and microtubule-nucleating activity (Palazzo et al., 2000). Recent studies have demonstrated that the centrosome plays an essential role during this period in the activation of mitotic kinases including Aurora-A and Cdk1 that regulate the commitment of cells to mitosis. As the centrosome matures, the active cyclin B1-Cdk1 complex first appears at the centrosome and then spread throughout the whole cell, suggesting that the centrosome provides a scaffold for activation of this kinase complex (Jackman et al., 2003). Aurora-A is first activated at late G2 phase at the centrosome, facilitates centrosome maturation, and induces activation of cyclin B-Cdk1 at the centrosome to trigger the G2/M progression (Hirota et al., 2003). Several studies implicated molecules including Ajuba (Hirota et al., 2003), HEF1 (Pugacheva and Golemis, 2005), and PAK1 (Zhao et al., 2005) in centrosomal activation of Aurora-A. Aurora-A is then targeted to and activated at the spindle by another molecule, TPX2 (Tsai et al., 2003; Eyers et al., 2003; Bayliss et al., 2003). However, signaling pathways controlling Aurora-A activation at the centrosome and hence mitotic commitment in vertebrate cells remain largely unknown.
Rho GTPases, including Rho, Rac, and Cdc42, are activated from the inactive GDP-bound form to the active GTP-bound form in response to both extra- and intracellular stimuli. The active Rho GTPases act on the downstream effectors such as PAK, ROCK, N-WASP, and mDia and regulate both reorganization of the actin cytoskeleton and local dynamics of microtubules. Through these cytoskeletal actions Rho GTPases regulate many cellular functions including cell adhesion, cell migration, and cell cycle progression (Etienne-Manneville and Hall, 2002). In cell division, Rho GTPases have long been thought to regulate only cytokinesis. However, several recent studies demonstrated that Rho GTPase signaling pathways also regulate mitosis in addition to cytokinesis (Narumiya and Yasuda, 2006). For example, Cdc42 and its effector mDia3 regulate chromosomal segregation in HeLa cells (Yasuda et al., 2004). Oceguera-Yanez et al. (2005) further reported that Ect2 and MgcRacGAP regulate the activation and function of Cdc42 in this process. Bakal et al. (2005) found that the Rho GEF Lfc promotes spindle assembly through Rho in other cell lines. However, the role of Rho GTPases in earlier phases of mitosis, particularly in progression from G2 to M phase, remains unknown.
Rho GTPases now comprise more than 20 members, and they often work redundantly to compensate for the loss of others. Such redundant functions of Rho GTPases are, for example, seen among Cdc42-related GTPases in mitosis (Yasuda et al., 2006). This is one reason that makes the study on the role and function of Rho GTPases in mitosis difficult as we discussed (Narumiya and Yasuda, 2006). To overcome this difficulty and to examine the involvement of these GTPases, we often use Clostridium difficile toxin B (Aktories and Barbieri, 2005). Toxin B is a mono-glucosyltransferase that utilizes UDP-glucose and transfers its glucose moiety onto the Rho GTPase at a critical threonine residue located in the Switch-I region. This glucosylation prevents Rho GTPases from association with its effectors and consequently blocks the downstream signal transduction pathways. Substrate specificity of toxin B is restricted to the Rho subfamily GTPases, and all members of this subfamily such as Rho, Rac, and Cdc42 are glucosylated. Here, we have used toxin B and examined the roles of Rho GTPases in G2/M progression by biochemical and immunocytochemical analysis. We now show that Rho GTPases are essential for centrosome maturation, mitotic kinase activation, and the G2/M progression in HeLa cells.
MATERIALS AND METHODS
Reagents
Antibodies to Aurora-A, Cdc42, phosphoThr288-Aurora-A, and phosphoTyr15-Cdk1 were from Cell Signaling Technology (Beverly, MA). Antibodies to phosphoSer10-histone H3, Rac1 (clone 23A8), cyclin B1, and phosphoThr423-PAK1/phosphoThr402-PAK2 were from Upstate Biotechnology (Lake Placid, NY). Monoclonal antibodies to β-tubulin (clone D66) and mAb to γ-tubulin (clone GTU-88), propidium iodide, protease inhibitor cocktail, and cytochalasin D were from Sigma (St. Louis, MO). Antibodies to Cdk1 (C-19), Cdc25A (F-6), RhoA (26C4), and Cdc25C (C-20) were from Santa Cruz Biotechnology (Santa Cruz, CA). mAb to HEF1 (2G9) and rabbit antiserum to HEF1 were as described previously (Pugacheva and Golemis, 2005). Alexa Fluor 488 goat anti-mouse IgG, Alexa Fluor 488 goat anti-rabbit IgG, Alexa Fluor 594 anti-mouse IgG, Alexa Fluor 594 anti-rabbit IgG, rhodamine-conjugated phalloidin, and 4′, 6-diamino-2-phenylindole-dihydrochloride (DAPI) were from Molecular Probes (Eugene, OR). Uridine diphospho-d-[U-14C]glucose (304 mCi/mmol) and [γ-32P]ATP (3000 Ci/mmol) were obtained from GE Healthcare UK Limited (Amersham Place, England). C. difficile toxin B was a gift from Klaus Aktories (Albert-Ludwigs-University Freiburg). Y-27632 and hesperadine were from Calbiochem (La Jolla, CA) and Boehringer Ingelheim (Ridgefield, CT), respectively. Botulinum C3 exoenzyme was prepared as described (Morii et al., 1995).
Cell Culture and Cell Cycle Synchronization and Treatment with Toxins and Drugs
HeLa cells were grown in DMEM (Invitrogen, Carlsbad, CA) supplemented with 10% fetal bovine serum (Equitech-Bio, Kerrville, TX) at 37°C in an atmosphere containing 10% CO2. Synchronization of cell cycle was performed by the double-thymidine block method with modification as described previously (Yasuda et al., 2004). In brief, HeLa cells were plated either in a six-well culture dish or in a 100-mm dish at densities as indicated. After 12-h culture, the cells were incubated with the culture medium containing 10 mM thymidine for 24 h (the first block). The cells were then washed three times with phosphate-buffered saline (PBS) and were cultured for 10 h in the culture medium (the first release). The medium was then replaced again with the culture medium containing 10 mM thymidine, and the cells were cultured for 14 h (the second block). The cells were then washed free of thymidine as described above and transferred to the culture medium (the second release). The cells were treated either with toxin B, C3 exoenzyme, cytochalasin D, or Y-27632 during culture after the second release. Toxin B, cytochalasin D, and Y-27632 were added to the culture at 50 ng/ml, 4 μM, and 10–50 μM, respectively, 8 h after the release and the cell cycle progression was followed in the continued presence of these compounds. Incorporation of C3 exoenzyme into the cells was carried out by electropermeation. HeLa cells were seeded onto a 100-mm culture dish (Iwaki, Tokyo, Japan) at a density of 5.0 × 10⁵ cells per dish and subjected to the double thymidine block as described. At 6.5 h after the second release, the cells were washed, incubated with PBS for 20 min at 37°C, and dissociated by extensive pipetting. Cells were collected by centrifugation and resuspended in OPTI-MEM at a density of 2 × 10⁵ cells/ml. C3 exoenzyme was added to the cell suspension at a final concentration of 50 μg/ml. A 300-μl aliquot of the suspension was transferred into a cuvette with an electrode distance of 0.4 cm, and a single pulse of current (300 V, 960 mF, 100 Ω) was applied at room temperature with a Gene Pulser System (Bio-Rad, Richmond, CA). The cells were plated in a well of a six-well culture dish (Iwaki) or that containing a collagen-coated coverslip (BD Biosciences, San Jose, CA) and cultured in DMEM supplemented 10% fetal calf serum.
In Vitro Glucosylation Assay
HeLa cells treated either with or without toxin B (50 ng/ml) were scraped with a rubber policeman at various times after the second release from 100-mm dish cultures. The cells were washed with ice-cold PBS five times, and centrifuged. Cell pellet was then resuspended in 400 μl of a reaction buffer (50 mM triethanolamine/HCl, pH 7.5, 150 mM KCl, 2 mM MgCl2, 0.5 mM GDP, 0.1 mM dithiothreitol, protease inhibitor cocktail), and disrupted by sonification (1 s, five times on ice), followed by centrifugation for 10 min at 1000 × g. The supernatant (2 mg/ml protein) was used as cell lysate. HeLa cell lysates (70 μg protein) were incubated with 10 μg/ml toxin B in the presence of 30 μM UDP-[14C]glucose (375 nCi) at 37°C for 1 h in a total volume of 50 μl. After incubation, 15 μl of 4× Laemmli sample buffer was added, and the proteins were separated by 15% SDS-PAGE. The gel was dried and subjected to autoradiography with a Kodak BioMax MS Film (Eastman Kodak, Rochester, NY).
Flow Cytometric Analysis
For analysis of DNA content by flow cytometry, HeLa cells were seeded into a 100-mm culture dish (Iwaki) at a density of 5.0 × 10⁵ per dish and subjected to the double thymidine block as described above. The cells were trypsinized at indicated times after the second release, washed twice with PBS, and then fixed in 70% ice-cold ethanol. After keeping at −20°C for at least 2 h, the cells were washed with PBS twice and resuspended in 2 ml of PBS containing 40 μg/ml propidium iodide and 100 μg/ml RNase A. The suspension was then applied to flow cytometric analysis on an EPICS XL-MCL system and EXPO32 ADC Analysis software (Beckman Coulter, Fullerton, CA).
Immunoblotting
HeLa cells were seeded into a six-well culture dish (Iwaki) at a density of 0.8 × 10⁵ cells per well 12 h before the first thymidine block. At various times after the second release, cells were washed once with PBS and lysed in 300 μl of Laemmli sample buffer. Ten or 20 μl of the cell lysates (∼20–40 μg protein) was then subjected to SDS-PAGE, and separated proteins were transferred to a nitrocellulose membrane. The membrane was blocked with a blocking buffer containing 5% skim milk (Invitrogen) in Tris-buffered saline (TBS; 100 mM Tris-HCl, pH 7.5, and 150 mM NaCl) for 1 h at room temperature. Primary antibodies were diluted in the blocking buffer and the following were added: 1:500 dilutions for antibodies to phosphoThr288-Aurora-A and Cdk1; 1:1000 dilutions for antibodies to phosphoTyr15-Cdk1, phosphoSer10-histone H3, Aurora-A, HEF1 (2G9), Cdc25A and Cdc25C; and 1:200 dilutions for antibodies to β-tubulin and cyclin B1. After overnight incubation at 4°C with these primary antibodies except for incubation at room temperature for 1.5 h with the antibody to phosphoSer10-histone H3, the membranes were washed three times with TBS containing 0.05% Tween-20. The bound primary antibodies were detected with corresponding horseradish peroxidase–conjugated secondary antibodies (GE Healthcare Bio-Sciences, Piscataway, NJ; 1:1000 dilution in the blocking buffer) and ECL Western Blotting Detection System (GE Healthcare Bio-Sciences).
Immunofluorescence
HeLa cells were seeded on a collagen-coated coverslip (BD Biosciences) at a density of 0.6 × 10⁵ cells per well in a six-well culture dish (Iwaki) and subjected to the double thymidine block as described above. At indicated times after the second release, cells were fixed. For staining for phosphoThr288-Aurora-A, γ-tubulin, and HEF1, cells were fixed in cold methanol for 5 min at −20°C. For HEF1 staining, cells were pretreated with 0.5% Triton X-100 in PHEM buffer (60 mM PIPES, 25 mM HEPES, 10 mM EGTA, and 2 mM MgCl2, titrated to pH 6.9 with potassium hydroxide) for 5 min at 37°C before fixation. For staining for phosphoSer10-histone H3, phosphoThr402-PAK2, and cyclin-B1, cells were fixed with 4% formaldehyde (Polysciences, Warrington, PA) for 20 min at 37°C and permeabilized with 0.5% [vol/vol] Triton X-100 in PBS. Blocking was carried out by incubation of fixed cells with PBS containing 3% bovine serum (the blocking buffer) at room temperature for 1 h. The cells were incubated overnight at 4°C with primary antibodies diluted in the blocking buffer: 1:200 dilutions for antibodies to phosphoThr288-Aurora-A, cyclin B, and phosphoThr402-PAK2; 1:300 dilutions for antibodies to phosphoSer10-histone H3 and γ-tubulin; and 1:100 dilution for antiserum to HEF1. The cells were then stained with corresponding Alexa Fluor 488 or Alexa Fluor 594 secondary antibodies diluted to 1:200 in the blocking buffer and DAPI (1 μg/ml) for 1 h at room temperature. Samples were observed under a Leica AS MDW microscopy (Leica, Deerfield, IL), at room temperature, with a 10× (HC PL FLUOTAR; NA 0.3), a 63× (HCX PL APO; NA 1.3), or a 100× (HCL PL APO; NA 1.4) objective lens. Images were acquired with the Leica AS MDW software (Leica).
Kinase Assay
HeLa cells were lysed with a cell lysis buffer (50 mM Tris-HCl, pH 7.5, 250 mM NaCl, 0.1% NP-40, 5 mM EDTA, 50 mM NaF, 0.8 mM dithiothreitol, 50 mM β-glycero-phosphate, 25 mM α-naphthyl acid phosphate, 80 μM Na3VO4, and a protease inhibitor cocktail [Sigma]). Cell lysates were centrifuged at 10,000 × g for 15 min, and supernatants were collected. The supernatants (∼600 μg protein) were incubated with 4 μl of antibody to cyclin B1 for 2 h at 4°C and then with 30 μl protein G–conjugated beads (GE Healthcare Bio-Sciences) for another 2 h at 4°C. Immunoprecipitates were then recovered and incubated with 10 μg of histone H1 and 100 μM [γ-32P]ATP (1 μCi) in a reaction buffer (50 mM Tris-HCl, pH 7.5, 12 mM MgCl2, 0.8 mM dithiothreitol, 50 mM β-glycero-phosphate, 25 mM α-naphthyl acid phosphate, and 80 μM Na3VO4) in a total volume of 50 μl for 15 min at 30°C. Reactions were terminated by the addition of 25 μl of the 3× Laemmli sample buffer. After boiling, a 20-μl aliquot of the samples was subjected to SDS-PAGE and to autoradiography with BAS-5000 (Fuji Film, Tokyo, Japan).
RESULTS
Toxin B Treatment Interferes with Mitotic Entry of HeLa Cells
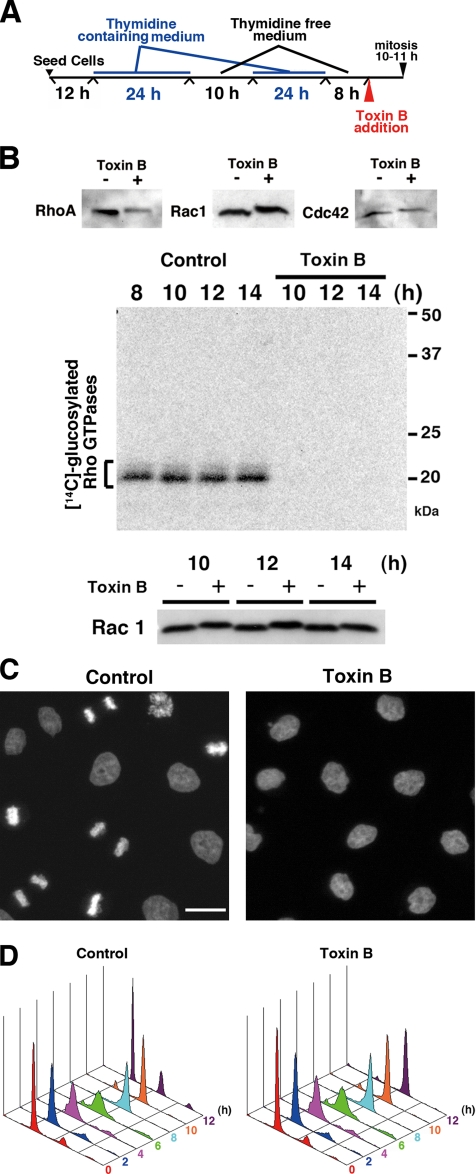
We previously showed that treatment with toxin B affects spindle formation, when the toxin is added to HeLa cells enriched in the prometaphase of mitosis (Yasuda et al., 2004). We wondered whether the addition of toxin B affects progression through other phases of the cell cycle such as the G2/M progression. To test this hypothesis, we synchronized the cell cycle of HeLa cells in early S phase using the double-thymidine block method and added toxin B to the medium 8 h after the second release, a time when most cells passed through S (Figure 1, A and D). In 1–1.5 h after the toxin addition, HeLa cells rounded up, indicating that the toxin had inactivated Rho GTPases (Just et al., 1995). This was confirmed by immunoblot analysis for Rho GTPases, in which RhoA, Rac1, and Cdc42 showed the slower mobility in the toxin B–treated cells, and by the loss of substrates for in vitro glucosylation with toxin B in the lysates of toxin B–treated cells (Figure 1B). As shown by these analyses, this glucosylation appeared irreversible, at least within the time of the present experiment. When cells treated with or without the toxin were then fixed and stained with DAPI 12 h after the second release, i.e., 4 h after the toxin addition, control cells exhibited various mitotic figures, suggesting that they had entered mitosis during this period. On the other hand, the toxin B–treated cells exhibited no mitotic figures, although they showed partially condensed chromosomes in their nuclei (Figure 1C). Flow cytometry after propidium iodide staining showed that the cells passed through S and entered the G2 at 8 h after the second release, and a significant number of control cells reached G1 phase at 12 h. However, the toxin B–treated cells remained as 4N cells even 12 h after the release (Figure 1D). These results indicate that the toxin B treatment prevented or delayed mitotic entry of HeLa cells from G2.
Figure 1.
Inhibition of G2/M progression by toxin B treatment. (A) Experimental protocol. (B) Modification of Rho GTPases by toxin B treatment. Top, HeLa cells were collected 10 h after the second thymidine release, i.e., after 2-h treatment with or without toxin B, and subjected to immunoblot analysis for RhoA, Rac, and Cdc42. Middle and bottom, HeLa cells treated with or without toxin B were collected at indicated times after the release and subjected to the in vitro glucosylation assay (middle) and immunoblot analysis for Rac1 (bottom). Note that no in vitro glucosylation occurred in the toxin B pretreated cells (top), that the toxin B treatment induced mobility shift of Rho GTPases, and that these changes persisted in the period examined. (C) DAPI staining of control and toxin B–treated cells 12 h after the release. Synchronized HeLa cells were stained with DAPI for DNA after treatment with or without 50 ng/ml toxin B for 4 h. Note that control cells showed various mitotic figures, whereas toxin B–treated cells exhibited partially condensed chromosomes. Bar, 10 μm. (D) Flow cytometry for cell cycle progression of control and toxin B–treated cells. HeLa cells were synchronized and treated according to the protocol shown in A, collected at indicated times after the second release and subjected to flow cytometry after staining with propidium iodide.
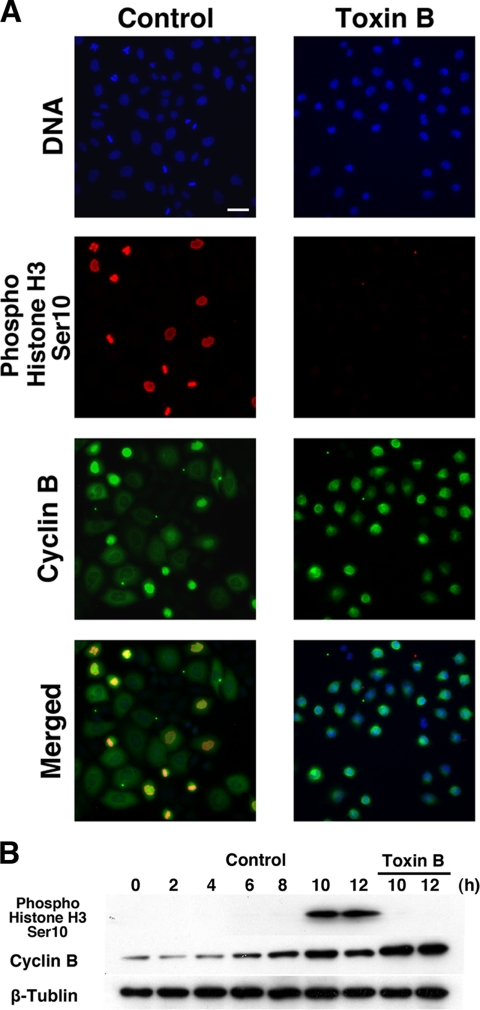
To clarify which step in the G2/M progression is affected by the toxin B treatment, we first examined Ser10-phosphorylation of histone H3. Histone H3 is phosphorylated at Ser10 at M-phase and this phosphorylation correlates with DNA condensation in mammalian cells and is used as a marker of mitotic entry (Prigent and Dimitrov, 2003). Synchronized HeLa cells were treated with toxin B as described above, fixed 10 h after the second release, and subjected to immunofluorescence for Ser10-phosphorylated histone H3. At 10 h, control cells had entered mitosis, and a significant number of the cells showed the phosphoSer10-histone H3 staining, whereas virtually none of the cells treated with toxin B showed the signal (Figure 2A). We then prepared cell lysates for immunoblotting. The lysates of the control cells showed the band corresponding to phosphoSer10-histone H3 10 and 12 h after the second release. However, no band was detected in the lysates of the toxin B–treated cells at these times (Figure 2B). These results suggest that toxin B interferes with a step at or before Ser10-phosphorylation of histone H3.
Figure 2.
Effects of toxin B treatment on histone H3 Ser10 phosphorylation and cyclin B expression. (A) Immunofluorescence for histone H3 Ser10 phosphorylation and cyclin B in control and toxin B–treated HeLa cells. Toxin B was added to the culture 8 h after the second release, and cells were fixed at 10 h and stained for histone H3 Ser10 phosphorylation (red), cyclin B (green), and DNA (blue). Typical results of three independent experiments are shown. Bar, 10 μm. (B) Immunoblot analysis for histone H3 Ser10 phosphorylation and cyclin B. HeLa cells were collected every 2 h from 0 to 12 h after the second release, and lysates were prepared and subjected to immunoblot with antibodies to phosphoSer10-hisotne H3, cyclin B, and β-tubulin. Note the extensive phosphoSer10-histone H3 band in lysates of control cells at 10 and 12 h, which is absent in the corresponding lysates of toxin B–treated cells.
We next examined the effects of toxin B on expression of cyclin B. Cyclin B, a component of the M-phase cyclin complex, increases in its amount from the end of S phase, makes a complex with Cdk1 kinase, and is degraded from mid-M-phase (Smits and Medema, 2001). Cdk1 is constitutively expressed, but its activity is regulated by complex formation with cyclin B and then by phosphorylation and dephosphorylation at specific sites during G2 phase (Nigg, 2001). We therefore suspected that toxin B affects formation of this complex and consequently interferes with mitotic entry. We first examined the expression of cyclin B in the toxin B–treated HeLa cells by immunofluorescence (Figure 2A) and immunoblotting analysis (Figure 2B). Staining for cyclin B revealed that treatment with toxin B did not inhibit cyclin B expression. On the contrary, apparently more numbers of cells were positively stained in the toxin B–treated cell population than in the control cells 10 h after the release (Figure 2A). Consistently, immunoblotting revealed that cyclin B was higher in amount in the lysates of the toxin B–treated cells than those of control cells 10 and 12 h after the release (Figure 2B). Because a significant population of control cells had reached meta-to-anaphase at this time (Figure 1, C and D), these results suggest that cyclin B degradation was suppressed by inhibition of mitotic entry in the toxin B–treated cells. These results clearly indicate that toxin B acts on a step or steps either independent of or after cyclin B expression.
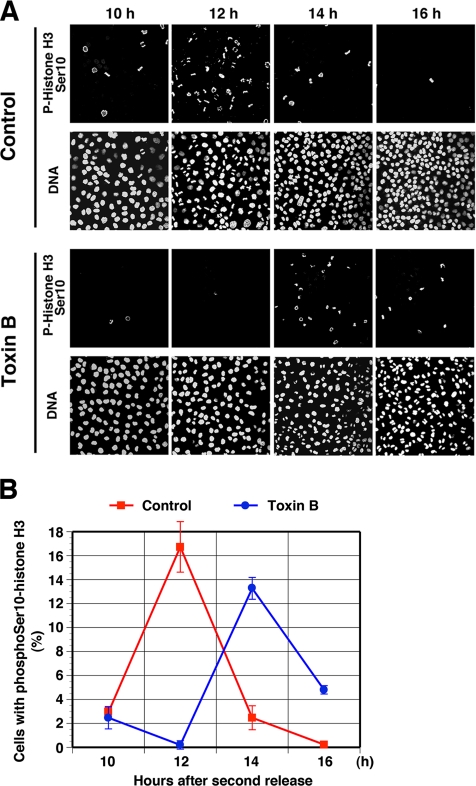
Next, we examined phosphorylation of histone H3 on Ser10 over a longer time course to determine whether toxin B arrests cells at G2-phase or delays mitotic entry. Synchronized HeLa cells were fixed every 2 h from 10 to 16 h after the second release and were stained with antibody to phospho-histone H3 and DAPI as described above (Figure 3A). In the control cell population, cells positive with phospho-histone H3 staining appeared already 10 h after the release, reached the maximum number 12 h, and then decreased 14–16 h. On the other hand, in the toxin B–treated cell population, cells positive for phospho-histone H3 were little in number at 10 and 12 h after the release, reached the maximum number at 14 h, and were still present at 16 h (Figure 3B). These results indicate that treatment with toxin B delayed progression through G2-phase and mitotic entry by 2 h.
Figure 3.
(A) Mitotic entry delay by toxin B treatment. HeLa cells were fixed at indicated times after the second release and stained for phosphoSer10-hisotne H3 and DNA. Note that Ser10-histone H3 phosphorylation appears 14 h after the second release in the toxin B–treated cells with concomitant appearance of mitotic figures. Sustained mitotic figures in the toxin B–treated cell population at 16 h is due to mitotic arrest induced by this toxin (Yasuda et al., 2004). Typical results of three independent experiments are shown. (B) Quantitative analysis. The number of cells positive for phosphoSer10-histone H3 was determined in 300 cells of each population at each time and is presented as %. Data are mean ± SEM (n = 3).
Toxin B Treatment Impairs Activation of Cdk1 Kinase
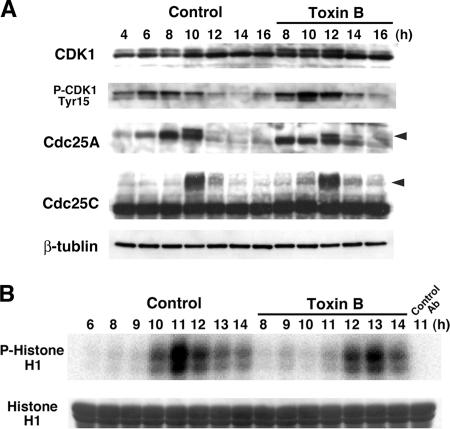
We then examined effects of toxin B treatment on phosphorylation/dephosphorylation and activation of Cdk1. Cdk1 undergoes phosphorylation and dephosphorylation at various sites in G2/M progression. Phosphorylation at Thr14 and Tyr15 represents inhibitory phosphorylation that is dephosphorylated in G2/M progression by members of the Cdc25 phosphatase family (Smits and Medema, 2001; Boutros et al., 2006). On the other hand, Thr 161 phosphorylation is required for activation of Cdk1 and increases and decreases in parallel with cyclin binding. Cells were collected every 2 h from 4 to 16 h with the toxin B addition at 8 h after the second release and subjected to immunoblotting. As shown in Figure 4A, blotting with antibody to Cdk1 detected two bands as described previously. The top band represents the inhibitory phosphorylated form of the protein, and the bottom band, the unphosphorylated form (Solomon et al., 1992). In the control cells, the phosphorylated form peaked in amount at 10 h and then decreased. On the other hand, this time course was delayed again by 2 h in the toxin B–treated cells, which showed that the top band peaked in amount at 12 h (Figure 4A). The 2-h delay of Cdk1 dephsophorylation was shown more clearly on blotting with antibody to phosphoTyr15-Cdk1. In the control cells, phosphorylation of Cdk1 at Tyr15 accumulated 4–8 h after the second release and then decreased from 10 h, whereas the phosphorylation remained high 10 h and decreased only from 12 h in the toxin B–treated cells (Figure 4A). These results indicate that the toxin B treatment delayed Cdk1 activation in late G2. This conclusion was then confirmed by a kinase assay for Cdk1. Cell lysates were prepared, and the Cdk1-cyclin B complex was precipitated with antibody to cyclin B and incubated with histone H1 and [γ-32P]ATP. [32P]Phosphorylated histone H1 was then detected by autoradiography as a measure of the Cdk1 activity (Figure 4B). Although the Cdk1 kinase activity in the control cells appeared 10 h and reached the maximum 11 h, the kinase activity appeared only 12 h and peaked 13 h after the second release in the toxin B–treated cells. These results showed that the toxin B treatment delayed the activation of the M-phase cyclin complex again by 2 h. We next examined phosphorylation of Cdc25 proteins. The Cdc25 proteins are the dual specificity phosphatases that dephosphorylate both Thr14 and Tyr15 phosphorylation of Cdk1 and activate the kinase in the G2/M transition. These proteins are themselves phosphorylated and activated (Izumi et al., 1992; Kumagai and Dunphy, 1992; Boutros et al., 2006). We carried out immunoblotting and examined their phosphorylation status. In the control cells, both Cdc25A and C were phosphorylated at 10 h, whereas the phosphorylation of these proteins appeared only at 12 h in the toxin B–treated cells (Figure 4A). These results that the Cdc25-cyclin B/Cdk1 pathway was inhibited by the toxin B treatment indicate that the toxin B acts on a step leading to this activation.
Figure 4.
Delayed activation of cyclin B/Cdk1 complex in toxin B–treated cells. (A) Immunoblot analysis for Cdk1, phosphoTyr15-Cdk1, Cdc25A, and Cdc25C. HeLa cells were collected every 2 h from 4 to 16 h after the second release with the toxin B addition at 8 h. Total cell lysates were prepared and subjected to SDS-PAGE and immunoblot analysis as indicated. Arrowheads indicate a phosphorylated form of each Cdc25 isoform. (B) Kinase assay of the cyclin B/Cdk1 complex. HeLa cells were collected at indicated times after the second release. Cell lysates were prepared and subjected to immunoprecipitation with antibody to cyclin B1. Immunoprecipitates were incubated with histone H1 in the presence of [γ-32P]ATP, and [32P]phosphorylated histone H1 was analyzed by SDS-PAGE and autoradiography.
Toxin B Interferes with Activation of Aurora-A at the Centrosome
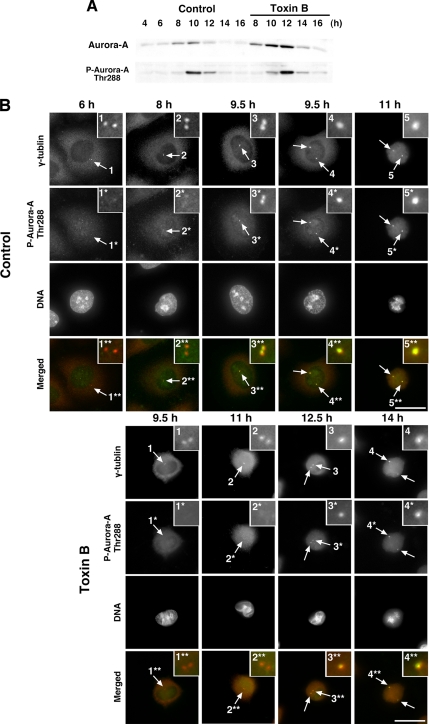
Recent studies have revealed that Aurora-A kinase plays an important role in cell division including centrosome maturation and separation, mitotic commitment, chromosome alignment, and possibly cytokinesis (Hannak et al., 2001; Hirota et al., 2003; Kunitoku et al., 2003; Marumoto et al., 2003; Zhang et al., 2004). Aurora-A increases in its expression during G2-phase and is activated by phosphorylation at Thr288 at late G2-phase. Hirota et al. (2003) reported that Aurora-A is activated by autophosphorylation at Thr288 in late G2-phase at the centrosome and that this activation is essential for recruitment of the cyclin B/Cdk1 complex to the centrosome and its activation at the centrosome. We therefore determined the expression and activation of Aurora-A in HeLa cells treated with or without toxin B first by immunoblotting using antibodies to Aurora-A and to phosphoThr288-Aurora-A. In control cells, Aurora-A protein increased in amount from 8 to 10 h after the thymidine release and showed strong Thr288-phosphorylation at 10 h, and both the expression and the phosphorylation decreased at 12 h (Figure 5A). On the other hand, in the toxin B–treated cells, Aurora-A appeared at 8 h as seen in control cells but accumulated apparently in more amount than in control cells up to 12 h. This apparent hyper-accumulation of the kinase is probably due to decreased degradation caused by the delay into mitotic entry, because Aurora-A is known to be degraded after metaphase (Marumoto et al., 2005). Notably, even in the presence of such hyper-accumulation, accumulation of Thr288-phosphorylated Aurora-A, i.e., activation of Aurora-A, was delayed by 2 h and peaked at 12 h in the toxin B–treated cells (Figure 5A).
Figure 5.
Aurora-A expression and activation at the centrosome in toxin B–treated cells. (A) Immunoblot analysis for Aurora-A and phosphoThr288-Aurora-A. HeLa cells were collected at indicated times after the second release with addition of toxin B at 8 h. Cell lysates were prepared and subjected to immunoblot as indicated. (B) Immunofluorescence for phosphoThr288-Aurora-A in control and toxin B–treated cells. HeLa cells were fixed at indicated times after the second release and stained for γ-tubulin (red), phosphoThr288-Aurora-A (green), and DNA. Insets show magnified views of the centrosome indicated by numbered arrows. (Note that Aurora-A activation examined as phosphoThr288-Aurora-A appeared 9.5 h after the release in control cells, whereas it became evident 12.5 h in toxin B–treated cells.) Typical results of at least three independent experiments are shown. Bar, 10 μm.
We next wanted to confirm that the delay of Aurora-A activation detected by the immunoblot analysis was due to impaired activation of Aurora-A at the centrosome. Synchronized HeLa cells were fixed at the indicated times and stained for phosphoThr288-Aurora-A and γ-tubulin. In the control cell population, there was only faint phospho-Aurora-A signal at the centrosome 8 h after the release in mid-G2-phase, and the signals at centrosomes became evident at 9.5 h and persisted to 11 h after the release (Figure 5B). On the other hand, in the toxin B–treated cells, the phosphoThr288-Aurora-A signals at the centrosome were seen faintly 11 h after the second release, became evident only 12.5 h, and persisted to 14 h after the release (Figure 5B). These observations suggest that toxin B treatment interfered with activation of Aurora-A at the centrosome.
Accumulation of HEF1 at Centrosome and Its Phosphorylation Were Inhibited by Toxin B Treatment
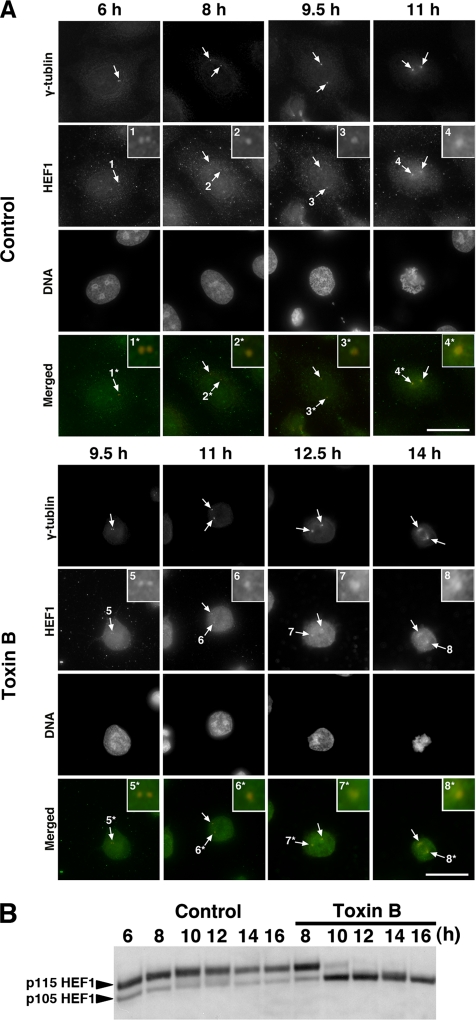
The above results that the toxin B treatment interferes with several events associated with G2/M progression, particularly Aurora-A activation at the centrosome, indicate that a Rho GTPase-dependent pathway or pathways regulate the centrosomal event. HEF1 (human enhancer of filamentation 1) is a multifunctional docking protein of the Cas family that localizes to focal adhesions in interphase and mediates a variety of integrin-dependent signaling (O'Neill et al., 2000). HEF1 moves to the centrosome in G2 and contributes to activation of Aurora-A in the G2/M transition (Pugacheva and Golemis, 2005). We therefore addressed whether the toxin B treatment interferes with HEF1 localization at the centrosome. HeLa cells were collected at various times after the release from the double thymidine block and stained for HEF1. In control cells, HEF1 already localized at the centrosome 6 h after the release in late S/early G2 phase (Figure 6A), gradually accumulated at the centrosome from 8 h as the centrosomes matured to reach the maximal accumulation 11 h after the release in prometaphase to metaphase. In contrast, in the toxin B–treated cells, the extent of accumulation did not change significantly from 8 to 11 h and then gradually increased and reached the maximum at 12.5–14 h (Figure 6A, Toxin B panels). Thus, the toxin B treatment did not inhibit the localization of HEF1 at the centrosome but delayed the time course of its accumulation. We next examined effects of the toxin B treatment on phosphorylation of HEF1. Law et al. (1998) reported that the p105 form of HEF1 undergoes extensive Ser/Thr phosphorylation after the thymidine release and is converted to the p115 phosphorylated form. We therefore collected HeLa cells every 2 h from 6 to 16 h after the thymidine release and subjected lysates of these cells to immunoblotting for HEF1. Toxin B was added 8 h after the release, and its effects on HEF1 phosphorylation was examined. In control cells, the p115-phosphorylated form dominated already 6 h after the release, reached its maximum at 10 h, and then gradually decreased in amount. On the other hand, with the toxin B addition, the p115 form that was present 8 h disappeared at 10 h with a concomitant increase in the amount of p105, which remained in about the same amount from 10 to 16 h. This result suggests that the toxin B treatment inhibited Ser/Thr phosphorylation of HEF1. On the other hand, the addition of hesperadine, an Aurora kinase inhibitor, to HeLa cells 8 h after the second release did not change the amount of the p115-phosphorylated form of HEF1 (data not shown), which is consistent with the fact that Aurora-A activation occurred much later than the appearance of this phosphorylated form of HEF1.
Figure 6.
Effects of toxin B treatment on localization and Ser/Thr phosphorylation of HEF1. (A) Immunofluorescence for HEF1. HeLa cells were fixed with methanol after pre-extraction with 0.5% Triton X-100 in PHEM buffer and stained for HEF1 (green), γ-tubulin (red), and DNA. Arrows indicate centrosomes, and insets show magnified views of the centrosomes indicated numbered arrows. Note that HEF1 was already present at the centrosome in the end of S phase (6 h) and increased its amount during G2 progression in control cells and that this increase was delayed in toxin B–treated cells. (B) Immunoblot for HEF1. HeLa cells were collected at indicated times after the release with toxin B addition at 8 h and were subjected to immunoblot for HEF1. Note that the toxin B treatment abolished p115 phosphorylated form of HEF1. Typical results of at least three independent experiments are shown. Bar, 10 μm.
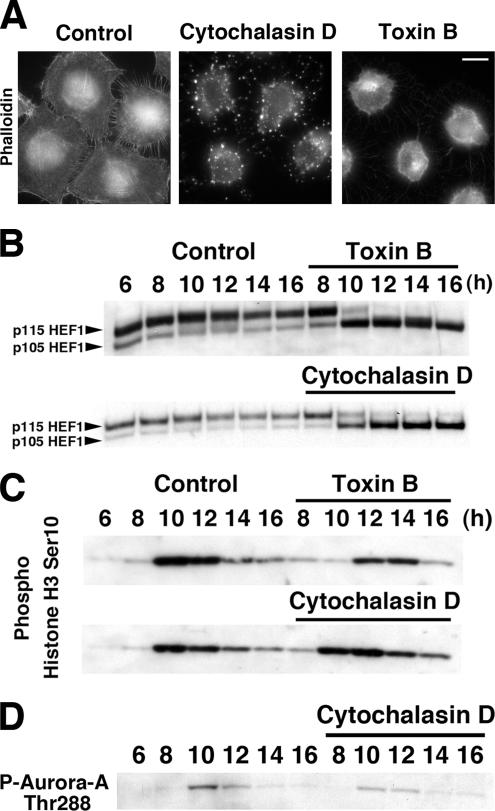
Because inactivation of Rho GTPases by toxin B results in marked suppression of F-actin in cells and a recent report showed that actin disruption agents such as cytochalasin D also suppressed phosphorylation of HEF1 (Zheng and McKeown-Longo, 2006), we asked whether the delay in G2/M transition caused by the toxin B treatment was due to disruption of the actin cytoskeleton. To test this issue, we added 4 μM cytochalasin D to HeLa cells 8 h after the release and monitored the G2/M transition of these cells. The cytochalasin D addition caused dissolution of the actin cytoskeleton more extensively than did the toxin B treatment and indeed suppressed phosphorylation of HEF1 as reported (Figure 7, A and B). However, this treatment caused only a subtle delay in G2/M transition as examined by Ser10 phosphorylation of histone H3 as well as Thr288 phosphorylation of Aurora-A (Figure 7, C and D). These results suggest that disruption of the actin cytoskeleton or inhibition of Ser/Thr phosphorylation of HEF1 cannot be major causes of the G2/M delay in toxin B–treated cells (see Discussion).
Figure 7.
Effects of cytochalasin D on HEF1 phosphorylation and G2/M transition. (A) Phalloidin staining. HeLa cells were treated with either 50 ng/ml toxin B or 4 μM cytochalasin D from 8 to 10 h after the second release and were then fixed and stained with rhodamine-phalloidin. Note that both toxin B and cytochalasin D disrupted actin cytoskeleton structure but in different manners. Bar, 10 μm. (B) Effects on HEF1 phosphorylation. HeLa cells were collected at indicated times after the second release with addition of cytochalasin D or toxin B at 8 h and subjected to immunoblotting for HEF1. (C) Effects on Ser10-phosphorylation of histone H3. HeLa cells were treated and collected as above and subjected to immunoblotting for phosphoSer10-hisotne H3. (D) Effects on Aurora-A activation. HeLa cells were collected at indicated times after the second release with addition of cytochalasin D at 8 h. Cell lysates were prepared and subjected to immunoblot for phosphoThr288-Aurora-A as indicated.
Centrosomal Activation of PAK Was Inhibited by Toxin B Treatment
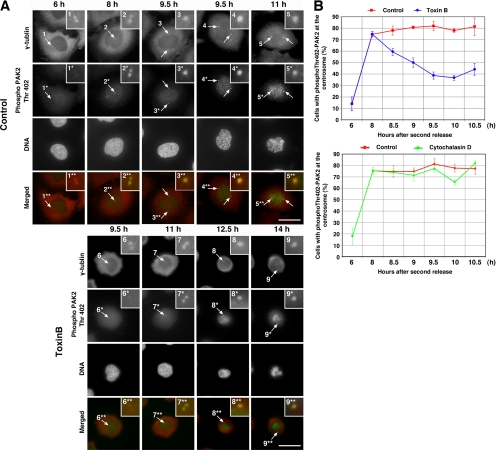
We next examined effects of toxin B on PAK activation at the centrosome. PAK, p21 activated kinase, is a group of effectors that function downstream of Cdc42 and Rac (Bokoch, 2003). A previous study showed that a small population of PAK is targeted to and activated at the centrosome in G2 before mitosis and works as one of activators for Aurora-A (Zhao et al., 2005). Although the mutant experiment in this previous study did not support the involvement of Rho GTPases in the centrosomal PAK activation, we addressed this issue again by examining whether the toxin B treatment inhibits the PAK activation. To this end, we carried out immunofluorescence for phosphoThr402-PAK2. PAK2 is the dominant PAK isoform in HeLa cells, and Thr402 is located in the activation loop of the kinase, phosphorylation of which results in a marked activation of the enzymatic activity (Zhao et al., 2005). Costaining for phosphoThr402-PAK2 and γ-tubulin in control cells revealed that there was little signal for phosphoThr402-PAK2 at the centrosomes 6 h after the second release that correspond to late S and early G2 phase (Figure 8A). Centrosomal phospho-PAK2 signal was clearly detected 8 h after the second release and became stronger after 9.5 h. In the toxin B–treated cells, the signal of the PAK phosphorylation was also seen at the centrosomes but its time course was again delayed; it became evident only 11 h after the second release. Intriguingly, the phosphoThr402-PAK2 signal present in the cells before the toxin addition i.e., 8 h after the release was not detected at 9.5 h in the toxin B–treated cells, suggesting that the toxin B treatment suppressed the centrosomal activation of PAK. Therefore, we next examined this inhibitory effect of toxin B quantitatively by counting the number of cells with or without this centrosomal PAK-activation signal in the control and toxin B–treated cell population. As shown in Figure 8B, 75–80% of the control cell population in G2 phase showed PAK activation at the centrosome during the period from 8 to 10.5 h after the release, whereas cells with the positive signal decreased time-dependently to <40% in the toxin B–treated cell population. Furthermore, concomitant with the decrease in number, the intensity of the centrosomal signal became also weaker in the toxin B–treated cells (data not shown). On the other hand, alteration of PAK activation was not detected in cells treated with cytochalasin D (Figure 8B). These results suggest that Rho GTPases are required for activation of PAK at the centrosome in the G2/M progression and that this Rho GTPase action appears independent of the actin cytoskeleton.
Figure 8.
Inhibition of PAK activation at the centrosome by toxin B treatment. (A) Immunofluorescence for phosphoThr402-PAK2. HeLa cells were fixed at indicated times after the second release and stained for γ-tubulin (red), phosphoThr402-PAK2 (green), and DNA. Insets show magnified views of the centrosome indicated by numbered arrows. Note that PAK activation examined as phosphoThr402-PAK2 present 8 h after the release was abolished at 9.5 h in toxin B–treated cells. The phosphoThr402-PAK2 signals on chromosomes of mitotic cells may represent PAK activation at kinetochores (Li et al., 2002). Typical results of at least three independent experiments are shown. Bar, 10 μm. (B) Quantitative analysis on PAK activation. HeLa cells treated with either toxin B (top) or cytochalasin D (bottom) were fixed at indicated times after the second release and stained for γ-tubulin and phosphoThr402-PAK2. The number of cells with a signal of phosphoThr402-PAK2 at the centrosome was determined in 50 cells of each population. Data are mean ± SEM (n = 3).
Effects of Botulinum C3 Exoenzyme and Y-27632 on HEF-1 Phosphorylation, Aurora-A Activation, and G2/M Transition
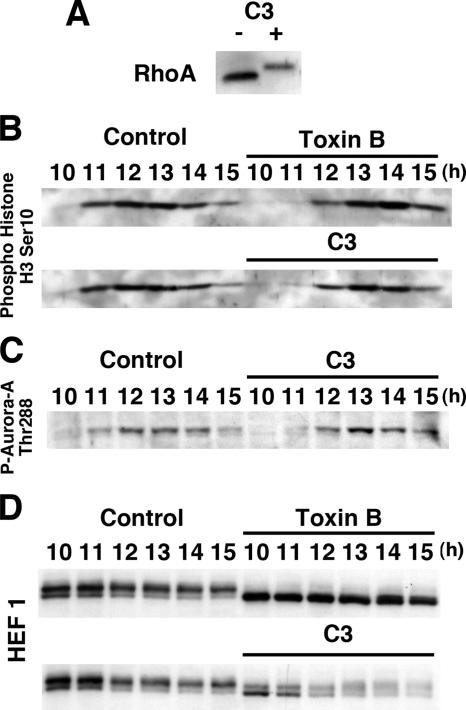
We next examined the effects of botulinum C3 exoenzyme on G2/M transition, because toxin B inactivates all members of Rho GTPases, whereas C3 exoenzyme inactivates only the Rho subgroup of the GTPases such as RhoA, RhoB, and RhoC, in this subfamily (Aktories and Barbieri, 2005). Because C3 exoenzyme does not permeate cells so easily as toxin B, we subjected the cells 6.5 h after the release to electropermeation in the presence of C3 exoenzyme as described previously (Kato et al., 2001). This treatment caused almost all amounts of Rho protein to be ADP-ribosylated, as evidenced by immunoblot for RhoA in lysates of control and C3 exoenzyme-exposed cells (Figure 9A) and by extensive formation of binucleate cells 14 h after the release (data not shown). Because the electropermeation procedure attenuated cell cycle synchronization and, consequently, mitotic entry of control cells (Figure 9B), we also carried out electropermeation of toxin B and used the toxin B–treated cells as a positive control for the C3 exoenzyme-treated cells. The C3 exoenzyme-treated cells also showed the delay in G2/M progression as examined by Ser10 phosphorylation of histone H3 but only by 1 h compared with 2-h delay in the toxin B–treated cells; the phosphorylation was detected first 12 h after the release in the C3 exoenzyme-treated cells as seen in the toxin B–treated cells compared with 11 h in control cells, with a peak at 12, 13, and 14 h after the release in the control, C3 exoenzyme-treated and toxin B–treated cells, respectively (Figure 9B). The C3 exoenzyme treatment delayed Aurora-A activation also marginally by 0.5–1 h (Figure 9C). The C3 exoenzyme treatment also increased the amount of unphosphorylated form of HEF1 and appeared to accelerate its degradation (Figure 9D).
Figure 9.
Effects of botulinum C3 exoenzyme on G2/M transition. (A) Modification of Rho GTPases by C3 exoenzyme treatment. Note the slower mobility of bands for the RhoA in the lysates of cells treated with C3 exoenzyme. (B) Effect on Ser10-phosphorylation of histone H3. Either toxin B or C3 exoenzyme or vehicle was electropermeated into HeLa cells 6.5 h after the second release. The cells were then collected at indicated times and subjected to immunoblotting for phosphoSer10-histone H3. (C) Effects on Aurora-A activation. HeLa cells treated as above were collected and subjected to immunoblotting for phosphoThr288-Aurora-A. (D) Effects on HEF1 phosphorylation. HeLa cells treated as above were collected and subjected to immunoblotting for HEF1.
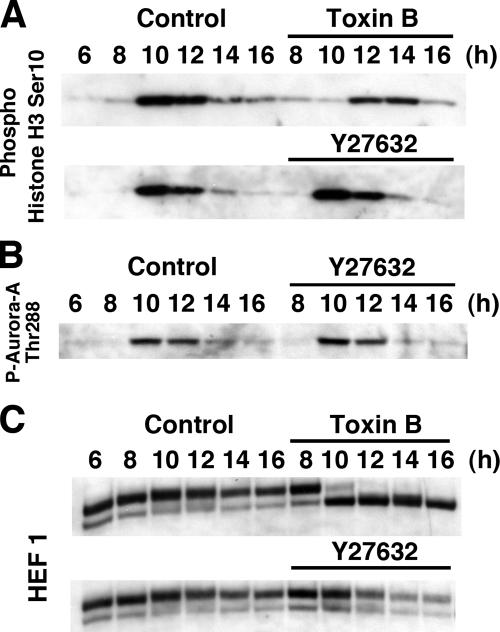
One of the major effectors of Rho is ROCK/Rho-kinase, and this enzyme is present in the centrosome and was reported to be associated with Aurora-A (Chevrier et al., 2002; Du and Hannon, 2004). We therefore next examined effects of Y-27632, a specific ROCK inhibitor, on the HEF1 phosphorylation, Aurora-A phosphorylation, and G2/M transition. Y-27632 added up to 50 μM 8 h after the release was without effects on G2/M progression and Aurora-A activation (Figure 10, A and B). This compound did not affect the HEF1 phosphorylation, either, but appeared to accelerate its degradation (Figure 10C).
Figure 10.
Effects of Y27632 on G2/M transition. (A) Effect of Y27632 on Ser10-phosphorylation of histone H3. Y-27632 was added to HeLa cells 8 h after the second release. The cells were collected at indicated times after the second release and subjected to immunoblotting for phosphoSer10-histone H3. (B) Effect of Y27632 on Aurora-A activation. HeLa cells were treated and collected as above and subjected to immunoblotting for phosphoThr288-Aurora-A. (C) Effects on HEF1 phosphorylation. Cell lysates were prepared as above and subjected to immunoblotting for HEF1.
DISCUSSION
Here we examined effects of toxin B treatment on cell cycle progression of HeLa cells released from the double thymidine block and found that the toxin B treatment interfered with G2/M progression. A prominent feature of the toxin B effect was that this treatment delayed various events associated with G2/M transition such as Aurora-A activation, Cdk1 activation, and histone H3 phosphorylation by 2 h, but did not arrest the progression. After the 2-h delay all of these events occurred apparently normally, and the cells progressed to mitosis. Given that the glucosylation of Rho GTPases by toxin B appears irreversible, these findings suggest that there are a Rho GTPase-dependent pathway and a Rho GTPase-independent pathway to initiate G2/M transition of HeLa cells, that the Rho-dependent pathway initially triggers the transition under the usual culture conditions, but that when it fails, the other Rho-independent pathway is mobilized to compensate for its loss.
The G2/M transition is supposed to be carried out by a sequence of events. Currently, Aurora-A activation at the centrosome is believed as the primary event, which induces activation of the cyclin B/Cdk1 complex, Aurora-B activation, histone H3 phosphorylation, and chromosome condensation. We now know that several signaling pathways converge at the centrosome and contribute to Aurora-A activation at this organelle. Among the events we analyzed here, HEF1 accumulation and PAK activation at the centrosome contribute to Aurora-A activation (Pugacheva and Golemis, 2005; Zhao et al., 2005). Although the toxin B treatment impaired both, they showed different time courses. Although PAK activation at the centrosome occurred from 8 h, HEF1 was present at the centrosome already at 6 h and increased in amount only after 9.5 h. The toxin B treatment did not affect earlier constitutive presence of HEF1 at the centrosome and delayed only the later accumulation. Given that Aurora-A activation at the centrosome increased from 8 to 10 h, the PAK activation that is inhibited by toxin B and precedes the HEF1 accumulation appears to be the primary target of toxin B for the delay of Aurora-A activation. Given that PAKs are effectors of Cdc42 and Rac (Bokoch, 2003), these results suggest that Rho GTPases, possibly Cdc42- or Rac-related GTPases, function to activate PAK at the centrosome and that this action is inhibited by toxin B. Consistently, we previously stained mitotic cells pre-extracted with 0.5% Triton X-100 in PHEM buffer and found that Cdc42 is localized in the spindle poles (Oceguera-Yanez et al., 2005), and our preliminary immunofluorescence analysis using the same extraction method detected the Cdc42 signal at the centrosome in HeLa cells in G2 phase (Oceguera-Yanez, Ando, and Narumiya, unpublished results). These results indicate that Cdc42 is present at the centrosome and activates PAK at G2/M transition. However, our preliminary RNA interference (RNAi) experiment showed depletion of Cdc42 alone does not cause the delay of G2/M transition at least to a similar extent (data not shown), suggesting that this function is exerted redundantly by more than one members of Rho GTPases.
In contrast to our suggestion that Rho GTPase(s) is involved in centrosomal PAK activation, Zhao et al. (2005), based on their experiment using a PAK mutant, suggested that PAK is activated at the centrosome in a Rho GTPase-independent manner. However, these two findings are not mutually exclusive. Zhao et al. used the PAK (S76P) mutant incapable of binding Cdc42 or Rac. They fused this mutant with the centrosome-targeting motifs, expressed the fusion proteins in COS cells and examined PAK activation after 30 h of culture. Their experiment therefore showed that PAK could be activated independent of Rho GTPases when it is targeted to the centrosome, but did not address whether Rho GTPases activate centrosomal PAK in a physiological context. As we discussed above, the toxin B treatment did not arrest the progression but delayed the G2/M transition by 2 h. After the 2-h delay, PAK activation, consequently, entry to mitosis, occurred apparently normally in the presence of continued inactivation of Rho GTPases, suggesting that there are a Rho GTPase-dependent and a Rho GTPase-independent pathway to PAK activation. We suggest therefore that Rho GTPases come in first for PAK activation at the centrosome, and that, when it fails, the Rho-independent pathway found by Zhao et al. is mobilized as a compensatory mechanism for PAK activation.
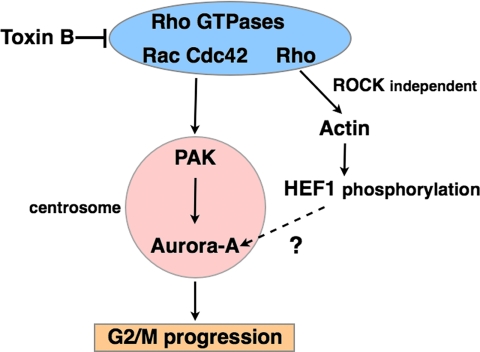
Then, is the centrosomal PAK activation only the step regulated by Rho GTPases at G2/M transition? Here we found that the toxin B treatment interfered with HEF1 accumulation at the centrosome. The HEF1 accumulation at the centrosome was previously reported to be important in activation of Aurora-A (Pugacheva and Golemis, 2005). Furthermore, we found that treatment of cells with cytochalasin D also delayed the G2/M progression. This finding is consistent with previous report by Barth et al. (1999) that C. botulinum C2 toxin, which disrupts the actin cytoskeleton, induces a similar extent of delay in Cdk1 activation and mitotic entry in HeLa cells. Although the delay by the cytochalasin D treatment is shorter than that caused by the toxin B treatment, the delay by the cytochalasin D occurs without effect on PAK activation. These results indicate that the actin cytoskeleton induced by Rho GTPases has some regulatory function in G2/M progression and suggests a possibility that Rho GTPases have an additional regulatory role in G2/M progression other than that in PAK activation. Here, we examined involvement of the Rho subgroup of GTPases with botulinum C3 exoenzyme that specifically inactivates this subgroup of Rho GTPases and found that treatment of HeLa cells with C3 exoenzyme indeed caused a delay in G2/M progression, but the delay was only 1 h. Curiously, this delay is similar to that found in cells treated with cytochalasin D, and the C3 treatment also disrupted actin cytoskeleton, indicating that Rho functions via actin cytoskeleton in G2/M transition. Furthermore, Schmidt et al. (2007) used RNAi for a Rho effector, PRK2/PKN2, and found that depletion of this molecule resulted in impaired Cdc25B phosphorylation and delay of G2/M transition. They also found that the toxin B treatment impaired phosphorylation of PRK2 and suggested that Rho GTPase is involved in this pathway. However, as described, inactivation of Rho by the C3 exoenzyme treatment causes only 1-h delay, suggesting that, if the Rho-PRK2 pathway functions, its impairment does not explain all the effects of toxin B we observed. Indeed, activation of Cdc25 is believed to occur after the activation of Aurora-A. On the basis of these findings, we envisage the signal transduction pathways of Rho GTPases in G2/M transition as in Figure 11.
Figure 11.
A current model for Rho GTPase signaling in G2/M progression.
In summary, using toxin B, we present here several lines of evidence that Rho GTPase(s) is involved in G2/M transition. Our analysis suggests that Rho GTPases regulates pathways converging to the Aurora-A activation at the centrosome for G2/M transition, PAK and HEF1 being candidate effectors in these pathways. Given that Rho GTPases regulate cell morphogenesis and that cells change their shape on mitotic entry, our study raises an interesting possibility that Rho GTPases function as an integrator of two major events associated with G2/M transition, activation of mitotic kinases, and cell shape change.
ACKNOWLEDGMENTS
We thank K. Aktories for C. difficile toxin B, E. Golemis (Fox Chase Cancer Center) for mAb to HEF1 (2G9) and rabbit antiserum to HEF1, T. Ishizaki for discussion, and K. Nonomura, T. Arai, Y. Kitagawa, and M. Tanaka for assistance. This work was supported by a Grant-in-Aid for Specially Promoted Research from the Ministry of Education, Culture, Sports, Science, and Technology of Japan.
Footnotes
This article was published online ahead of print in MBC in Press (http://www.molbiolcell.org/cgi/doi/10.1091/mbc.E07-03-0281) on July 18, 2007.
REFERENCES
- Aktories K., Barbieri J. T. Bacterial cytotoxins: targeting eukaryotic switches. Nat. Rev. Microbiol. 2005;3:397–410. doi: 10.1038/nrmicro1150. [DOI] [PubMed] [Google Scholar]
- Bayliss R., Sardon T., Vernos I., Conti E. Structural basis of Aurora-A activation by TPX2 at the mitotic spindle. Mol. Cell. 2003;12:851–862. doi: 10.1016/s1097-2765(03)00392-7. [DOI] [PubMed] [Google Scholar]
- Bakal C. J., Finan D., LaRose J., Wells C. D., Gish G., Kulkarni S., DeSepulveda P., Wilde A., Rottapel R. The Rho GTP exchange factor Lfc promotes spindle assembly in early mitosis. Proc. Natl. Acad. Sci. USA. 2005;102:9529–9534. doi: 10.1073/pnas.0504190102. [DOI] [PMC free article] [PubMed] [Google Scholar]
- Barth H., Klingler M., Aktories K., Kinzel V. Clostridium botulinum C2 toxin delays entry into mitosis and activation of p34cdc2 kinase and cdc25-C phosphatase in HeLa cells. Infect. Immun. 1999;67:5083–5090. doi: 10.1128/iai.67.10.5083-5090.1999. [DOI] [PMC free article] [PubMed] [Google Scholar]
- Belmont A. S. Mitotic chromosome structure and condensation. Curr. Opin. Cell Biol. 2006;18:632–638. doi: 10.1016/j.ceb.2006.09.007. [DOI] [PubMed] [Google Scholar]
- Bokoch G. M. Biology of the p21-activated kinases. Annu. Rev. Biochem. 2003;72:743–781. doi: 10.1146/annurev.biochem.72.121801.161742. [DOI] [PubMed] [Google Scholar]
- Boutros R., Dozier C., Ducommun B. The when and wheres of CDC25 phosphatases. Curr. Opin. Cell Biol. 2006;18:185–191. doi: 10.1016/j.ceb.2006.02.003. [DOI] [PubMed] [Google Scholar]
- Chevrier V., Piel M., Collomb N., Saoudi Y., Frank R., Paintrand M., Narumiya S., Bornens M., Job D. The Rho-associated protein kinase p160ROCK is required for centrosome positioning. J. Cell Biol. 2002;157:807–817. doi: 10.1083/jcb.200203034. [DOI] [PMC free article] [PubMed] [Google Scholar]
- Du J., Hannon G. J. Suppression of p160ROCK bypasses cell cycle arrest after Aurora-A/STK15 depletion. Proc. Natl. Acad. Sci. USA. 2004;101:8975–8980. doi: 10.1073/pnas.0308484101. [DOI] [PMC free article] [PubMed] [Google Scholar]
- Etienne-Manneville S., Hall A. Rho GTPases in cell biology. Nature. 2002;420:629–635. doi: 10.1038/nature01148. [DOI] [PubMed] [Google Scholar]
- Eyers P. A., Erikson E., Chen L. G., Maller J. L. A novel mechanism for activation of the protein kinase Aurora A. Curr. Biol. 2003;13:691–697. doi: 10.1016/s0960-9822(03)00166-0. [DOI] [PubMed] [Google Scholar]
- Hannak E., Kirkham M., Hyman A. A., Oegema K. Aurora-A kinase is required for centrosome maturation in Caenorhabditis elegans. J. Cell Biol. 2001;155:1109–1116. doi: 10.1083/jcb.200108051. [DOI] [PMC free article] [PubMed] [Google Scholar]
- Hirota T., Kunitoku N., Sasayama T., Marumoto T., Zhang D., Nitta M., Hatakeyama K., Saya H. Aurora-A and an interacting activator, the LIM protein Ajuba, are required for mitotic commitment in human cells. Cell. 2003;114:585–598. doi: 10.1016/s0092-8674(03)00642-1. [DOI] [PubMed] [Google Scholar]
- Izumi T., Walker D. H., Maller J. L. Periodic changes in phosphorylation of the Xenopus cdc25 phosphatase regulate its activity. Mol. Biol. Cell. 1992;3:927–939. doi: 10.1091/mbc.3.8.927. [DOI] [PMC free article] [PubMed] [Google Scholar]
- Jackman M., Lindon C., Nigg E. A., Pines J. Active cyclin B1-Cdk1 first appears on centrosomes in prophase. Nat. Cell Biol. 2003;5:143–148. doi: 10.1038/ncb918. [DOI] [PubMed] [Google Scholar]
- Just I., Selzer J., Wilm M., von Eichel-Streiber C., Mann M., Aktories K. Glucosylation of Rho proteins by Clostridium difficile toxin B. Nature. 1995;375:500–503. doi: 10.1038/375500a0. [DOI] [PubMed] [Google Scholar]
- Kato T., Watanabe N., Morishima Y., Fujita A., Ishizaki T., Narumiya S. Localization of a mammalian homolog of diaphanous, mDia1, to the mitotic spindle in HeLa cells. J. Cell Sci. 2001;114:775–784. doi: 10.1242/jcs.114.4.775. [DOI] [PubMed] [Google Scholar]
- Kumagai A., Dunphy W. G. Regulation of the cdc25 protein during the cell cycle in Xenopus extracts. Cell. 1992;70:139–151. doi: 10.1016/0092-8674(92)90540-s. [DOI] [PubMed] [Google Scholar]
- Kunitoku N., et al. CENP-A phosphorylation by Aurora-A in prophase is required for enrichment of Aurora-B at inner centromeres and for kinetochore function. Dev. Cell. 2003;5:853–864. doi: 10.1016/s1534-5807(03)00364-2. [DOI] [PubMed] [Google Scholar]
- Law S. F., Zhang Y. Z., Klein-Szanto A. J., Golemis E. A. Cell cycle-regulated processing of HEF1 to multiple protein forms differentially targeted to multiple subcellular compartments. Mol. Cell. Biol. 1998;18:3540–3551. doi: 10.1128/mcb.18.6.3540. [DOI] [PMC free article] [PubMed] [Google Scholar]
- Li F., Adam L., Vadlamudi R. K., Zhou H., Sen S., Chernoff J., Mandal M., Kumar R. p21-activated kinase 1 interacts with and phosphorylates histone H3 in breast cancer cells. EMBO Rep. 2002;3:767–773. doi: 10.1093/embo-reports/kvf157. [DOI] [PMC free article] [PubMed] [Google Scholar]
- Marumoto T., Honda S., Hara T., Nitta M., Hirota T., Kohmura E., Saya H. Aurora-A kinase maintains the fidelity of early and late mitotic events in HeLa cells. J. Biol. Chem. 2003;278:51786–51795. doi: 10.1074/jbc.M306275200. [DOI] [PubMed] [Google Scholar]
- Marumoto T., Zhang D., Saya H. Aurora-A—a guardian of poles. Nat. Rev. Cancer. 2005;5:42–50. doi: 10.1038/nrc1526. [DOI] [PubMed] [Google Scholar]
- Morii N., Narumiya S. Preparation of native and recombinant Clostridium botulinum C3 ADP-ribosyltransferase and identification of Rho proteins by ADP-ribosylation. Methods Enzymol. 1995;256:196–206. doi: 10.1016/0076-6879(95)56024-6. [DOI] [PubMed] [Google Scholar]
- Narumiya S., Yasuda S. Rho GTPases in animal cell mitosis. Curr. Opin. Cell Biol. 2006;18:199–205. doi: 10.1016/j.ceb.2006.02.002. [DOI] [PubMed] [Google Scholar]
- Nigg E. A. Mitotic kinases as regulators of cell division and its checkpoints. Nat. Rev. Mol. Cell Biol. 2001;2:21–32. doi: 10.1038/35048096. [DOI] [PubMed] [Google Scholar]
- O'Neill G. M., Fashena S. J., Golemis E. A. Integrin signalling: a new Cas(t) of characters enters the stage. Trends Cell Biol. 2000;10:111–119. doi: 10.1016/s0962-8924(99)01714-6. [DOI] [PubMed] [Google Scholar]
- Oceguera-Yanez F., Kimura K., Yasuda S., Higashida C., Kitamura T., Hiraoka Y., Haraguchi T., Narumiya S. Ect2 and MgcRacGAP regulate the activation and function of Cdc42 in mitosis. J. Cell Biol. 2005;168:221–232. doi: 10.1083/jcb.200408085. [DOI] [PMC free article] [PubMed] [Google Scholar]
- Palazzo R. E., Vogel J. M., Schnackenberg B. J., Hull D. R., Wu X. Centrosome maturation. Curr. Top. Dev. Biol. 2000;49:449–470. doi: 10.1016/s0070-2153(99)49021-0. [DOI] [PubMed] [Google Scholar]
- Prigent C., Dimitrov S. Phosphorylation of serine 10 in histone H3, what for? J. Cell Sci. 2003;116:3677–3685. doi: 10.1242/jcs.00735. [DOI] [PubMed] [Google Scholar]
- Pugacheva E. N., Golemis E. A. The focal adhesion scaffolding protein HEF1 regulates activation of the Aurora-A and Nek2 kinases at the centrosome. Nat. Cell Biol. 2005;7:937–946. doi: 10.1038/ncb1309. [DOI] [PMC free article] [PubMed] [Google Scholar]
- Schmidt A., Durgan J., Magalhaes A., Hall A. Rho GTPases regulate PRK2/PKN2 to control entry into mitosis and exit from cytokinesis. EMBO J. 2007;26:1624–1636. doi: 10.1038/sj.emboj.7601637. [DOI] [PMC free article] [PubMed] [Google Scholar]
- Smits V. A., Medema R. H. Checking out the G(2)/M transition. Biochim. Biophys. Acta. 2001;1519:1–12. doi: 10.1016/s0167-4781(01)00204-4. [DOI] [PubMed] [Google Scholar]
- Solomon M. J., Lee T., Kirschner M. W. Role of phosphorylation in p34cdc2 activation: identification of an activating kinase. Mol. Biol. Cell. 1992;3:13–27. doi: 10.1091/mbc.3.1.13. [DOI] [PMC free article] [PubMed] [Google Scholar]
- Théry M., Bornens M. Cell shape and cell division. Curr. Opin. Cell Biol. 2006;18:648–657. doi: 10.1016/j.ceb.2006.10.001. [DOI] [PubMed] [Google Scholar]
- Tsai M. Y., Wiese C., Cao K., Martin O., Donovan P., Ruderman J., Prigent C., Zheng Y. A Ran signalling pathway mediated by the mitotic kinase Aurora A in spindle assembly. Nat. Cell Biol. 2003;5:242–248. doi: 10.1038/ncb936. [DOI] [PubMed] [Google Scholar]
- Yasuda S., Oceguera-Yanez F., Kato T., Okamoto M., Yonemura S., Terada Y., Ishizaki T., Narumiya S. Cdc42 and mDia3 regulate microtubule attachment to kinetochores. Nature. 2004;428:767–771. doi: 10.1038/nature02452. [DOI] [PubMed] [Google Scholar]
- Yasuda S., Taniguchi H., Oceguera-Yanez F., Ando Y., Watanabe S., Monypenny J., Narumiya S. An essential role of Cdc42-like GTPases in mitosis of HeLa cells. FEBS Lett. 2006;580:3375–3380. doi: 10.1016/j.febslet.2006.05.009. [DOI] [PubMed] [Google Scholar]
- Zhang D., et al. Cre-loxP-controlled periodic Aurora-A overexpression induces mitotic abnormalities and hyperplasia in mammary glands of mouse models. Oncogene. 2004;23:8720–8730. doi: 10.1038/sj.onc.1208153. [DOI] [PubMed] [Google Scholar]
- Zhao Z. S., Lim J. P., Ng Y. W., Lim L., Manser E. The GIT-associated kinase PAK targets to the centrosome and regulates Aurora-A. Mol. Cell. 2005;20:237–249. doi: 10.1016/j.molcel.2005.08.035. [DOI] [PubMed] [Google Scholar]
- Zheng M., McKeown-Longo P. J. Cell adhesion regulates Ser/Thr phosphorylation and proteasomal degradation of HEF1. J. Cell Sci. 2006;119:96–103. doi: 10.1242/jcs.02712. [DOI] [PubMed] [Google Scholar]


