Abstract
Background
Blood glucose concentrations are essential in defining diabetes mellitus. Recent guidelines advocate either of two discrete methods for sample collection and processing. One of these involves addition of glycolysis inhibitors, such as sodium fluoride–potassium oxalate (NaF–KOx) to sample collection tubes, whereas the other requires immediate refrigeration and sample separation.
Aims
To examine whether the choice of the preanalytical process has any impact on subsequent glucose determinations.
Methods
62 healthy men participated in the study during screening for diabetes. Paired venous blood samples were collected in a serum‐gel tube and a tube containing NaF–KOx (both Sarstedt, Leicester, UK). Serum was promptly separated from gel tube samples and refrigerated, whereas NaF–KOx samples were not separated until immediately before analysis. Glucose concentrations were determined using an Olympus AU 2700 analyser incorporating an automated hexokinase method.
Results
Mean (95% CI) glucose concentration in serum‐gel tube samples was 5.2 mmol/l (5.0 to 5.4 mmol/l), whereas the concentration in tubes containing NaF–KOx was 4.9 mmol/l (4.8 to 5.1 mmol/l). A negative bias of 0.23 mmol/l (0.16 to 0.30 mmol/l) and relative negative bias of 4.7 % (3.2% to 6.3%) were observed for samples collected in NaF–KOx tubes, consistent with the combined effects of glycolysis and dilution.
Conclusions
Bias associated with the use of NaF–KOx tubes may have a significant impact on the prevalence of fasting hyperglycaemia, according to current diagnostic criteria. The small but significant difference between preanalytical processes should be considered when screening for the presence of diabetes mellitus.
The case definition for diabetes mellitus proposed by the American Diabetes Association and the World Health Organization (WHO) requires ⩾2 independent estimations of fasting plasma glucose concentration ⩾7.0 mmol/l (126 mg/dl), random plasma glucose concentration ⩾11.1 mmol/l (200 mg/dl) or 2 h post‐oral glucose tolerance test plasma glucose concentration ⩾11.1 mmol/l.1,2 If characteristic symptoms are present, such as polydipsia, polyuria, recurrent infections or unintentional weight loss, a single plasma glucose estimation that meets any of the above criteria is sufficient for diagnosis. In addition, patients who do not meet the definition of diabetes but who have 2 h post‐oral glucose tolerance test plasma concentrations ⩾7.8 mmol/l (140 mg/dl) meet the criteria for impaired glucose tolerance, whereas those with fasting plasma glucose concentrations ⩾6.1 mmol/l (110 mg/dl) have impaired fasting glycaemia. These precise diagnostic criteria have been incorporated into national and international guidelines.1,2,3 Therefore, the correct assignment of individuals to the most appropriate diagnostic category is critically dependent on the availability of accurate glucose measurements.
It has long been recognised that blood samples are subject to ex vivo glycolysis, which is enhanced by the presence of leucocytosis and diminished by sample refrigeration.4,5,6 Most researchers have concluded that addition of sodium fluoride to blood samples is capable, at least in part, of decreasing the ex vivo decline in glucose concentrations.7,8,9 Therefore, the use of sample tubes containing sodium fluoride has become increasingly established as a means of minimising ex vivo glycolysis in clinical practice, and is endorsed by WHO guidance.10 The WHO have stated that “Glucose concentrations should not be determined on serum unless red cells are immediately removed, otherwise glycolysis will result in an unpredictable underestimation of the true concentration. It should be stressed that glucose preservatives do not totally prevent glycolysis. If whole blood is used, the sample should be kept at 0–4°C or centrifuged immediately, or assayed immediately.”2 In the setting of early‐phase clinical research, immediate sample separation and refrigeration of blood collected in serum‐gel tubes is widely accepted as a standard preanalytical process before glucose measurement, and allows other variables to be determined using a single sample. However, in routine clinical practice, it is more difficult to achieve the exact requirements of early separation and refrigeration and, therefore, delayed separation of samples containing added sodium fluoride–potassium oxalate (NaF–KOx) is more widely adopted. It is unclear whether the choice between the different sample collection and processing methods might influence glucose concentrations obtained. The potential impact of preanalytical factors—for example, different sample collection methods—on glucose concentrations has received little attention. Even a small difference between methods might have an important impact in view of the precise diagnostic criteria offered by the WHO case definitions.
The present study was designed to compare glucose concentrations obtained using two different processes, and to assess whether this might influence the diagnostic case definition of diabetes. One method incorporated early separation of serum using gel tubes lacking any added glycolysis inhibitors, whereas the other involved addition of NaF–KOx to samples that did not undergo separation until immediately before analysis. The aim of this study was to determine whether the choice of the sample collection method and time to separation had any impact on subsequent glucose determinations.
Methods
Participants were invited to take part while undergoing screening for eligibility for entry to phase I clinical studies in the Clinical Pharmacology Unit (Roche Pharmaceuticals, Welwyn Garden City, UK). Participants fasted for at least 12 h before recruitment. Each person gave written informed consent after an explanation of what would happen. The protocol had been given prior approval by the local research ethics committee, and the study was conducted in accordance with the principles outlined in the current Declaration of Helsinki.
Inclusion criteria were healthy men, aged 18–60 years, who were taking no regular medications. Subjects were excluded if they were unwilling or unable to provide informed consent. Routine subject screening involved collection of blood into a 4.9 ml serum‐gel tube (Sarstedt, Leicester, UK) for measurement of glucose, electrolytes, liver biochemistry, creatinine and urate. For the purposes of the study, an additional 2.7 ml blood sample was collected into a tube containing 0.1 ml NaF–KOx (Sarstedt). All sample tubes were filled completely, in accordance with the manufacturer's instructions.
Samples were labelled with a unique study number identifiable only to the investigators, in accordance with a local standard operating procedure. Serum‐gel tubes were allowed to stand for 15 min, centrifuged at 2500 g for 15 min (Mistral 1000, Sanyo Biomedical, Loughborough, UK) and stored at 4°C until analysis. Samples collected in tubes containing NaF–KOx were not separated until immediately before analysis.
Assay
Samples were analysed by an accredited external reference laboratory (The Doctors Laboratory, London, UK). Glucose concentrations were measured using an Olympus AU 2700 analyser (Olympus UK, London, UK), incorporating an automated hexokinase method with ultraviolet detection at 340 nm. The laboratory has found the assay to be linear across a concentration range of 0.6–45.0 mmol/l (10–800 mg/dl), with coefficient of variation 3%.11
Data analysis
Data are presented as mean (95% CI) and, where appropriate, measurements were compared using paired two‐tailed Student's t tests. Non‐parametric linear regression analysis was used to evaluate the relationship between both preanalytical processes, and medians (95% CIs) for the slope were calculated using Kendall's rank correlation. Relative and absolute difference plots were constructed so that sources of difference between the preanalytical methods could be evaluated.12,13 Differences were calculated as NaF–KOx samples minus serum‐gel tube samples; serum‐gel tube values were used as comparator values for the absolute and relative difference plots because these would be expected to be less affected by dilution and glycolysis. To detect possible time‐dependent glycolysis, the lag time between sample collection and measurement was also examined. Significance was accepted at <0.05 in all cases.
Results
Paired samples were obtained from 62 healthy men, aged 38 years (95% CI 35 to 40 years), height 1.77 m (1.75 to 1.78 m), weight 80 kg (77 to 82 kg) and body mass index 25.4 kg/m2 (24.8 to 26.0 kg/m2). Data for all glucose samples were available for analysis.
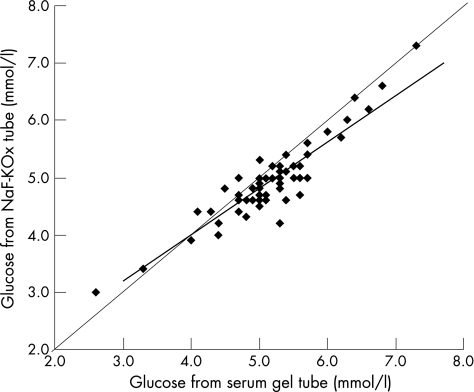
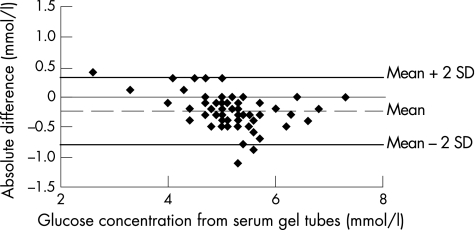
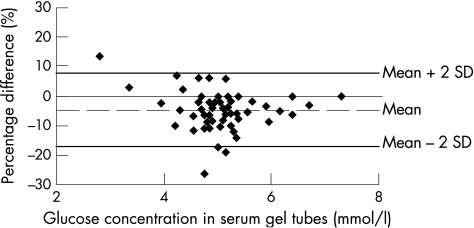
The glucose concentration in serum‐gel tubes was 5.2 mmol/l (5.0 to 5.4 mmol/l), and in NaF–KOx tubes was 4.9 mmol/l (4.8 to 5.1 mmol/l; p<0.001). Glucose concentrations obtained by both methods correlated strongly (median slope 0.81, 95% CI 0.69 to 0.92, p<0.001), and corresponded closely across the range of concentrations encountered in the study population (fig 1). The absolute difference between serum‐gel tubes and NaF–KOx tubes was 0.23 mmol/l (0.16 to –0.30 mmol/l; p<0.001), and relative difference was 4.7% (3.2% to 6.3%; p<0.001), as shown in figs 2 and 3, respectively.
Figure 1 Non‐parametric linear regression of sodium fluoride–potassium oxalate (NaF–KOx) method on serum‐gel tube method for glucose concentrations (both mmol/l). Median regression slope = 0.81 (95% CI 0.69 to 0.92), and best fit line y = 0.810x+0.768 shown in bold. Kendall's rank correlation coefficient τ b = 0.70 and two‐sided p<0.001. The line of equality (y = x) is also shown.
Figure 2 Absolute difference plot showing glucose concentrations from sodium fluoride–potassium oxalate method minus serum‐gel tube values versus serum‐gel tube values (mmol/l). The mean absolute difference (2SD) is also shown.
Figure 3 Relative difference plot showing glucose concentrations from sodium fluoride–potassium oxalate method minus serum‐gel tube values, as percentage, versus serum‐gel tube values (mmol/l). The mean percentage difference (2SD) is also shown.
The interval between sample collection and assay was 8.0 h (6.5 to 9.5 h), and the range was 1.5–28 h across the study population. The absolute difference between paired glucose measurements did not correlate with either the mean glucose concentration (median slope 0.00, 95% CI −0.01 to 0.02, p = 0.619) or the lag period between sample collection and analysis (median slope −0.10, 95% CI −0.22 to 0.00, p = 0.100).
Take‐home messages
Different preanalytical processes can have a significant impact on subsequent glucose determinations.
Addition of sodium fluoride to samples cannot be relied upon to completely negate ex vivo glycolysis.
Consideration should be given to the choice of preanalytical process adopted when deciding appropriate clinical action levels for glucose concentration.
Discussion
The key finding of this study was the small but significant bias towards lower glucose concentrations in samples collected in tubes containing NaF–KOx. This caused a mean absolute difference of 0.23 mmol/l and a relative difference of 4.7% between the preanalytical methods studied. The relative, or proportional, difference might, at least partly, arise from the dilutional effect of NaF–KOx in the collection tube; the presence of 0.1 ml NaF–KOx in a 2.7 ml sample would be expected to cause a 3.7% dilution effect. Similar findings have been reported by researchers working with veterinary specimens.14 However, a dilutional effect would not be expected to cause a systematic absolute difference across a range of different glucose concentrations and, by itself, is unlikely to fully explain the observed differences in this study.
Lower glucose concentrations obtained from the NaF–KOx tubes might also be explained by the effect of ex vivo glycolysis, because these samples underwent delayed separation from red blood cells. Previous work has shown that NaF–KOx fails to inhibit glycolysis for at least 1 h after addition to blood samples, and is only partially effective for up to 4 h, and thereafter able to effectively inhibit metabolism for up to 3 days.7 More extensive glycolysis inhibition can be achieved by adding higher concentrations of sodium fluoride, but even in the presence of up to 12 g/l it is not able to fully abolish glycolytic activity.15 Sample refrigeration and separation within 30 min are capable of preventing glycolysis despite addition of NaF–KOx to samples.16 In the present study, serum collected from gel tubes was promptly separated from cellular components and refrigerated, so that ex vivo glycolysis would have had less influence on glucose concentrations obtained by this method. This is in contrast with the delayed separation of clotted samples, where glucose concentrations decline beyond 2 h, with an hourly attrition of 0.6–1.1 mmol/l at 37°C and 0.3–0.6 mmol/l at room temperature.4,5,6,17
As expected in healthy young adults, the estimated population proportion with glucose concentrations ⩾7.0 mmol/l was low at 0.67% and 0.12% for serum‐gel tube and NaF–KOx tube samples, respectively. The latter proportion is similar to a previous estimate of 0.14% in an apparently healthy population.18 Population proportions estimated to have glucose concentrations ⩾6.1 mmol/l were 10.48% and 4.34%, respectively. The relevance of these findings to wider populations requires further confirmation. Nonetheless, if a similar bias was operating in larger populations screened for the presence of diabetes, then this would have a significant impact on numbers meeting current diagnostic criteria.
A key strength of the study was the availability of an established system of sample collection and processing that allowed rigorous adherence to the protocol, which is rarely feasible in the everyday clinical setting. However, a limitation of the study is that only a comparatively narrow range of glucose concentrations was available, as anticipated in an apparently healthy population. Furthermore, the interval between sample collection and analysis was comparatively short, and we cannot exclude the possibility that more significant glycolysis might occur after longer periods. A weakness of the protocol is that duplicate or triplicate sample measurements were not included to minimise the potential effect of analytical variability. Notwithstanding these limitations, the rapid processing of samples collected in serum‐gel tubes, as an existing practice in a research environment, seemed to be a more sensitive means of detecting hyperglycaemia than the use of NaF–KOx tubes.
Given that immediate refrigeration and early separation of serum are rarely feasible in the everyday clinical setting, the diagnosis of diabetes in routine healthcare is more likely to be based on measurements of samples collected in tubes containing NaF–KOx. Several strengths and weaknesses of different sample collection methods have been acknowledged; however, clinicians need to be made more aware of the discrepancies between existing preanalytical processes in order to evaluate the laboratory data more clearly. A more consistent approach in clinical practice by, for example, the standardised use of NaF–KOx tubes would encourage the consistency of clinical action limits and increase certainty over diagnostic criteria for diabetes and related conditions. Our findings indicate a bias between two separate preanalytical processes, which might otherwise have a significant impact on the detection and categorisation of these disorders.
Abbreviations
NaF–KOx - sodium fluoride–potassium oxalate
WHO - World Health Organization
Footnotes
Funding: The costs for this study were met from existing departmental funds held by the Clinical Pharmacology Unit, Roche Pharmaceuticals, Welwyn Garden City, UK.
Competing interests: None.
References
- 1.Sacks D B, Bruns D E, Goldstein D E.et al Guidelines and recommendations for laboratory analysis in the diagnosis and management of diabetes mellitus. Clin Chem 200248436–472. [PubMed] [Google Scholar]
- 2.World Health Organization, Department of Noncommunicable Disease Surveillance Definition, diagnosis and classification of diabetes mellitus and its complications. Part 1: diagnosis and classification of diabetes mellitus. Geneva: WHO, 1999, http://whqlibdoc.who.int/hq/1999/WHO_NCD_NCS_99.2.pdf (accessed 17 Apr 2007)
- 3.Genuth S, Alberti K G, Bennett P.et al Expert Committee on the Diagnosis and Classification of Diabetes Mellitus. Follow‐up report on the diagnosis of diabetes mellitus. Diabetes Care 2003263160–3167. [DOI] [PubMed] [Google Scholar]
- 4.Tolstoi E. Glycolysis in bloods of normal subjects and of diabetic patients. J Biol Chem 19246069 [Google Scholar]
- 5.Sunderman F W, Jr, Copeland B E, MacFate R P.et al Manual of American Society of Clinical Pathologists workshop on glucose. Am J Clin Pathol 1956261355–1372. [DOI] [PubMed] [Google Scholar]
- 6.le Roux C W, Wilkinson S D, Pavitt D V.et al A new antiglycolytic agent. Ann Clin Biochem 20044143–46. [DOI] [PubMed] [Google Scholar]
- 7.Chan A Y, Swaminathan R, Cockram C S. Effectiveness of sodium fluoride as a preservative of glucose in blood. Clin Chem 198935315–317. [PubMed] [Google Scholar]
- 8.Liss E, Bechtel S. Improvement of glucose preservation in blood samples. J Clin Chem Clin Biochem 199028689–690. [PubMed] [Google Scholar]
- 9.Clark M L, Humphreys S M, Frayn K N. Stability of plasma glucose during storage. Ann Clin Biochem 199027373–377. [DOI] [PubMed] [Google Scholar]
- 10.World Health Organization Use of anticoagulants in diagnostic laboratory investigation. Revision 2. Geneva: WHO, 2002, http://whqlibdoc.who.int/hq/2002/WHO_DIL_LAB_99.1_Rev.2.pdf (accessed 17 Apr 2007)
- 11.The Doctors Laboratory Quality Management Group http://www.tdlpathology.com/index.phpoption = com_content&task = view&id = 26&Itemid = 137 (Accessed 15 May 2007)
- 12.Twomey P J. How to use difference plots in quantitative method comparison studies. Ann Clin Biochem 200643124–129. [DOI] [PubMed] [Google Scholar]
- 13.Petersen P H, Stockl D, Blaabjerg O.et al Graphical interpretation of analytical data from comparison of a field method with reference method by use of difference plots. Clin Chem 1997432039–2046. [PubMed] [Google Scholar]
- 14.Christopher M M, O'Neill S. Effect of specimen collection and storage on blood glucose and lactate concentrations in healthy, hyperthyroid and diabetic cats. Vet Clin Pathol 20002922–28. [DOI] [PubMed] [Google Scholar]
- 15.Chan A Y, Ho C S, Cockram C S.et al Handling of blood specimens for glucose analysis. J Clin Chem Clin Biochem 199028185–186. [PubMed] [Google Scholar]
- 16.Stahl M, Jorgensen L G, Hyltoft Petersen P.et al Optimization of preanalytical conditions and analysis of plasma glucose. Impact of the new WHO and ADA recommendations on diagnosis of diabetes mellitus. Scand J Clin Lab Invest 200161169–179. [DOI] [PubMed] [Google Scholar]
- 17.Zhang D J, Elswick R K, Miller W G.et al Effect of serum‐clot contact time on clinical chemistry laboratory results. Clin Chem 1998441325–1333. [PubMed] [Google Scholar]
- 18.Jorgensen L G, Stahl M, Brandslund I.et al Plasma glucose reference interval in a low‐risk population. Impact of the new WHO and ADA recommendations on the diagnosis of diabetes mellitus. Scand J Clin Lab Invest 200161181–190. [DOI] [PubMed] [Google Scholar]


