

Abstract
The efficacy of ultrasound-assisted thrombolysis as an adjunct treatment of ischemic stroke is being widely investigated. To determine the role of ultrasound hyperthermia in the process of blood clot disruption, the acousto-mechanical and thermal properties of clotted blood were measured in vitro, namely, density, speed of sound, frequency-dependent attenuation, specific heat, and thermal conductivity. The amplitude coefficient of attenuation of the clots was determined for 120 kHz, 1.0 MHz, and 3.5 MHz ultrasound at room temperature (20±2 °C). The attenuation coefficient ranged from 0.10 to 0.30 Np/cm in porcine clots and from 0.09 to 0.23 Np/cm in human clots. The experimentally determined values of specific heat and thermal conductivity for porcine clotted blood are (3.2±0.5)×103 J/kg·K and 0.55±0.13 W/m·K, respectively, and for human clotted blood are (3.5±0.8)×103 J/kg·K and 0.59±0.11 W/m·K, respectively. Measurements of the acousto-mechanical and thermal properties of clotted blood can be helpful in theoretical modeling of ultrasound hyperthermia in ultrasound-assisted thrombolysis and other high-intensity focused ultrasound applications.
I. INTRODUCTION
An estimated 700 000 people experience a stroke in the U.S. every year, resulting in an aggregate lifetime cost of $56.8 billion (AHA, 2005). The only therapy for ischemic stroke that is approved by the FDA is the thrombolytic agent, recombinant tissue plasminogen activator (rt-PA). Recombinant t-PA is moderately effective in lysing thrombi in ischemic stroke patients and it improves neurologic deficits if given within three hours after the onset of stroke symptoms (Wolpert et al., 1993). Unfortunately, thrombolytics also can cause intracerebral hemorrhage. Thus adjuvant therapies that lower the rt-PA dose or increase its efficacy would represent a significant breakthrough (Polak, 2004). Experimental evidence has demonstrated that ultrasound used as an adjuvant to rt-PA can increase thrombus dissolution in an in vitro model (Shaw et al., 2001a, b, 2006; Holland et al., 2002). Mild heating of only a few degrees and mechanical effects, such as acoustic streaming, radiation force, cavitation, and accompanying microstreaming all could contribute to the enhanced thrombolysis.
Siddiqi et al. (1995) reported increased permeation of fibrinolytic enzymes into a fibrin gel due to pulsed ultrasound exposure at 1 MHz with an intensity of 2 W/cm2 and 50% duty cycle. The authors attributed the enhanced permeability to ultrasound-induced cavitation. Degassing the fluid in which the fibrin gel sample was immersed significantly reduced the effect of fibrinolysis.
Increased penetration of radiolabeled rt-PA into clots during 1-MHz insonation at 4 W/cm2 was observed by Francis et al. (1995; Francis, 2001). Ultrasound exposure increased the transport of rt-PA into the plasma clot resulting in deeper penetration. Cavitation has also been shown to be an important physical mechanism in the ultrasound-assisted thrombolysis (Everbach and Francis, 2000). Cavitation is thought to loosen the fibrin network, increase the penetration rate of the fibrinolytic agent, and create additional binding sites causing the fragmentation of the thrombus. However, other mechanisms were hypothesized to participate in the enhancement because the application of overpressure, which prevents the nucleation of inertial cavitation, did not completely remove the acceleration of thrombolysis.
Sakharov et al. (2000) provided evidence for streaming and heating during continuous wave ultrasound-enhanced lysis of plasma clots at 1 MHz. A temperature increase in the clot of a few degrees produced a twofold increase in lytic rate. This group attributed 30% of the effect of ultrasound-enhanced fibrinolysis to heating and the remaining 70% to microstreaming. The peak-to-peak pressure employed was 0.26 MPa and the corresponding time-averaged intensity was 2.3 W/cm2. Enhanced thrombolysis was also achieved by heating and mild stirring (without ultrasound exposure). There is general agreement that a temperature increase is only minimally responsible for accelerated thrombolysis (Dick et al., 1998; Francis et al., 1992; Lauer et al., 1992; Blinc et al., 1993; Harpaz et al., 1993; Olsson et al., 1994; Sakharov et al., 2000).
Suchkova et al. (2002) explored ultrasound-enhanced fibrinolysis at low kilohertz frequencies (27–100 kHz) in an attempt to minimize ultrasonic heating and concomitant adverse bioeffects. Significant enhancement of fibrinolysis was achieved, with the greatest effect observed at 27 kHz. The largest effect was observed with continuous-wave ultrasound. A significant acceleration of ultrasound fybrinolytic effect was also observed with peak intensity of 1 W/cm2 and duty cycles of 10% and 1%.
According to Cintas et al. (2004), the use of galactose-based microbubbles increased the ultrasound-assisted fibrinolytic effect during low- intensity, 2-MHz ultrasound exposure of whole human blood clots with rt-PA. After a bolus of a 0.2 mL 400 mg/ml of D-Galactose Palmitic Acid (Levovist®) was added to the closed-loop flow system containing a clot, the authors reported a 31% clot mass loss after 30 -min insonification at an intensity of 0.46 W/cm2 in the presence of rt-PA. Clots exposed to rt-PA alone exhibit only a 13.2% mass loss. These authors concluded that cavitation and microstreaming were the main mechanisms responsible for clot disruption and fragmentation. These effects may allow a deeper penetration of rt-PA into the clot which in turn exposes a larger percentage of the fibrin network to rt-PA.
An analytical model is being developed to determine the contribution of mild heating as a mechanism for the acceleration of the enzymatic activity of rt-PA during lysis using pulsed ultrasound over the frequency range of 120 kHz to 3.5 MHz. For such a computational model to be developed, the acousto-mechanical and thermal properties of clotted blood must be well characterized. Duck (1990) has collated an extensive literature on the physical properties of tissue, but the specific heat and thermal conductivity of clotted blood have not yet been explored. Therefore, experiments were conducted in vitro with porcine and human clots at room temperature to measure the density, specific heat, thermal conductivity, speed of sound, and attenuation over the frequency of 120 kHz to 3.5 MHz.
II. METHODS
A. In vitro clot model
The synergistic thrombolytic effect of rt-PA and 120-kHz ultrasound was assessed previously in vitro in a porcine clot model (Holland et al., 2002). To determine the thermal and acousto-mechanical properties of these clots, the same blood clot production protocol was followed, which was approved by the local institutional animal care and use committee. Whole blood clots were prepared by aliquoting 1.5 ml arterial porcine or venous human blood into the 8-mm inner diameter glass Vacutainer tubes, immersing the tubes in a 37 °C water bath for 3 h and storing the clots at 5 °C prior to use in comparative ultrasound and rt-PA studies, which ensured complete clot retraction. This type of clot is fairly similar to physiologic venous clots and avoids the alteration of the clot structure by employing anticoagulated blood and the addition of thrombin. Additional aliquots of blood from each pig or human were used to obtain a complete coagulation panel from Antech Diagnostics (Chicago, IL), including D-Dimer, A-PTT, fibrinogen and prothrombin time testing, as well as a complete blood count. Most pigs used as part of this study were found to be slightly anemic, with hematocrits in the range of 25% to 35%. Only donors with values in the range 10–900 ng/ml for the D-Dimer test, 10–25 s for A-PTT, 250–700 mg/dl for the fibrinogen concentration, and 9–13 s for prothrombin time were considered to be acceptable. The resulting clots were normally dark red in color, roughly cylindrical in shape with an average diameter of 7–10 mm, and with the typical mass about 0.5 g for each of them, shown in Fig. 1.
FIG. 1.

Photo of a blood clot sample. Whole blood clots were prepared from either fresh porcine or human blood by aliquoting 1.5 or 2.0 ml into 10-ml glass tubes (BD Vacutainer™, Franklin Lakes, NJ), immersing the tubes in a 37 °C water bath for 3 h and storing the clots at 5 °C for at least 3 days prior to assessment of the properties, which ensured complete clot retraction. The typical size of the clot samples was about 7–10 mm in diameter and the typical mass of each clot was about 0.5 g.
B. Density, calorimetric, and thermal conductivity measurements
For the measurements of clot density, the volume of the clots was determined using a fluid displacement method with an uncertainty of 0.08 cm3. A standard laboratory scale (E200, Mettler-Toledo, Inc., Columbus, OH), was used to assess the mass of each clot in physiologic saline at room temperature (22±2 °C) with an uncertainty of 0.01 g. The overall uncertainty in the density measurements was 0.02×10³ kg/m3. A total of 202 clots from 28 human subjects and a total of 336 porcine clots from 38 pigs were employed for the density and calorimetric measurements. Thus the influence of physiologic variability and experimental uncertainty were captured in the standard deviation of the density and calorimetric measurements.
Direct calorimetric measurements using calibrated E-type thermocouples (Omega Engineering, Inc., Stanford, CT) were performed to determine the specific heat of human and porcine clots relative to the specific heat of a standard fluid, physiological saline (0.9% sodium chloride solution). The experimental setup included two 236 ml Styrofoam® containers with insulating lids, which contained E-type thermocouples. Two digital thermometers (Model HH 506-R, Omega Engineering, Inc., Stanford, CT) with thermocouples attached to them were used to record temperatures within the containers throughout the experiment. The method of mixtures (Semat, 1953) was used to determine the heat capacity of the sample clots in saline held at an inital temperature of 6±1 °C and combined with a second aliquot of saline at room temperature (21±1 °C). The uncertainty in the temperature measurements was 0.06 °C and the uncertainty in the measurements of the clot mass was 0.01 g. The propagated error for the specific heat measurements in this case was 0.3×10³ J/kg·K.
The comparative steady-state method (Kreith and Black, 1980) was used for determination of the thermal conductivity of whole blood clots in the experimental apparatus shown in Fig. 2. The sample chamber is inserted between two 25×25×25 cm3 Plexiglas® water tanks held at two different temperatures, T1 and T2. A thermal gradient was thus created horizontally across the cylindrical experimental cell made of polyethylene-terephthalate glycol (PETG) containing both the clot sample and a fluid of known thermal conductivity, namely deionized, degassed water. PETG has a significantly higher coefficient of thermal conductivity (0.33 W/m·K) than air (0.024 W/m·K), thus allowing us to simplify the experimental setup to one-dimensional heat flow along the axis of the cylindrical cell. Six Luerlock® connectors were attached to the experimental cell as ports for positioning thermocouples and expunging air (four along the chamber containing clot and two along the chamber containing water). The diameter of the cylindrical chambers containing the standard fluid and clot sample was 11.2 mm. The length of the chamber containing the clot sample was 55 mm and the length of the chamber containing water was 35 mm. A 1.27-mm-thick copper membrane with high thermal conductivity separated the clot chamber from the chamber filled with water. The membrane was necessary to prevent contamination of the water from the sample chamber. Hypodermic, 0.29 -mm-diam T-type thermocouples (HYP1-30, Omega Engineering, Inc., Stanford, CT) were used to monitor the temperature at four different points along the chambers. Two stainless steel pistons of diameter 11.2 mm and length 80 mm provided thermal contact between the two water tanks and the sample chambers. This experimental design allowed the position of the thermocouple tips to be adjusted within the clot and the temperature drop at different locations along the clot to be measured. The magnitude of the thermal gradient between the tanks was approximately 5 °C which, given losses in the stainless steel pistons, corresponded to an approximate 1 to 1.5 °C thermal gradient across the clot sample.
FIG. 2.

Experimental apparatus for thermal conductivity measurements in blood clots.
To validate our method of measuring thermal conductivity, the sample chamber was filled with a fluid of known thermal conductivity, ethanol, as a test. A time period of an hour was required to allow the temperature gradients to stabilize in the sample chambers. The coefficient of thermal conductivity of the investigated substance (either clot or ethanol) was calculated from the following formula:
| (1) |
where λunknown is the thermal conductivity of the investigated substance, λw is the thermal conductivity of water, δT1=T2−T1 is the magnitude of the thermal gradient across the sample under investigation, L1 is the distance between the two thermocouples in the sample, δT2=T4−T3 is the thermal gradient across the water sample, and L2 is the distance between the two thermocouples in the water-filled chamber. The uncertainties in the measurements of temperature and distance were 0.06 °C and 0.2 mm, respectively. The propagated error in determination of the coefficient of thermal conductivity was 0.02 W/m·K. The thermal conductivity measured using ethanol as the investigational substance was 0.20±0.02 W/m·K, which compares favorably with the published value for the thermal conductivity of ethanol, 0.19 W/m·K (Kreith and Black, 1980).
The coefficient of thermal conductivity was determined in three 10-ml specimens of clots prepared according to the protocol described above. We recorded the thermal gradients in the clot samples at three different positions within the clots. The thermal conductivity of porcine and human clots was determined by employing Eq. (1), averaging the results of all nine experiments, and computing the standard deviation of the measurements.
C. Sound speed in clotted blood
We used an insertion pulse-echo method to measure the speed of sound in clotted blood. A polystyrene cuvette of 4.5 ml capacity and dimensions 12.5×12.5×46 mm3 (Curtin Matheson Scientific, Inc. Baltimore, MD) was immersed in a water tank and positioned within the focus of a 3.5-MHz transducer. Ultrasonic pulses were generated with a function generator (Model 33250, Agilent Technologies, Inc., Palo Alto, CA), amplified (Model AR 150LA, Ampifier Research, Souderton, PA), and monitored with an oscilloscope (LT372, LeCroy Corp., Chestnut Ridge, NY). The water tank was connected to the water thermostat (EX111, Neslab Instruments, Inc., Newington, NH). Experiments were conducted at two temperatures: 20 °C and 37 °C. The choice of the working frequency was determined by two factors. First, the axial resolution of the ultrasound measurement is dictated by the acoustic wavelength, the shorter the better. On the other hand, the choice of too high a frequency is limited by the attenuation in clot and cuvette walls, which were 6 mm apart.
The time delay between echoes reflected from the front face and far wall of the cuvette was used to determine the speed of sound at two temperatures, 20 °C and 37 °C. The pulse repetition period for all experiments was 10 ms which corresponds to a PRF of 100 Hz. The three-cycle pulse duration was 0.9 μs. First, we measured the time delays between echoes from the front and back walls of the cuvette when it was filled with water. By using the sound speed in water at 20 °C and 37 °C, 1482 and 1524 m/s, respectively, we determined the distance between two walls of the cuvette. After the water was drained, a blood clot was carefully put into the same cuvette and the time between echoes from the cuvette walls was measured. The speed of sound in the clot was calculated by dividing twice the distance between the cuvette walls by the measured time delay. Three human clot samples and three porcine clot samples were used and the mean and standard deviation were calculated. For validation of the technique, the cuvette was filled with ethanol instead of clotted blood and the measurements of the sound speed were carried out. The measured speed of sound in ethanol, 1200 m/s at 20 °C and 1150 m/s at 37 °C, agree well with the tabulated values of 1191 m/s at 20 °C and 1159 m/s at 37 °C (CRC, 1979).
D. Frequency-dependent attenuation
We employed an insertion loss method to measure the ultrasound attenuation in clotted blood (Hill et al., 2004). The measurements of the pressure amplitude attenuation coefficient were conducted in a Lucite™ water tank with dimensions of 68×55×55 cm3 filled with degassed and deionized water at 22±2 °C for three center frequencies: 120 kHz, 1 MHz, and 3.5 MHz. The sample holder, shown in Fig. 3, consisted of a Lucite™ frame which supported two acoustic windows (Tegaderm™, 3M Health Care, St. Paul, MN) sandwiching the clot sample in saline solution. Each clot was placed in the focal plane of one of the calibrated ultrasonic transducers. Two holders were employed in our experiments. The first had an opening diameter of 70 mm and was used for the 120-kHz experiments. The second had an opening diameter of 40 mm and was used for experiments at 1 and 3.5 MHz. In both cases the diameter of the openings was much bigger than the acoustic wavelength and the transducer beamwidth at the corresponding frequencies. No distortion of acoustic field due to diffraction of ultrasound was evident in the transverse beam profiles obtained when the clot sample was absent.
FIG. 3.
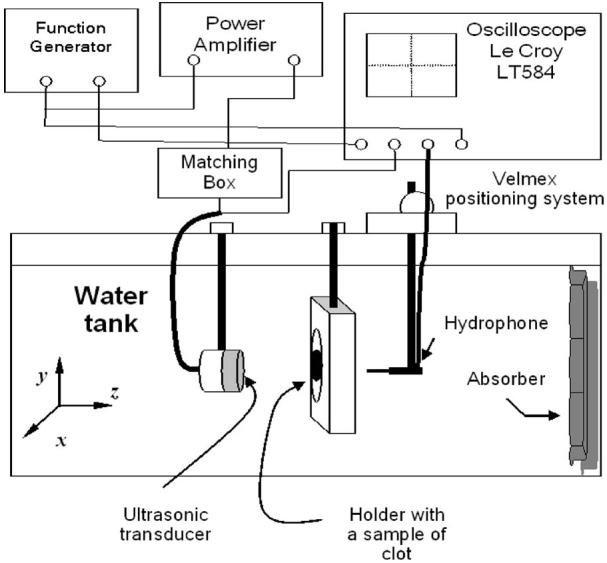
Experimental apparatus for the measurements of the amplitude attenuation coefficient in blood clots.
All transducers were preliminarily calibrated in a water tank at room temperature (20±1 °C). Their experimentally measured focal distance, focal depth, and beam width are presented in Table I. The focal distance and beamwidth for the 120-kHz transducer were 74 and 22 mm, respectively. The 1-MHz transducer focal distance was 94 mm and the beamwidth was 7 mm. The focal length for the 3.5-MHz transducer was 93 mm and the beamwidth was 2.5 mm. The transducers were driven by signals from a function generator (Agilent 33250) as shown in Fig. 3. For the experiments at 120 kHz, an Ultra Series 2021LF/HF linear amplifier (T&C Power Conversion Inc., Rochester, NY) with an accompanying 50-Ω impedance matching unit (Sonic Concepts, Inc., Woodinville, WA) amplified the driving signal. For the experiments at 1 and 3.5 MHz, an AR 150LA (Ampifier Research, Souderton, PA) with no additional impedance matching was utilized. At each frequency the pulse repetition period was 1 ms corresponding to a 1-kHz PRF and each tone burst contained 10 cycles. A TC4038 hydrophone (RESON, Inc., Goleta, CA) and a 0.2-mm needle hydrophone (HP 0.2-mm interchangeable probe, Precision Acoustics Ltd., Dorset, UK) were used to measure the peak-to-peak pressure amplitude, initially in the free field (without the clot) and subsequently with the clot in the transducer's focal plane. The position of the hydrophones in the water tank was computer controlled by a Velmex system with a stepping motor controller (NF 90 series, Velmex, Inc., Bloomfield, NY). A sheet of acoustic absorbing material (Aptflex F28, Precision Acoustics Ltd., Dorset, UK) was fixed on the far wall of the Plexiglas tank to prevent the reflection of acoustic waves.
TABLE I.
Characteristics of transducers and hydrophones used in the measurements of ultrasound attenuation in blood clots.
| Transducer frequency |
Hydrophone | Transducer aperture (cm) |
−3 dB beamwidth (cm) |
Focal distance (cm) |
|---|---|---|---|---|
| 120 kHz | TC4038, RESON, Inc., Goleta, CA |
6.14 | 2.2 | 7.4 |
| 1 MHz | Precision Acoustics 0.2 mm needle probe |
2.5 | 0.7 | 9.4 |
| 3.5 MHz | Precision Acoustics 0.2 mm needle probe |
1.9 | 0.25 | 9.3 |
By comparing the acoustic pressure amplitude at the same location in the free field with that from the intervening clot, the magnitude of the coefficient of attenuation was measured. The pressure amplitude coefficient of attenuation, μ, was determined using the following formula (Leighton, 1997):
| (2) |
where l is the length of clot along the ultrasound beam axis, Pfree(x, y) is the pressure amplitude in the focal plane of ultrasound transducer, Pclot(x, y) is the pressure amplitude at the same location after the clot was introduced into the acoustic field, and x and y are the transverse coordinates of the position of the hydrophone in the focal plane of transducer (Fig. 3). In our experiments, the thickness of clots ranged from 0.69 to 0.89 mm. The thickness was assessed with a calibrated caliper before placing the clot into the holder. The magnitude of the pressure amplitude was measured over the transverse beam profile using a temporal peak, spatial peak pressure output of 0.18 MPa for all three transducers. The transverse beam profile of the 120-kHz transducer with the presence and absence of the clot is shown in Fig. 4. The pressure amplitude attenuation coefficient for each frequency was determined by averaging the pressure reduction data within three blood clot samples by scanning the transverse beam profile along two perpendicular directions. The results of these measurements were averaged and the mean and the standard deviation were computed to assess the variability.
FIG. 4.

Beam profiles in the focal plane of the 120-kHz transducer. The decrease of the pressure amplitude (lower curve) was caused by the introduction of a clot sample into the acoustic field. The relative reduction of the acoustic pressure at the center of the beam was used to determine the amplitude coefficient of attenuation. Error bars represent the standard deviation of the measurements in three clots. The Tegaderm™ films used in the experiments do not cause a significant change of the pressure amplitude due to attenuation in the material of the film.
III. RESULTS
The clot densities were (1.08±0.02)×103 kg/m3 for human clots and (1.06±0.01)×103 kg/m3 for porcine clots. The speed of sound in porcine clots was 1547±1 m/s at 20 °C and 1577±2 m/s at 37 °C. The speed of sound in human clots was 1597±9 m/s at 20 °C and 1633±4 m/s at 37 °C.
The results for the measurements of amplitude attenuation coefficients in human and porcine clots with the corresponding standard deviations are presented in Table II. Their magnitudes vary between 0.10 and 0.3 Np/cm in porcine clots and between 0.09 and 0.23 Np/cm in human clots over the frequency range between 120 kHz and 3.5 MHz. A least squares fit to the acoustic attenuation data in both porcine and human clots shown in Fig. 5 demonstrates that the frequency dependence of the amplitude attenuation coefficient obeys approximately a one-third power law.
TABLE II.
Pressure amplitude attenuation coefficients in whole porcine and human blood clots.
| Frequency | Attenuation in clotted porcine blood (Np/cm) |
Attenuation in clotted human blood (Np/cm) |
|---|---|---|
| 120 kHz | 0.10±0.01 | 0.09±0.02 |
| 1 MHz | 0.17±0.02 | 0.17±0.02 |
| 3.5 MHz | 0.3±0.1 | 0.23±0.04 |
FIG. 5.
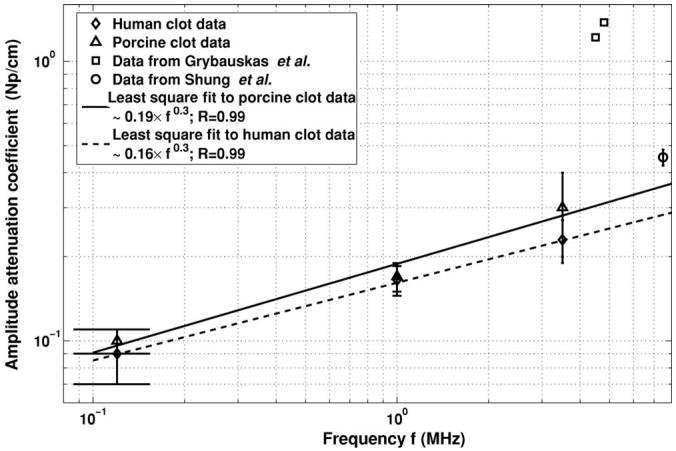
Frequency dependence of the pressure amplitude attenuation coefficient in blood clots. The solid and dashed lines refers to a least square fit of the data to the form μ=a·fb, where μ is the pressure amplitude attenuation coefficient, f is the center frequency, and the R values listed in the legend are the correlation coefficients and represent a goodness of fit.
The average magnitudes of the coefficients of specific heat of the human and porcine clots were (3.5±0.8)×103 J/kg·K and (3.2±0.5)×103 J/kg·K, respectively. The coefficient of thermal conductivity for porcine clots was 0.55 ± 0.13 W/m·K and for human clots was 0.59±0.11 W/m·K.
IV. DISCUSSION
An analysis of the results obtained should start with a look at the structure of clotted blood presented in Fig. 6. A formed blood clot has the same main constituents as whole blood: red cells (or erythrocytes), platelets, and fibrin fibers. Density, specific heat, and thermal conductivity for whole human blood can be found in the literature. The density reported to be 1.05×10³ to 1.6×10³ kg/m3, the specific heat is 3.61×10³ to 3.89×10³ J/kg·K, and the thermal conductivity 0.49 to 0.55 W/m·K (NCRP, 1992; Duck, 1990; Lehmann and DeLateur, 1982). Human red blood cells have a density of 1.093×10³ kg/m3 (Duck, 1990). Their specific heat is 3.21×10³ J/kg·K and thermal conductivity is 0.45–0.482 W/m·K (Toubal et al., 1999; Duck, 1990). Isolated fibrin fibers have density of 1.3×10³ kg/m3 (Mourad and Kargl, 2003). The normal value for the human blood hematocrit lies in the range of 39% to 52% (Alanen et al., 1985). For weanling (age 6 to 10 weeks) pig blood, the value of hematocrit ranges between 29% and 33% (Osborne and Meredith 1971) and is slightly anemic.
FIG. 6.
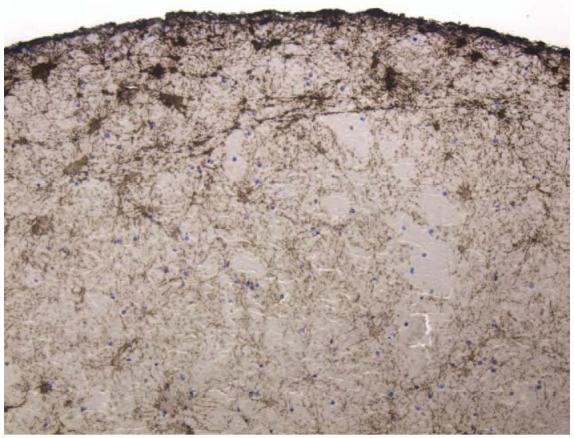
Photo of the cross section of a porcine clot, with 20× magnification stained with an antifibrinogen antibody (Dako Corp., Carpinteria, CA) which stains fibrin fibers brown (Datta, 2005).
It is helpful to compare the measured acousto-mechanical and thermal properties of clotted blood with other types of soft tissues. Typical values for the density of the human organs such as kidney, liver, and brain range between 1.04×10³ and 1.06×10³ kg/m3 (Lehmann and De Lateur 1982). Thus, the density of blood clots, (1.08±0.02)×103 kg/m3 for human clots and (1.06±0.01)×103 kg/cm3 for porcine clots, is consistent with the upper range of values for soft tissue densities. The coefficient of specific heat for brain is 3.68×10³ J/kg·K, for liver is 3.60×10³ J/kg·K, and for kidney is 3.89×10³ J/kg·K (Lehmann and De Lateur, 1982). The thermal conductivity of brain is 0.528 W/m·K, that of liver is 0.565 W/m·K, and that of kidney is 0.544 W/m·K (Lehmann and De Lateur 1982). Note that our data for the thermal properties of clotted blood are also within the range of values for soft tissues in the literature.
Our results of the measurements of sound speed in clotted blood compare favorably with previously published results (Grybauskas et al., 1978; Shung et al., 1984). Grybauskas et al. (1978) obtained an experimental value for sound speed in human blood clots of 1602 m/s that were 90 min old at 37 °C. Shung et al. (1984) measured a sound speed of 1590 m/s for human blood clots that were 1 h old at 23 °C. These investigators also noted an increase of sound speed with the age of the clot. Our measured value for the speed sound at 20 °C, 1597±9 m/s at 20 °C, agrees with these data.
Previously published data for the attenuation of ultrasound at 1 MHz in whole human blood are 0.017 Np/cm (Hoskins et al., 2003). Grybauskas et al. (1978) reports 1.22–1.38 Np/cm for the magnitude of absorption of ultrasound in the frequency range between 4.5 and 4.8 MHz. Shung et al. (1984) obtained 0.45 Np/cm for ultrasound attenuation in human clotted blood at 7.5 MHz. In our experiments, the attenuation of ultrasound in porcine and human clotted blood at 1 MHz was 0.17 Np/cm. If we compare the obtained results with the published ones, we see that the values obtained by Grybauskas et al. (1978) are significantly higher than the typical attenuation of ultrasound in soft tissues for this frequency range. These data are closer to the ultrasound attenuation in bone. On the other hand, our experimental results are in good agreement with the data presented by Shung et al. (1984).
The measured attenuation coefficients agree well with the published values for other types of soft biological tissues such as liver, kidney, and brain, which contain the same types of proteins. For example, the value of ultrasonic attenuation in liver is 0.17 Np/cm, in muscles is 0.2–0.25 Np/cm, and in brain is 0.12 Np/cm (Damask, 1978). All of them have the same order of magnitude of the amplitude attenuation coefficient. The attenuation of the ultrasound in clotted blood is influenced by ultrasonic absorption by macromolecules of the various proteins which constitute clot (NCRP, 1992).
A two-parameter least squares fit was performed on the attenuation data of the form μ=afb, where μ is the pressure amplitude attenuation coefficient and f is the center frequency. The power dependence, b, was 0.32 for porcine clots and 0.28 for human clots. In contrast to the linear dependence of attenuation on frequency, which is typical in many soft tissues, our results demonstrated an approximate one-third power dependence between 120 kHz and 3.5 MHz. The frequency dependence of attenuation in clotted blood is similar to the frequency dependence of ultrasound attenuation in lung (∼0.2 power), skeletal muscles (∼0.8 power), and skin (∼0.6 power) (Hill et al., 2004). Theoretical calculations of the frequency dependence of the acoustic absorption in whole clotted blood were reported by Mourad and Kargl (2003) and exhibited a 0.9 power dependence.
The standard deviation in the thermal conductivity and specific heat data reflects the natural variability of the physical properties of blood clots. The presence of air pockets, cavities, and the inhomogeneous fibrin structure in clots might also contribute to the standard deviation of the thermal conductivity and specific heat experimental results. The simple techniques used in this work may easily be employed to investigate other types of biological soft tissues.
V. CONCLUSIONS
The acousto-mechanical and thermal properties of the human and porcine clotted blood were determined experimentally and add to the knowledge base of the physical properties of clotted blood. The results obtained will allow us to make numerical estimates of a magnitude of the thermal elevation during ultrasound insonification of blood clots for enhanced thrombolysis and may be helpful in the development of high-intensity focused ultrasound and other therapeutic ultrasound applications.
Understanding the potential for thermal mechanisms involved in the interaction of ultrasound with blood thrombi during ultrasound-assisted thrombolysis is an important first step in improving thrombolytic efficacy while minimizing unwanted thermal bioeffects.
ACKNOWLEDGMENTS
The authors want to thank Sampada Vaidya, Jun Tan, Ashima Dhamija, and Nazli Bavani for the help in preparation of the blood clot samples. This research was supported by the National Institutes of Health, Grant No. NIH/NINDS R01-NS047603.
Footnotes
A portion of this work was presented in “Acousto-mechanical and thermal properties of clotted blood,” at the 149th meeting of the Acoustical Society of America, Vancouver, Canada, May 2005.
References
- Alanen A, Kormano M. Correlation of the ecogenisity and structure of clotted blood. J. Ultrasound Med. 1985;4:421–425. doi: 10.7863/jum.1985.4.8.421. [DOI] [PubMed] [Google Scholar]
- American Heart Association (AHA) Heart Disease and Stroke Statistics—2005 Update. American Heart Association; Dallas, TX: 2005. [Google Scholar]
- Blinc A, Francis CW, Trudnovski JL, Carstensen EL. Characterization of ultrasound-potentiated fibrinolysis in vitro. Blood. 1993;81:2636–2643. [PubMed] [Google Scholar]
- Cintas P, Nguen F, Boneu B, Larrue V. Enchancement of enzymatic fibrinolysis with 2-MHz ultrasound and microbubbles. J. Thrombosis Haemostasis. 2004;2:1163–1166. doi: 10.1111/j.1538-7836.2004.00746.x. [DOI] [PubMed] [Google Scholar]
- CRC . In: CRC Handbook of Chemistry and Physics. West Robert C., editor. CRC; Baca Ratan, FL: 1979. [Google Scholar]
- Damask AC. Medical Physics. Volume I: Physiological Physics, External Probes. Academic; New York: 1978. p. 215. [Google Scholar]
- Datta S, McAdory LE, Tan J, Holland CK. Cavitation detection during ultrasound-assisted thrombolysis in porcine blood clots. J. Acoust. Soc. Am. 2005;117:2558. [Google Scholar]
- Dick A, Neuerburg J, Schmitz-Rode T, Alliger H, Schmid-Schonbein H, Gunter RW. Thrombolysis of mural thrombus by ultrasound. An experimental in vitro study. Invest. Radiol. 1998;33:85–90. doi: 10.1097/00004424-199802000-00005. [DOI] [PubMed] [Google Scholar]
- Duck FA. Physical Properties of Tissue: A Comprehensive Reference Book. Academic; London: 1990. [Google Scholar]
- Everbach EC, Francis CW. Cavitational mechanisms in ultrasound-accelerated thrombolysis at 1 MHz. Ultrasound Med. Biol. 2000;26(7):1153–1160. doi: 10.1016/s0301-5629(00)00250-7. [DOI] [PubMed] [Google Scholar]
- Francis CW. Ultrasound-enhanced thrombolysis. Echocardiogr. 2001;18(3):239–246. doi: 10.1046/j.1540-8175.2001.00239.x. [DOI] [PubMed] [Google Scholar]
- Francis CW, Blinc A, Lee S, Cox C. Ultrasound accelerates transport of recombinant tissue plasminogen activator into clots. Ultrasound Med. Biol. 1995;21(3):419–424. doi: 10.1016/0301-5629(94)00119-x. [DOI] [PubMed] [Google Scholar]
- Francis CW, Onundarson PT, Carstensen EL, Blinc A, Meltzer RS, Schwarz K, Marder V. Enhancement of fibrinolysis in vitro by ultrasound. J. Clin. Invest. 1992;90:2063–2068. doi: 10.1172/JCI116088. [DOI] [PMC free article] [PubMed] [Google Scholar]
- Grybauskas P, Kundrotas K, Sukackas V, Jaronis E. Ultrasonic digital interferometer for investigation of blood coagulation. Ultrasonics. 1978;16(1):33–36. doi: 10.1016/0041-624x(78)90007-0. [DOI] [PubMed] [Google Scholar]
- Harpaz D, Chen X, Francis CW, Marder VJ, Meltzer RS. Ultrasound enhancement of thrombolysis and reperfusion in vitro. J. Am. Coll. Cardiol. 1993;21:1507–1511. doi: 10.1016/0735-1097(93)90331-t. [DOI] [PubMed] [Google Scholar]
- Hill CR, Bamber JC, ter Haar GR. Physical Principles of Medical Ultrasonics. Wiley; Chichester, England: 2004. p. 123. [Google Scholar]
- Holland CK, Vaidya SS, Coussios C-C, Shaw GJ. Thrombolytic effects of 120 MHz and 1 MHz ultrasound and tissue plasminogen activator on porcine whole blood clots. J. Acoust. Soc. Am. 2002;112:2370. [Google Scholar]
- Hoskins PR, Trush A, Martin K, Whittingham TA. Diagnostic Ultrasound. Physics and Equipment. GMM; London: 2003. [Google Scholar]
- Kreith F, Black WZ. Basic Heat Transfer. Harper and Row; New York: 1980. [Google Scholar]
- Lauer CG, Burge R, Tang DB, Bass BG, Gomez ER, Alving BM. Effect of ultrasound on tissue-type plasminogen activator-induced thrombolysis. Circulation. 1992;86:1257–1264. doi: 10.1161/01.cir.86.4.1257. [DOI] [PubMed] [Google Scholar]
- Lehmann JF, DeLateur BJ. Therapeutic Heat and Cold. Williams & Wilkins; Baltimore: 1982. [Google Scholar]
- Leighton TG. The Acoustic Bubble. Academic; London: 1997. p. 28. [Google Scholar]
- Mourad PD, Kargl SG. Technical Report of the Applied Physics Laboratory. University of Washington; 2003. Acoustic properties of fluid-saturated blood clots; p. 16. APL-UW TR 2003. [Google Scholar]
- National Council on Radiation Protection and Measurements (NCRP) NCRP Publications; Jun 1, 1992. Exposure criteria for medical diagnostic ultrasound: I. Cretiria based on thermal mechanisms; p. 35. (Report no. 113). [Google Scholar]
- Olsson SB, Johansson B, Nilsson AM, Olsson C, Roijer A. Enhancement of thrombolysis by ultrasound. Ultrasound Med. Biol. 1994;20:375–382. doi: 10.1016/0301-5629(94)90006-x. [DOI] [PubMed] [Google Scholar]
- Osborne JC, Meredith JH. Hematological values of the normal weanling piglet. Cornell Vet. 1971;61(1):13–23. [PubMed] [Google Scholar]
- Polak JF. Ultrasound energy and the dissolution of thrombus. N. Engl. J. Med. 2004;351(21):2154–2155. doi: 10.1056/NEJMp048249. [DOI] [PubMed] [Google Scholar]
- Sakharov DV, Hekkenberg RT, Rijken DC. Acceleration of fibrinolysis by high-frequency ultrasound. Thromb. Res. 2000;100(4):333–340. doi: 10.1016/s0049-3848(00)00319-4. [DOI] [PubMed] [Google Scholar]
- Semat H. Fundamentals of physics. Rinehart; New York: 1953. p. 275. [Google Scholar]
- Shaw GJ, Bavani N, Dhamija A, Lindsell CJ. Effect of mild hypothermia on the thrombolytic efficacy of 120 kHz enchanced thrombolysis in an in-vitro human clot model. Thromb. Res. 2006;117:603–608. doi: 10.1016/j.thromres.2005.05.005. [DOI] [PubMed] [Google Scholar]
- Shaw GJ, Hahn NL, Wagner KR, Kanter DS, Holland CK. Ultrasound assisted clot lysis for stroke therapy. J. Acoust. Soc. Am. 2001a;109:2456. [Google Scholar]
- Shaw GJ, Hahn NL, Wagner KR, Kanter DS, Holland CK. Ultrasound assisted thrombolysis in an in vitro clot model. Acad. Emerg. Med. 2001b;8:542. [Google Scholar]
- Shung KK, Fei DY, Yuan YW, Reeves WC. Ultrasonic characterization of blood during coagulation. J. Clin. Ultrasound. 1984;12(3):147–153. doi: 10.1002/jcu.1870120306. [DOI] [PubMed] [Google Scholar]
- Siddiqi F, Blinc A, Braaten J, Francis CW. Ultrasound increases flow through fibrin gels. Thromb. Haemostasis. 1995;73(3):495–498. [PubMed] [Google Scholar]
- Suchkova V, Carstensen EL, Francis CW. Ultrasound enhancement of fibrinolysis at frequencies of 27 to 100 kHz. Ultrasound Med. Biol. 2002;28(3):377–382. doi: 10.1016/s0301-5629(01)00522-1. [DOI] [PubMed] [Google Scholar]
- Toubal M, Asmani M, Radziszewski E, Nongaillard B. Acoustic measurement of compressibility and thermal expansion coefficient of erythrocytes. Phys. Med. Biol. 1999;44(5):1277–1287. doi: 10.1088/0031-9155/44/5/313. [DOI] [PubMed] [Google Scholar]
- Wolpert SM, Bruckmann H, Greenlee R, Wechsler L, Pessin MS, del Zoppo GJ. Neuroradiologic evaluation of patients with acute stroke treated with recombinant tissue plasminogen activator. AJNR Am. J. Neuroradiol. 1993;14(1):3–13. [PMC free article] [PubMed] [Google Scholar]