SYNOPSIS
Objectives.
Income data are often missing for substantial proportions of survey participants and these records are often dropped from analyses. To explore the implications of excluding records with missing income, we examined characteristics of survey participants with and without income information.
Methods.
Using statewide population-based postpartum survey data from the California Maternal and Infant Health Assessment, we compared the age, education, parity, marital status, timely prenatal care initiation, and neighborhood poverty characteristics of women with and without reported income data, overall, and by race/ethnicity/nativity.
Results.
Overall, compared with respondents who reported income, respondents with missing income information generally appeared younger, less educated, and of lower parity. They were more likely to be unmarried, to have received delayed or no prenatal care, and to reside in poor neighborhoods; and they generally appeared more similar to lower- than higher-income women. However, the patterns appeared to vary by racial/ethnic/nativity group. For example, among U.S.-born African American women, the characteristics of the missing-income group were generally similar to those of low-income women, while European American women with missing income information more closely resembled their moderate-income counterparts.
Conclusions.
Respondents with missing income information may not be a random subset of population-based survey participants and may differ on other relevant sociodemographic characteristics. Before deciding how to deal analytically with missing income information, researchers should examine relevant characteristics and consider how different approaches could affect study findings. Particularly for ethnically diverse populations, we recommend including a missing income category or employing multiple-imputation techniques rather than excluding those records.
Income is an important socioeconomic characteristic in health research. A strong association between income and health has repeatedly been observed across numerous health outcomes and populations,1–9 and efforts to examine social disparities in health rely heavily on measures of income. However, income data are often more difficult to obtain than information on other socioeconomic variables, such as educational attainment.10 In addition to a number of challenges in measuring income accurately (e.g., problems with recall or with assessing all sources of income over a given time period), respondents may refuse to provide income information because they consider it too private or sensitive or do not know their income.11
A non-negligible proportion of respondents in most large population-based surveys has missing income information. In general, survey data on income are missing for up to one-third of respondents, depending on factors such as the data collection method, the wording of the income question, and the population surveyed.12,13 For example, the nationally representative 2003 National Health Interview Survey (NHIS) had family income nonresponse rates (expressed as weighted percentages) ranging from 10% for a two-category value (less than $20,000, or $20,000 or more) to 33% for an “exact” value.14 The 2002 state-based Behavioral Risk Factor Surveillance System (BRFSS) had rates of missing income information (“don't know/not sure” or refused responses) ranging from 8% in California to 33% in Hawaii (mean 13.8%, median 12.6%).15
Researchers analyzing data typically handle missing income information in one of three ways: (1) excluding observations with missing income information, either by deleting the observations prior to analysis or by dropping them when statistical procedures include income; (2) using “missing information” as one of the income categories; or (3) using various techniques to impute income based on other individual- or geographic-level information on the participants.16–19 These methods, however, are often applied without careful consideration of their implications. Deleting observations with missing income results in less precise estimates due to decreased statistical power,20 and estimates may be biased if respondents with missing income are not a random subset of the original sample21 but instead are clustered within particular social subgroups, for example, by socioeconomic status/position (SES), race/ethnicity, and/or nativity.
A few studies have reported on the characteristics of survey participants with missing income information. Findings from an Australian national study that explored nonreporting of income within a population of adults who said they had incomes from at least one source13 suggested that individuals in higher SES groups were less likely to report income. In contrast, a Canadian study of adolescents found that those with missing household income information were less likely to reside in high-income neighborhoods.22 In the 1987 through 1994 NHIS, respondents with missing income information in general resembled lower SES individuals (based on educational attainment and occupational status), were older, and were more likely to live in socioeconomically disadvantaged neighborhoods, compared with those who reported income.23 A study on cardiovascular health behaviors among youths aged 12 to 21 years found that those with missing income information had higher smoking rates compared with those who reported income.24 Some evidence suggests that childbearing women with missing income information may be more likely to have unintended pregnancies, delayed or no prenatal care, and no intention to breastfeed.25–27
Taken together, these findings suggest that excluding records with missing income information from analyses may bias study results; however, we found no studies in the published literature that systematically examined how survey respondents with missing income information differ from others across a range of reported income levels with respect to other SES-related characteristics. To focus specifically on the implications of dropping income nonrespondents from analyses, we used data from a statewide population-based survey of postpartum California women that classified respondents into detailed income categories, and compared women with and without reported income data with respect to other SES-related individual- and neighborhood-level characteristics. California's rich cultural and ethnic diversity made it possible to make these comparisons both for the surveyed population overall and within groups defined by race/ethnicity and nativity.
METHODS
Data source
The Maternal and Infant Health Assessment (MIHA) is a population-based statewide survey of postpartum women conducted annually in California since 1999 through a collaborative effort of the California Department of Public Health's Maternal, Child, and Adolescent Health Program and researchers in the Department of Family and Community Medicine at the University of California, San Francisco. MIHA methods are modeled on the Pregnancy Risk Assessment and Monitoring System (PRAMS), a population-based postpartum survey developed by the Centers for Disease Control and Prevention (CDC). Each year, a stratified random sample of 5,000 postpartum women is identified for MIHA using birth certificates. African American women are oversampled because of particular concern about their adverse birth outcomes and to obtain an adequate sample size. The MIHA sample appears representative of California's maternity population; characteristics of sampled women (weighted to reflect the sampling frame) correspond closely with those of all women with live births statewide.
Women from the sample are mailed a self-administered survey; researchers attempt to contact and conduct phone interviews with women who do not respond by mail. Response rates overall have been 70% or higher annually. MIHA collects data on a wide range of sociodemographic variables, use of care, health-related behaviors and attitudes, and risk factors for adverse birth outcomes. The survey data are linked with birth certificates and with 2000 U.S. Census data to characterize the neighborhoods (defined here as census tracts) in which respondents resided at the time of delivery. Detailed information about MIHA has been published elsewhere25, 28–31 and is available at http://www.ucsf.edu/csdh. This study used MIHA survey data from 1999 to 2004 with a total of 21,269 respondents who completed the survey.
Variables
Income.
From among 20 detailed income categories (e.g., categories in the 2004 survey ranged from $0 to $12,000 and $12,001 to $15,000 at the lowest end to $99,001 to $111,000 and $111,001 or more at the highest end), each MIHA respondent was asked to choose the category that most closely matched her total family income during the calendar year preceding the index birth, including before-tax income from all sources (jobs, welfare, disability, unemployment, child support, interest, dividends, and support from family members). The detailed income categories were defined to correspond with cutoff values reflecting Federal Poverty Guidelines for family sizes from two to seven. If the respondent could not select one of the annual income categories, she was asked to provide her family's average monthly income during the previous calendar year and was then assigned to the corresponding annual income category. The midpoint for each income category and the number of people supported by that income were used to calculate each respondent's income as a percentage of the federal poverty level (FPL) corresponding to her family size.
Conforming with eligibility criteria for government-supported programs such as Medi-Cal (California's Medicaid) during pregnancy, family size included both the woman and her newborn baby. Income information was grouped into mutually exclusive categories defined by 100% increments of FPL: 0%–100%, 101%–200%, 201%–300%, 301%–400%, or 401% or more of FPL. Women who did not respond to either the income or the family size questions were categorized as having “missing income” (n=1,926). A few women (less than 25 over the six-year period) with implausible income responses (e.g., illogical monthly incomes given reported Medi-Cal or Women, Infants and Children [WIC] status) or women who could not be assigned to a percentage of the FPL category (due to family size greater than seven and incomes in the highest category) were also coded as missing income information.
Race/ethnicity/nativity.
Women's race or ethnic group and nativity are widely recognized as important social constructs with health consequences. Based on self-reported data on racial/ethnic groups from MIHA and on birthplace data from birth certificates, MIHA respondents were grouped into 10 mutually exclusive categories: African American/black U.S.-born; African American/black immigrant; Asian/Pacific Islander U.S.-born; Asian/Pacific Islander immigrant; European American U.S.-born; European American immigrant; Latina U.S.-born; Latina immigrant; American Indian; and other. Results are presented for the overall sample and each of nine race/ethnicity/nativity groups, excluding missing/unknown race/ethnicity/nativity (n=389, 1.8%); results for “other” race (n=337) are not displayed.
Maternal characteristics.
We examined several characteristics that have been strongly and consistently associated with SES among childbearing women:
Maternal age. Respondent's age at delivery (from birth certificate data) was grouped as 15–17, 18–19, 20–34, or 35 or more years of age; teen birth refers to births among women who were 15–19 years old.
Maternal education. The highest grade or year of school completed by the respondent (from MIHA data) was categorized into four mutually exclusive levels: less than high school graduate, high school graduate or General Educational Development (GED) certificate, attended some college without graduating, or college graduate.
Parity. The respondent's total number of live births including the index pregnancy (from birth certificate data) was grouped as 1, 2 to 4, or 5 or more total births.
Marital status. The respondent'sxs marital status at the time of the index birth (from MIHA data) was categorized as married or unmarried (living with someone as married but not legally married, separated/divorced/widowed, or never married).
Delayed or no prenatal care. Respondents who initiated prenatal care after the first trimester or had no prenatal care during the index pregnancy (from MIHA data) were categorized as having had delayed or no prenatal care.
Neighborhood poverty. Residential addresses from linked birth certificates were geocoded to the census tract level (approximately 4,000 to 8,000 people per tract) using Centrus Desktop software.32 Geocoding was successful at the census tract level for 97.5% of addresses. The proportion of residents living in poverty (at or below 100% of the FPL) in the woman's census tract of residence was obtained from the census data; women residing in a census tract with more than 20% of residents living in poverty were categorized as living in a poor neighborhood. Neighborhood poverty was available in MIHA for 1999 through 2003 only (n=17,725).
Statistical analyses
We first examined whether the proportion of women with missing income information varied with race/ethnicity/nativity and with each of the individual- and neighborhood-level SES-related characteristics in the overall sample, using Chi-square tests to assess statistical significance with an alpha level of 0.01 to account for multiple comparisons. We repeated this process for each race/ethnicity/nativity group separately.
Focusing next on four race/ethnicity/nativity groups where differences in characteristics between respondents with and without income information were most apparent, we examined the distributions within each group of five selected maternal characteristics (high school/GED or less education, mother's age at delivery less than 20 years, unmarried at delivery, delayed or no prenatal care, and living in a poor neighborhood) across six income categories (0%–100%, 101%–200%, 201%–300%, 301%–400%, 401% or more of the FPL, and missing income) in the group overall and comparing women with missing income information with women in each of the five reported income groups. Statistical significance was assessed with Chi-square tests.
Finally, to examine possible implications of excluding the missing-income group from analyses, we compared distributions of income and the other characteristics (which are widely established risk factors for a range of maternal and infant health outcomes) in the overall sample, including and excluding women with missing income information.
All reported results are weighted unless stated otherwise. All analyses were performed using SUDAAN software to address the effects of the weighting and clustered survey sampling design.33 Women with unknown maternal age (n=4, 0.02%), education (n=85, 0.41%), parity (n=12, 0.06%), marital status at delivery (n=120, 0.57%), and timing of prenatal care initiation (n=760, 3.64%) were excluded from the analyses.
RESULTS
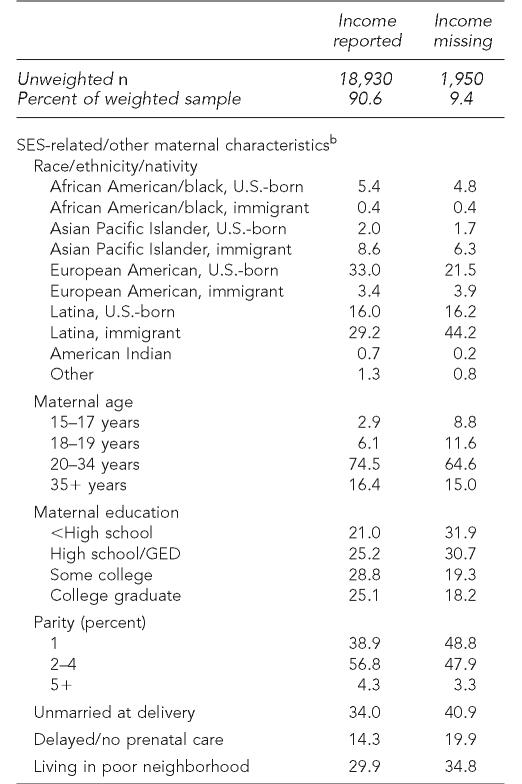
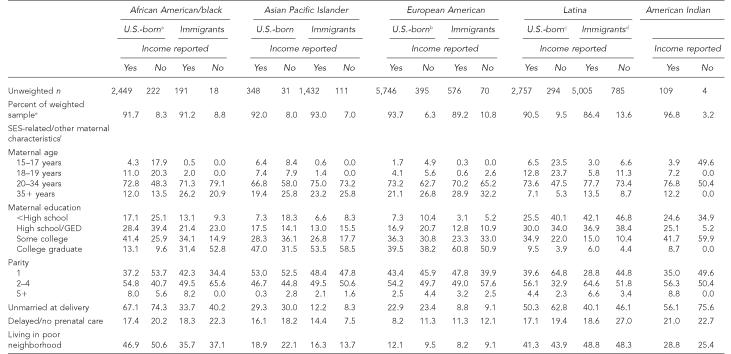
Income information was missing for 9.4% of MIHA respondents overall (Table 1), with significant variation across race/ethnicity/nativity groups, ranging from 3.2% among American Indians to 13.6% among Latina immigrants (Table 2). Significant differences were also evident in the overall sample comparing the selected maternal characteristics between women with and without income information (Table 1). Respondents with missing income appeared to be younger, less educated, and of lower parity, and were more likely to be unmarried, to have received delayed or no prenatal care, and to reside in poor neighborhoods. (While many of these differences may reflect the younger age of women in the missing-income group, most—with the exception of differences in marital status—were also apparent when we restricted the sample to women who were 20–34 years old [data not shown, available on request].) When examined separately by race/ethnicity/nativity, these general overall patterns were also observed among U.S.-born African American women and European American women and both U.S.-born and immigrant Latina women (Table 2).
Table 1.
Distributions of SES-related and other maternal characteristics, comparing respondents with reported income and those with missing income information,a MIHA, 1999–2004
Women with and without reported income differed significantly by each characteristic (p<0.0001).
Presented as column percentage
SES = socioeconomic status
MIHA = Maternal and Infant Health Assessment
GED = General Educational Development
Table 2.
Distributions of SES-related and other maternal characteristics, comparing respondents with reported income and those with missing income information, by race/ethnicity/nativity, MIHA, 1999–2004
Women with and without reported income differed significantly by maternal age, education, and parity (p<0.0001).
Women with and without reported income differed significantly by maternal age (p<0.0001).
Women with and without reported income differed significantly by maternal age, education, parity, and marital status (p<0.0001).
Women with and without reported income differed significantly by maternal age (p<0.0001), education (p<0.001), parity (p<0.0001), marital status (p<0.01), and timing of prenatal care initiation (p<0.001).
Percent of weighted sample differed significantly by race/ethnicity/nativity groups (p<0.0001).
Presented as column percentage
SES = socioeconomic status
MIHA = Maternal and Infant Health Assessment
GED = General Educational Development
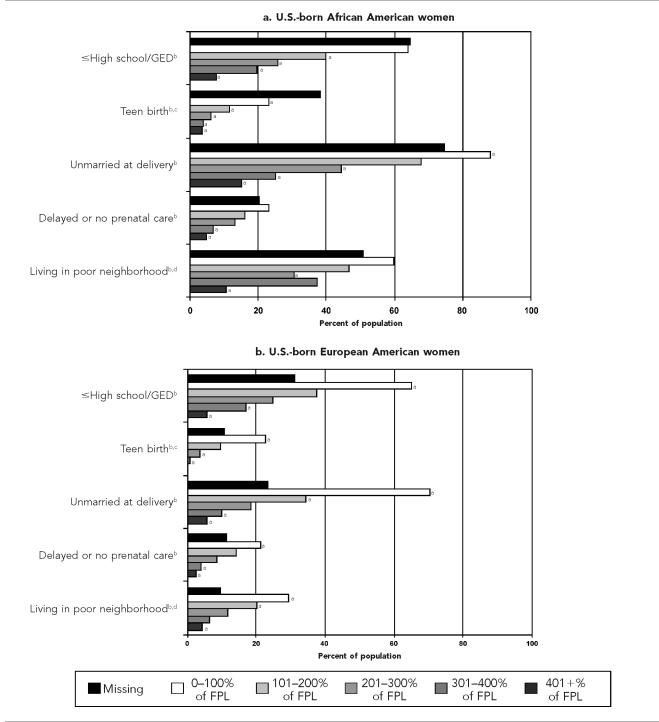
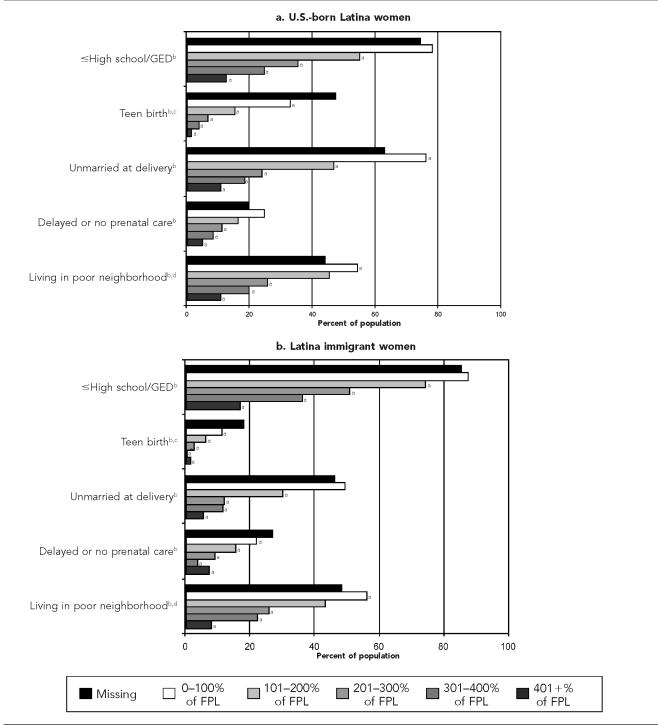
Focusing on the four race/ethnicity/nativity groups (U.S.-born African Americans, U.S.-born European Americans, U.S.-born Latinas, and Latina immigrants) in which women with and without income information appeared most different, we found that income was generally related to the other characteristics in expected ways (Figures 1 and 2). In most cases, the prevalence of the examined risk factors decreased with increasing income, illustrating an apparent inverse income gradient in risk profile. Figures 1 and 2 also illustrate where the prevalence of a specific characteristic observed among women with missing income information appears to fall on the gradient. Among U.S.-born African American women (Figure 1, Panel a) and both U.S.-born and immigrant Latinas (Figure 2, Panels a and b, respectively), the prevalences of risk characteristics among women with missing income generally were most similar to those observed among poor and near-poor women. Among U.S.-born European American women, however, women with missing income information appeared to more closely resemble the moderate-income groups (Figure 1, Panel b). In each of the four race/ethnicity/nativity groups, however, rates of every risk characteristic were significantly higher among women with missing income compared with women in the highest income group.
Figure 1.
Selected maternal characteristics of childbearing women by income group among four race/ethnicity/nativity groups, Maternal and Infant Health Assessment, 1999–2004
a Significantly different from missing-income group (p<0.01)
b Significant variation across income groups, based on overall Chi-square (p<0.0001)
c 15–19 years old at delivery
d More than 20% of residents with incomes below Federal Poverty Level
FPL = Federal Poverty Level
GED = General Educational Development
Figure 2.
Selected maternal characteristics of childbearing women by income group among race/ethnicity/nativity groups, Maternal and Infant Health Assessment, 1999–2004
a Significantly different from missing-income group (p<0.01)
b Significant variation across income groups, based on overall Chi-square (p<0.0001)
c 15–19 years old at delivery
d More than 20% of residents with incomes below Federal Poverty Level.
FPL = Federal Poverty Level
GED = General Educational Development
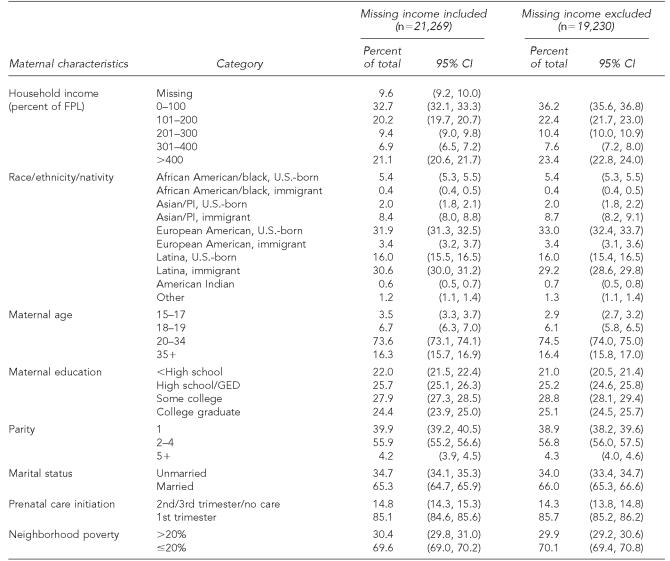
Table 3 shows the distributions of income and SES-related characteristics in the samples with and without inclusion of women with missing income information. In addition to differences in the income distributions of the two samples, differences were also evident in the proportions of Latina immigrants, mothers aged 15 to 17 years, and women with less than high school education.
Table 3.
Distributions of income and other maternal characteristics, comparing samples in which women with missing income information were included or excluded; MIHA, 1999–2004
MIHA = Maternal and Infant Health Assessment
CI = confidence interval
FPL = Federal Poverty Level
PI = Pacific Islander
GED = General Educational Development
DISCUSSION
The results presented here reveal that women with missing income information do not represent a random sample of the total maternity population in California. The findings refute a common assumption that survey respondents with missing income information are likely to be higher-income individuals who refuse to report their incomes because of confidentiality concerns.13,34 For most of the characteristics we examined, MIHA respondents with missing income information more closely resembled income-reporting women in the most vulnerable socioeconomic groups, both in the overall sample and within particular racial/ethnic/nativity groups. Among U.S.-born African American women and both U.S.-born and immigrant Latinas, the maternal characteristics of the missing-income group were similar to—or indicated even more adverse social risk profiles than—those of women in the lowest reported income groups.
These findings suggest that potentially serious bias may occur when researchers exclude survey respondents with missing income information from analyses before considering their other characteristics. We found, for example, that excluding MIHA respondents with missing income data would lead to underestimates of the proportion of women (and thus their characteristics and associated outcomes) in more vulnerable groups. The number of records involved is not negligible. Nearly one in 10 MIHA respondents in this six-year sample did not report income information, either because she chose not to answer the income question or because she did not know her family income. This proportion is similar to that seen among respondents in other statewide population-based postpartum surveys: for example, among PRAMS survey respondents in 17 states during 2000–2001, income information was missing for 11.7% (Braveman et al., unpublished findings).
The potential bias of excluding participants with missing incomes is not limited to surveys of postpartum women. In ancillary analyses of BRFSS data from 2004 examining shifts in overall distributions of key demographic and socioeconomic characteristics, excluding respondents with missing income information resulted in underestimation of the relative proportions of respondents in younger (18–24 years) and older (>65 years) age groups and in the group that had not completed high school. This exclusion also led to an overestimation of the proportion of college graduates (data not shown, available upon request).
Income is only one dimension of socioeconomic position; educational attainment, occupation, and accumulated wealth, for example, are also important. Income can vary over time, and measuring income at one point in time may not capture potentially important health effects of income dynamics. Accumulated wealth can buffer temporary income changes, and wealth varies markedly across different racial/ethnic and other social groups.34,35 Despite these limitations, measuring income is important and inaccurate estimates of income distributions could affect a wide range of research findings.
Given additional challenges inherent to income measurement, such as frequently high refusal rates and under- or overreporting of income, efforts are needed to improve the quality as well as response rates for income measures in surveys. Income questions in MIHA were developed carefully to permit estimation of a range of poverty status categories, including more categories than have generally been studied in other population-based U.S. surveys. We thus had a unique opportunity using MIHA data to compare the characteristics of survey respondents who had missing income information with those of women across a range of income levels, both in the overall sample and within race/ethnicity/nativity groups.
CONCLUSION
In conclusion, state-representative postpartum respondents in California with missing income information do not appear to be a random sample of all income groups in the survey population. In addition to reducing statistical efficiency, excluding respondents with missing income information from analyses (whether or not income is a variable of interest) can also bias results. This can present a serious problem in public health research that informs resource allocations and policy decisions, particularly if—as found here for the overall sample and among U.S.-born African American women and Latinas—those with missing income information are characterized by greater social disadvantage.
We recommend that researchers, at minimum, carefully examine characteristics of respondents with missing income information before deciding how to address their records analytically. Unless those preliminary comparisons show that the group with missing income information is likely to be a random sample of the entire study population, we recommend routinely including a separate income category of respondents with missing income information in all analyses or employing a multiple-imputation methodology to ensure that their other characteristics are reflected in study conclusions as well as to obtain more accurate estimates of income distributions. These concerns related to missing information may extend to other variables when (1) the variable is likely to be associated with the outcome of interest, (2) information is missing for a substantial proportion of subjects overall, and (3) individuals with missing information are differentially distributed across subgroups defined by other important variables in the study.
Acknowledgments
When most of this work was conducted, Dr. Kim was a Kellogg Scholar in Health Disparities whose effort was funded by the Kellogg Scholars in Health Disparities Program. The data source (Maternal and Infant Health Assessment) is a collaborative effort of the authors with the California Department of Public Health's Maternal, Child, and Adolescent Health Program, supported by Title V funds administered by the Maternal and Child Health Bureau, Health Resources and Services Administration. The efforts of Drs. Egerter, Cubbin, and Braveman were supported by Cooperative Agreement TS-842 from the Centers for Disease Control and Prevention to the Center on Social Disparities in Health at the University of California, San Francisco.
REFERENCES
- 1.Lantz PM, House JS, Lepkowski JM, Williams DR, Mero RP, Chen J. Socioeconomic factors, health behaviors, and mortality: results from a nationally representative prospective study of US adults. JAMA. 1998;279:1703–8. doi: 10.1001/jama.279.21.1703. [DOI] [PubMed] [Google Scholar]
- 2.McDonough P, Duncan GJ, Williams D, House J. Income dynamics and adult mortality in the United States, 1972 through 1989. Am J Public Health. 1997;87:1476–83. doi: 10.2105/ajph.87.9.1476. [DOI] [PMC free article] [PubMed] [Google Scholar]
- 3.Rao SV, Schulman KA, Curtis LH, Gersh BJ, Jollis JG. Socioeconomic status and outcome following acute myocardial infarction in elderly patients. Arch Intern Med. 2004;164:1128–33. doi: 10.1001/archinte.164.10.1128. [DOI] [PubMed] [Google Scholar]
- 4.Backlund E, Sorlie PD, Johnson NJ. The shape of the relationship between income and mortality in the United States. Evidence from the National Longitudinal Mortality Study. Ann Epidemiol. 1996;6:12–20. doi: 10.1016/1047-2797(95)00090-9. [DOI] [PubMed] [Google Scholar]
- 5.Avendano M, Kunst AE, van Lenthe F, Box V, Valkonen T, Cardano M, et al. Trends in socioeconomic disparities in stroke mortality in six European countries between 1981–1985 and 1991–1995. Am J Epidemiol. 2005;161:52–61. doi: 10.1093/aje/kwi011. [DOI] [PubMed] [Google Scholar]
- 6.Stansfeld SA, Head J, Marmot MG. Explaining social class differences in depression and well-being. Soc Psychiatry Psychiatr Epidemiol. 1998;33:1–9. doi: 10.1007/s001270050014. [DOI] [PubMed] [Google Scholar]
- 7.Mackenbach JP, Martikainen P, Looman CW, Dalstra JA, Kunst AE, Lahelma E. The shape of the relationship between income and self-assessed health: an international study. Int J Epidemiol. 2005;34:286–93. doi: 10.1093/ije/dyh338. [DOI] [PubMed] [Google Scholar]
- 8.Lannin DR, Mathews HF, Mitchell J, Swanson MS, Swanson FH, Edwards MS. Influence of socioeconomic and cultural factors on racial differences in late-stage presentation of breast cancer. JAMA. 1998;279:1801–7. doi: 10.1001/jama.279.22.1801. [DOI] [PubMed] [Google Scholar]
- 9.Lowry R, Kann L, Collins JL, Kolbe LJ. The effect of socioeconomic status on chronic disease risk behaviors among US adolescents. JAMA. 1996;276:792–7. [PubMed] [Google Scholar]
- 10.Stewart J. Economic status. John D. and Catherine T. MacArthur Research Network on Socioeconomic Status and Health. 2002. [cited 2007 Jul 18]. Available from: URL: http://www.macses.ucsf.edu/Research/Social%20Environment/notebook/economic.html.
- 11.Davern M, Rodin H, Beebe TJ, Call KT. The effect of income question design in health surveys on family income, poverty and eligibility estimates. Health Serv Res. 2005;40:1534–52. doi: 10.1111/j.1475-6773.2005.00416.x. [DOI] [PMC free article] [PubMed] [Google Scholar]
- 12.Moore J, Stinson LL, Wekbuaj EJJ. Income measurement error in surveys. J Official Statistics. 2000;16:331–61. [Google Scholar]
- 13.Turrell G. Income non-reporting: implications for health inequalities research. J Epidemiol Comm Health. 2000;54:207–14. doi: 10.1136/jech.54.3.207. [DOI] [PMC free article] [PubMed] [Google Scholar]
- 14.Schenker N, Raghunathan TE, Chiu P, Makuc DM, Zhang G, Cohen AG. Multiple imputation of family income and personal earnings in the National Health Interview Survey: methods and examples. National Center for Health Statistics, University of Michigan; 2005. [Google Scholar]
- 15.National Center for Chronic Disease Prevention and Health Promotion. Behavioral Risk Factor Surveillance System technical information and data: 2002 summary data quality report. 2005. [cited 2007 Jul 18]. Available from: URL: http://www.cdc.gov/brfss/technical_infodata/2002QualityReport.htm.
- 16.Greenland S, Finkle WD. A critical look at methods for handling missing covariates in epidemiologic regression analyses. Am J Epidemiol. 1995;142:1255–64. doi: 10.1093/oxfordjournals.aje.a117592. [DOI] [PubMed] [Google Scholar]
- 17.Rubin DB, Schenker N. Multiple imputation in health-care databases: an overview and some applications. Stat Med. 1991;10:585–98. doi: 10.1002/sim.4780100410. [DOI] [PubMed] [Google Scholar]
- 18.Vach W, Schumacher M. Logistic regression with incompletely observed categorical covariates: a comparison of three approaches. Biometrika. 1993;80:353–62. [Google Scholar]
- 19.Groves RM, Dillman DA, Eltinge JL, Little RJA. Survey nonresponse. New York: John Wiley & Sons, Inc.; 2002. [Google Scholar]
- 20.Little R. Regression with missing X's: a review. J Am Stat Assoc. 1992;82:1227–37. [Google Scholar]
- 21.Vach W, Blettner M. Biased estimation of the odds ratio in case-control studies due to the use of ad hoc methods of correcting for missing values for confounding variables. Am J Epidemiol. 1991;134:895–907. doi: 10.1093/oxfordjournals.aje.a116164. [DOI] [PubMed] [Google Scholar]
- 22.Potter BK, Speechley KN, Gutmanis IA, Campbell MK, Koval JJ, Manuel D. A comparison of measures of socioeconomic status for adolescents in a Canadian national health survey. Chronic Dis Can. 2005;26:80–9. [PubMed] [Google Scholar]
- 23.Winkleby MA, Cubbin C. Influence of individual and neighborhood socioeconomic status on mortality among black, Mexican-American, and white women and men in the United States. J Epidemiol Comm Health. 2003;57:444–52. doi: 10.1136/jech.57.6.444. [DOI] [PMC free article] [PubMed] [Google Scholar]
- 24.Lee RE, Cubbin C. Neighborhood context and youth cardiovascular health behaviors. Am J Public Health. 2002;92:428–36. doi: 10.2105/ajph.92.3.428. [DOI] [PMC free article] [PubMed] [Google Scholar]
- 25.Cubbin C, Braveman PA, Marchi KS, Chavez GF, Santelli JS, Gilbert BJ. Socioeconomic and racial/ethnic disparities in unintended pregnancy among postpartum women in California. Matern Child Health J. 2002;6:237–46. doi: 10.1023/a:1021158016268. [DOI] [PubMed] [Google Scholar]
- 26.Braveman P, Cubbin C, Marchi K, Egerter S, Chavez G. Measuring socioeconomic status/position in studies of racial/ethnic disparities: maternal and infant health. Public Health Rep. 2001;116:449–63. doi: 10.1093/phr/116.5.449. [DOI] [PMC free article] [PubMed] [Google Scholar]
- 27.Braveman PA, Egerter SA, Cubbin C, Marchi KS. An approach to studying social disparities in health and health care. Am J Public Health. 2004;94:2139–48. doi: 10.2105/ajph.94.12.2139. [DOI] [PMC free article] [PubMed] [Google Scholar]
- 28.Chung EK, Hung YY, Marchi K, Chavez GF, Braveman P. Infant sleep position: associated maternal and infant factors. Ambul Pediatr. 2003;3:234–9. doi: 10.1367/1539-4409(2003)003<0234:ispama>2.0.co;2. [DOI] [PubMed] [Google Scholar]
- 29.Galbraith AA, Egerter SA, Marchi KS, Chavez G, Braveman PA. Newborn early discharge revisited: are California newborns receiving recommended postnatal services? Pediatrics. 2003;111:364–71. doi: 10.1542/peds.111.2.364. [DOI] [PubMed] [Google Scholar]
- 30.Heck KE, Schoendorf KC, Chavez GF, Braveman P. Does postpartum length of stay affect breastfeeding duration? A population-based study. Birth. 2003;30:153–9. doi: 10.1046/j.1523-536x.2003.00239.x. [DOI] [PubMed] [Google Scholar]
- 31.Braveman PA, Cubbin C, Egerter S, Chideya S, Marchi KS, Metzler M, et al. Socioeconomic status in health research: one size does not fit all. JAMA. 2005;294:2879–88. doi: 10.1001/jama.294.22.2879. [DOI] [PubMed] [Google Scholar]
- 32.Pitney Bowes Group 1 Software. Lanham (MD): Pitney Bowes Group 1 Software; 2004. Centrus Desktop (Enhanced): Version 4.02.00. [Google Scholar]
- 33.Research Triangle Institute. SUDAAN: Version 9.0. Research Triangle Park (NC): Research Triangle Institute; 2004. [Google Scholar]
- 34.Krieger N, Williams DR, Moss NE. Measuring social class in US public health research: concepts, methodologies, and guidelines. Annu Rev Public Health. 1997;18:341–78. doi: 10.1146/annurev.publhealth.18.1.341. [DOI] [PubMed] [Google Scholar]
- 35.Berkman L, Macintyre S. The measurement of social class in health studies: old measures and new formulations. In: Kogevinas M, Pearce N, Susser M, Boffetta P, editors. Social inequalities and cancer. Lyon (France): IARC Scientific Publications; 1997. [PubMed] [Google Scholar]


