

Abstract
The Receptor for Activated C-Kinase 1 (RACK1) is a conserved scaffold protein that helps regulate a range of cell activities including cell growth, shape, and protein translation. We report that a homologue of RACK1 is required for cytokinesis in pathogenic Trypanosoma brucei. The protein, referred to as TRACK is comprised of WD repeat elements and can complement cpc2 null mutants of Schizosaccharomyces pombe. TRACK is expressed throughout the trypanosome life cycle and is distributed predominantly in a perinuclear region and the cytoplasm, but not along the endoplasmic reticulum, mitochondrion or cleavage furrow of dividing cells. When tetracycline inducible RNA interference (RNAi) is used to deplete the cellular content of TRACK, the cells remain metabolically active, but growth is inhibited. In bloodstream forms (BF), growth arrest is due to a delay in the onset of cytokinesis. By contrast, procyclic forms (PF) are able to initiate cytokinesis in the absence of TRACK, but arrest midway through cell cleavage. The RNAi cells undergo multiple rounds of partial cytokinesis and accumulate nuclei, and cytoplasmic extensions with attached flagella. The TRACK RNAi construct is also inducible within infected mice. Under these conditions parasites are eliminated from peripheral blood within three days post-infection. Taken as a whole, these data indicate that trypanosomes utilize a RACK1 homologue to regulate the final stages of mitosis. Moreover, disrupting the interaction between TRACK and its partners might be targeted in the design of novel therapies.
Keywords: RACK1, Cpc2, cytokinesis, Trypanosoma brucei, mitosis, cell cycle
INTRODUCTION
African trypanosomes are protozoan parasites that produce lethal infections in humans and livestock throughout sub-Saharan Africa. Trypanosomes have a complex life cycle that involves changes in morphology, biochemistry and gene expression as the cells pass through a variety of different environments. Signal cascades are predicted to mediate complex life cycle events and initiate rapid changes in cell behavior. It is hypothesized that ablation of a signal, or induction of an inappropriate signal will be lethal to these cells. From past experiments, it is clear that trypanosomes have the potential to propagate signals involving Ca2+, cyclic nucleotides, eicosanoic acid and phosphoryl transfer (1–4). However, in stark contrast with mammalian cells, where complex interacting signal networks have been described, a simple signal pathway has yet to be identified in T. brucei. To remedy this situation, we began to study a putative signal anchor protein and the pathways it regulates.
In general, anchor proteins help provide spatial organization to the signal process by allowing the formation of multimeric complexes at the appropriate location in the cell (5). Additionally, association with different anchors allows some signal kinases to participate in and distinguish between multiple pathways. The Receptor for Activated C-Kinase-1 (RACK1)1 is a WD repeat protein that forms ternary complexes with a range of signal proteins (reviewed in 6). Target proteins interact with RACK1 through SH2 domains, PH domains, C2 domains, or specific sequences (7–9). RACK1 serves to recruit signal proteins to specific membrane sites (10–15), to the cytoskeleton (16, 17) or to the 40S ribosome (18–22). In yeast, all of the RACK1 function may result from its association with the ribosome (18), whereas the situation in other cell types appears to be more complex. In mammalian cells, RACK1 can shift location to the nucleus (9, 23) or plasma membrane (10–15) and associate with a wide range of partners, making it unlikely that all of its activity is limited to the ribosome. In the case of trypanosomes, cryo-electron microscopy failed to identify RACK1 on the 40S ribosome (24), suggesting that the trypanosome RACK1 (TRACK) functions in pathways other than translation.
Sequences with similarities to RACK1 have recently been identified in Leishmania, Crithidia and T. brucei (25–28). In none of these cases is the function known. The RACK1-related protein in Leishmania, is called LACK and was identified because of its ability to serve as a protective antigen during infection (25). Although its function is not understood, partial knockout of the lack gene locus results in cells that divide normally, but cannot efficiently parasitize host cells (29). The Trypanosome Receptor for Activated C Kinase, or TRACK, was identified independently in two studies that evaluated differentially expressed genes. Rapidly dividing trypanosomes were found to have lower levels of track transcripts compared with Go arrested stumpy forms (27) or cells undergoing apoptosis-like death in response to concanavalin A (28). Although TRACK and LACK have each been associated with cell growth and/or infectivity, the pathways they regulate are unknown.
In the present study, we evaluate for the first time the function of TRACK. We report that TRACK plays a fundamental role in trypanosome cytokinesis. A similar result had been reported for RACK1 in the early zygote stage of C. elegans (30). When RNAi was used to knock down the C. elegans RACK1 homologue, the zygote initiated but failed to complete the first cytokinesis. Trypanosomes appear to lack some of the cell cycle check-points of other eukaryotes (31). Consequently, TRACK RNAi in T. brucei produces cells that undergo multiple rounds of partial cytokinesis. These data indicate that trypanosomes initiate cytokinesis without TRACK, but require TRACK for progression beyond the midpoint of cell cleavage. Moreover, each of the partially cleaved daughter cells progresses through the cell cycle at different rates. Collectively, these data identify a new function for RACK1 homologues. Moreover, since TRACK mediates an essential process in trypanosomes, we propose that its association with target proteins may be disrupted in the design of new therapies.
MATERIALS AND METHODS
Trypanosomes
A PF cell line derived from AnTat1.1 bloodstream forms was kindly provided by E. Pays, Free University of Brussels. Additionally, 29–13 PF and 90–13 BF cells (32) were kindly provided by G.A.M.Cross, The Rockefeller University. Both the 29–13 cells and 90–13 cells express the T7 RNA polymerase and the tetracycline repressor protein. PF cells were maintained in SDM-79 supplemented with 50 μg/ml hygromycin and 15 μg/ml G418 with 2.5 μg/ml phleomycin as needed. BF 90–13 cells were maintained in HMI-9 medium (33) supplemented with 5 μg/ml hygromycin and 15 μg/ml G418. Where needed, 2.5 μg/ml of phleomycin was added. RNAi was induced with 1 μg/ml tetracycline.
Phylogenetic Analysis
Bloodstream forms (BF) of pleiomorphic YTat1.1 and monomorphic M110 were obtained from rodent blood following DE-52 anion exchange chromatography, as described previously (34). Stumpy forms of YTat1.1 were obtained following inoculation of 1×10⁴ BF cells into rats. Prior to the peak of parasitemia, cells were harvested by DE-52 anion exchange chromatography. Stumpy form trypanosomes were transferred to Cunningham’s medium and cultured at 28°C until a stable culture of procyclic forms was obtained (34). T. evansi, T. equiperdum and T. cruzi cell homogenates were obtained as described previously (34).
track Clones
Genomic DNA was isolated from PF trypanosomes as described (35) and used as a template to amplify track by PCR. Vectors include pQE30 (Qiagen), pTSA.Hyg (36), pLEW100 (32), pALT4 (37), and pZJM (38). Forward primers for the complete coding region of track encompassed nucleotides 1–21 while the reverse primers encompassed nucleotides 933–953. The nucleotide sequence of track is at geneDB.org (Tb11.01.3170). Restriction sites were added to the primers. To express recombinant (His)6-TRACK, the complete coding region was cloned into the BamHI/HindIII site of pQE-30. TRACK.AU1 was cloned into the XhoI/BamHI site of pTSA.Hyg with the reverse primer encoding an AU1 epitope tag (39). Full length track was cloned into the NdeI/BamHI sites of yeast expression vector pALT4. A 503 bp fragment of the track coding region was amplified by PCR and cloned into the XhoI/HindIII sites between the dual opposed promoters in pZJM. The forward primer encompassed nucleotides 13–32 of the track coding region and the reverse primer encompassed nucleotides 497–516.
Transformation of Trypanosomes
The pZJM-TRACKi construct was linearized with NotI, and electroporated into the 29–13 PF cell line or the 90–13 BF cell line. The pTSA construct was linearized with BssHII and electroporated into AnTat1.1. Electroporation was with a Gene Pulser (Bio-Rad). For BF cells, 100 μg of NotI linearized pZJM.TRACK was added to 108 cells using the buffers and settings described (40). Cloned cell populations were obtained by serial dilution. The phenotypes observed in this study were obtained with multiple cloned cell lines and with independent transformations.
Growth Studies
Logarithmically growing cultures were diluted to a concentration of 1×10⁶ cells/ml (PF) or 1×10⁵ cells/ml (BF). Cell density was determined by counting trypanosomes with a Neubauer haemocytometer at times indicated. Each culture was counted in duplicate, and the growth study was repeated a minimum of 3 times.
Protein Expression
Plasmid pDM31 encoding MalB.FLAG.RACK1 was kindly provided by D. Mochly-Rosen, Stanford University. Expressed protein was purified from soluble fractions on amylose-agarose following the manufacture’s instructions (New England Biolabs). To prepare antibodies against TRACK, recombinant (His)6-TRACK was purified from inclusion bodies following solubilization with 100 mM NaH2PO4, 10 mM Tris-Cl, 8 M Urea, pH 8.0 (5 ml per gram of wet weight). The sample was bound to Ni-NTA agarose, washed in the solubilization buffer adjusted to pH 6.3 and eluted in the same buffer at pH 5.9.
Antibodies and Stains
To produce rabbit antibodies against recombinant TRACK, 2 mg of the purified protein was sent to Covance (Richmond, CA). Antiserum containing the IgG fraction was obtained by Protein A chromatography. Other primary antibodies used in this study include: mouse anti-AU1 (Covance; 1:200 microscopy, 1:1,000 western blots); rat anti-paraflagellar rod (T. Seebeck, University of Bern, 1:200); rat anti-glyceraldehyde phosphate dehydrogenase (P.A. Michaels, Christian de Duve Institute of Cellular Pathology, Brussels, 1:1,000); mouse E7 antibodies against β-tubulin (Developmental Studies Hybridoma Bank, University of Iowa, 1:1,000); mouse anti-tubulin (Sigma, 1:1,000); rabbit anti-BiP (J. Bangs, University of Wisconsin, 1:200), rabbit anti-cytochrome C1, (S. Hajduk, Marine Biology Laboratory, Woods Hole, MA, 1:1,000); mouse anti-phosphtyrosine, phosphoserine or phosphothreonine (Sigma, 1:1,000). Secondary antibodies were purchased conjugated to: alkaline phosphatase (Sigma); horseradish peroxidase (Jackson Immunoabs); Cy2 (Jackson Immunoabs) and Cy3 (Jackson Immunoabs). Stains include TOTO (Molecular Probes, 1:600); DAPI (Vectashield, Vector Laboratories) and MitoTracker (Molecular Probes, 200 nM).
Immunoblots
Proteins were separated by SDS-PAGE and transferred electrophoretically to nitrocellulose membranes using the Bio-Rad semi-dry transfer apparatus for 15 min at 15 V. Color was developed with alkaline phosphatase labeled secondary antibodies and 5-bromo-4-chloro-3-indolylphosphate-p-toluidine salt (BCIP) and nitroblue tetrazolium chloride (NBT). Phosphoprotein blots were developed using the luminol/enhancer system (SuperSignal West Pico Chemilumnescence Kit, Pierce).
Densitometry
Individual bands on immunoblots were assigned an integrated density value (IDV) using the SpotDenso program on the Alpha Innotech Imaging system. Linearity of the IDV value with increasing protein was verified. The ratio of the IDV for TRACK and its loading control (either tubulin or glyceraldehydes phosphate dehydrogenase) was calculated.
Microscopy
Cells were washed with phosphate buffered saline (PBS with Dulbecco’s salts; Invitrogen) and fixed for 45 min with 4% paraformaldehyde in the same buffer. After washing the cells in 50 mM Tris-HCl, 150 mM NaCl, pH 7.5, the cells were allowed to settle for 1 hr on Fisher (+) Gold positively charged microscope slides. To quantify nuclei and kinetoplasts, cells were mounted with Vectashield containing DAPI and at least 300 random cells were evaluated per experiment and each experiment was repeated at least twice. For protein localizations, the fixed cells were permeabilized on the slide with 0.1% Triton X-100 or 0.1% Igepal CA-630 (Sigma) in PBS and blocked with 4% goat serum in PBS. Where indicated, MitoTracker (200 nM) was added to cells for 30 min prior to fixation. Primary antibody was added in the presence of 0.2% gelatin for 1 hr at 37°C. After three washes in PBS plus gelatin, cells were treated with secondary antibodies and TOTO as above and washed at least three more times. Cells were coated with Mounting Medium (Kirkegaard and Perry Laboratories, MD) or with Vectashield containing DAPI. Microscopy was with a Nikon C1 Digital Eclipse Confocal E600 microscope, using either DIC optics, epifluorescence or scanning lasers as indicated in each figure. Images were collected with Metamorph or EZ-C1 software (Nikon).
TRACK Immunoprecipitations
Logarithmically growing wild-type PF cells were allowed to grow overnight to a density of 1.5×10⁷ cells/ml. Cells were washed in PBS containing Dulbecco’s salts and 1 g/l glucose (Invitrogen), and snap frozen in liquid nitrogen and stored at −80°C. Cells were lysed at 2×10⁶ cells/200 μl in RIPA buffer (1X PBS, 1% Igepal CA-630, 0.5% Na-deoxycholate, 0.1% SDS) containing protease inhibitor cocktail comprised of leupeptin (5 μg/ml), phenylmethylsulphonyl-fluoride (1 mM), E64 (20 μM) and phosphatase inhibitors (0.2 mM orthovanadate, 20 mM NaF and 100 nM okadaic acid. The 10,000 xg supernatant was pre-cleared with 1 volume of Sephadex G25 for 3 hrs at 4°C. The pre-cleared supernatants were incubated with anti-TRACK and precipitated with protein A agarose. Pellets were boiled in SDS-PAGE sample buffer and analyzed by western blots.
Cell Cycle Analysis
Cells were washed in PBS and suspended in 70% ethanol containing 5% glycerol. After an overnight incubation at −20°C, cells were washed in PBS with Dulbecco’s salts and incubated for 20 min at 37°C with 10 μg/ml RNase A. Propidium idodide was added to a final concentration of 10 μg/ml and the incubation was continued for an additional 1 hr. The cells were analyzed with the FACS Calibur cell sorter (Becton Dickinson). Gating was determined with control cells for each experiment and the same values were used for all treated cells. Cell cycle parameters were analyzed using ModFitLT V3.0.
Schizosaccharomyces pombe Growth and Transformation
The S. pombe strain SPB190 ((h90 leu1–32 ura4-D18 cpc2::ura4) was kindly provided by M. McLeod (State University of New York, Downtown Medical Center). Cells were grown in complex medium or YE (5 g Difco Yeast extract, 30 g glucose, and amino acid supplement) for maintenance and unrestricted growth. Minimal medium (MM) was made by standard procedures (37) and was used for growth of auxotrophic mutants, selection of transformants and complementation assays. Leucine (250 mg/l) and adenine (3.75 g/l) were added to auxotrophic strains as needed. All S. pombe strains were grown at 30°C unless otherwise specified. Transformation of S. pombe was by electroporation. Briefly, 40 μl of cell suspension at 1×10⁹ cells/ml in 1 M sorbitol was incubated with 100 ng plasmid DNA on ice for 5 min. The pulse conditions were 1.5 kV, 25 μF and 200 Ω. Immediately after, 0.9 ml of ice-cold sorbitol was added to the cells, they were plated onto MM without any amino acid supplement. To test for expression of recombinant proteins, 2.3 mg of cell wet weight were suspended in 100 μl of distilled water to which an equal volume of 0.2 M NaOH was added for 5 min at room temperature as described (41). Insoluble material was pelleted and the supernatant was boiled in SDS-PAGE sample buffer prior to analysis by SDS-PAGE and western blot.
Complementation Assays
S. pombe strain SPB190 or SPB190 containing pALT2, pALT4.TRACK, or pCPC1.10 were grown to stationary phase (108–109 cells/ml) in YEA (YE plus 75 μg/ml adenine) and then plated onto minimal medium and grown for 60 hr at either 30°C or 37°C to test for recovery of morphology and viability at high temperature.
RESULTS
TRACK Structure
Effective signals require correct distribution of regulatory proteins within the cell. Anchor proteins have been identified that serve as scaffolds upon which signal complexes can assemble (5, 6). RACK1 has recently received attention because it forms productive ternary complexes with a wide range of partners (6). In T. brucei, an apparent homologue of RACK1 has been cloned and is referred to as TRACK (27, 28). Within the Sanger database, track is identified as a tandemly repeated gene on chromosome 11 (www.geneDB.org). The genes are within a group that includes γ-tubulin-like interacting protein and Hsp 70. TRACK is predicted to fold into a 7-bladed β-propeller comprised of WD repeat motifs (Fig. S1). Within the WD repeats, TRACK shares 64% identity with RACK1; falling to 34% identity in the loop regions. TRACK is also conserved in some of the regions known to interact with target proteins including two PKC interaction sites (black box in Fig. S1) and one of two Ran Kinase recognition sites, also referred to as Ran Kinase Domains (RKD) (37).
Yeast Complementation
We tested the ability of track to complement a cpc2 null mutant cell line of the fission yeast S. pombe. RACK1 has already been shown to be a homologue of Cpc2 by this procedure (37). In S. pombe, Cpc2 is not essential for normal growth on Complete Medium at 30°C. However, in Minimal Medium, cells accumulate in the G2 phase of the cell cycle, and become elongated (Fig. 1A). Here, cpc2Δ cells are transformed with a variety of plasmids; including empty expression vector (pALT2), the cpc2 coding region in vector pALT4 (pCPC1.10), or with pALT4.TRACK. Western blots with anti-TRACK antibodies reveal cross-reacting proteins only in cells that express Cpc2 (cpc2Δ□□pCPC1.10) or TRACK (cpc2Δ::pALT4.TRACK) (Fig. 1B, lower panel). Additionally, cells that express Cpc2 or TRACK have their morphology restored (Fig. 1A, lower panels), while cells that receive the empty vector remain elongated (Fig. 1A, upper panel).
Figure 1.
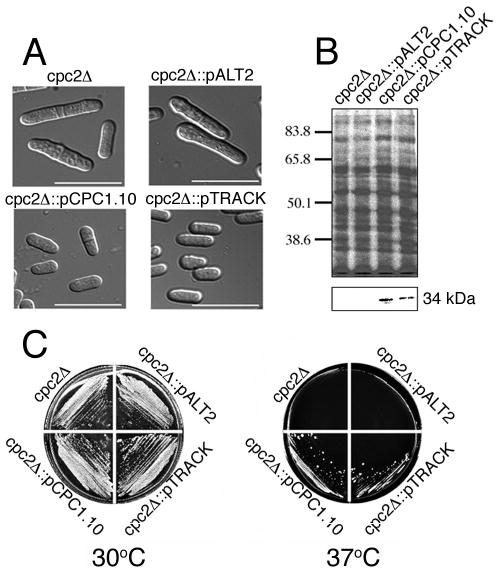
track is able to complement cpc2 null mutants of S. pombe. A. S. pombe strain SPB190 is null for cpc2 and was transformed with either pALT2 empty vector, pCPC1.10 containing cpc2, or pALT4.TRACK containing track. Cells were grown in Minimal Medium plus leucine for 48 hr at 30°C and imaged by Nomarski/DIC microscopy. Images were collected with a cooled CCD camera and were saved in MetaMorph. Bar corresponds to 20 μm. B. S. pombe homogenates were obtained from the indicated cell lines. Proteins were separated by SDS-PAGE on 10% gels. The upper panel shows total protein stained with Coomassie Blue while the lower panel is a western blot with anti-TRACK. C. The indicated S. pombe cell lines were grown on Minimal Medium plus leucine for 60 hr at 30°C (left panel) or at 37°C (right panel).
Growth of S. pombe, including cpc2Δ and all of the transformants is equivalent in Minimal Medium at 30°C (Fig. 1C). However, at the restrictive temperature of 37°C growth of cpc2Δ cells is greatly inhibited (Fig. 1C). Addition of an empty vector to these cells does not restore growth (upper right quadrant). However, addition of track restores growth to the same extent as addition of yeast cpc2 (lower quadrants). The growth regulation involves association of Cpc2 with Ran1 kinase and this requires phosphorylation of the Cpc2 RKD (37). In TRACK, only the RKD in WD repeat 1 has a sequence that can be phosphorylated, while that of WD repeat 3 cannot. Taken together, these data indicate that TRACK can substitute for Cpc2 in null mutants (as can RACK1).
TRACK Expression in T. brucei
Previous studies used PCR methods to measure changes in track transcript levels when cells underwent an apoptosis-like death (28), or became division arrested (27). In dividing PF, one report indicated that track mRNA could not be detected by Northern blots (28). Neither study measured TRACK protein content. Western blots reveal that TRACK is present in slender bloodstream forms (BF), short stumpy forms (SS) and procyclic forms PF) (Figure 2A). The quality of our life cycle stages is verified with antibodies against cytochrome C1 which is absent in BF, increases in SS and is fully expressed in PF trypanosomes (Torri et al., 1993). Tubulin serves as a loading control. Additionally, a protein related to TRACK is identified in several trypanosomatids, including T. brucei, T. evansi, T. equiperdum and T. cruzi. (Panel B). Monoclonal antibodies against mammalian RACK1 do not cross-react with any of the trypanosomatid proteins (Panel B). Nonetheless, when mammalian RACK1 is expressed as a fusion protein with maltose binding protein, our antibodies against TRACK recognize it (panel C). Taken as a whole, these data indicate that TRACK is present throughout the lifecycle of T. brucei, and that a related protein is in other trypanosomatids. RACK1 contains epitopes that are not present on TRACK (anti-RACK1 blots) and it also contains epitopes that are shared (detectable with our anti-TRACK antibodies).
Figure 2.
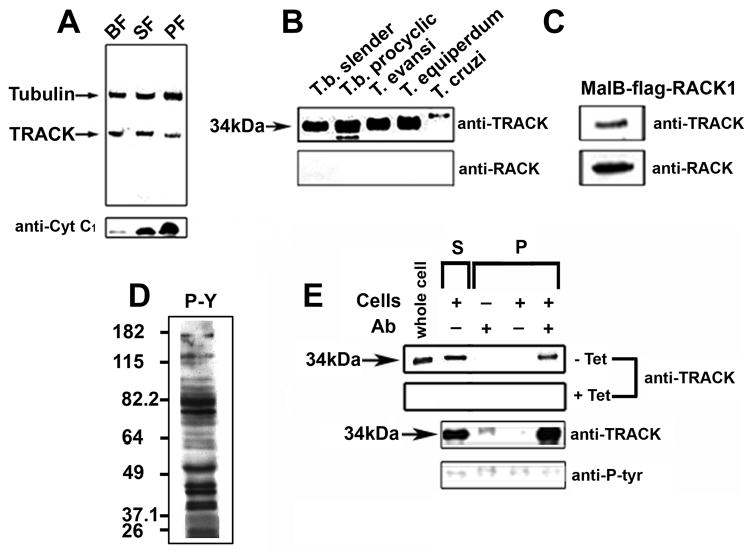
TRACK is expressed throughout the trypanosome lifecycle and is not phosphorylated in vivo on tyrosine residues. A. Western blot of whole cell homogenates from trypanosome lifecycle stages. Each lane contains 20 μg protein from strain YTat1.1 bloodstream forms (BF), Go arrested short stumpy forms (SF) and insect stage procyclic forms (PF). Blots were developed for alkaline phosphatase with primary antibodies against β-tubulin, TRACK or cytochrome C1, as indicated. B. Phylogenetic distribution of TRACK among kinetoplastid parasites. Whole cell homogenates (15 μg per lane) from T. brucei M110 BF, AnTat1.1 PF, T. evansi, T. equiperdum and T. cruzi epimastigotes were blotted with anti-TRACK or mouse anti-RACK1. C. Bacterially expressed recombinant MalB-FLAG-RACK1 (15 μg) was blotted with antibodies against TRACK or against RACK1. D. Total cell homogenate was evaluated for proteins that cross-react with antibodies against phospho-Tyr (P-Y). E. Pull-down with anti-TRACK antibodies and subsequent western blot with antibodies against phospho-Tyr. Individual lanes include starting homogenates (whole cell), supernatant fraction (S) and pull-down fractions (P) after incubation with combinations of anti-TRACK antibodies, protein A beads, or cell homogenates. The upper panels used TRACK RNAi cells in the absence of tetracycline (wild-type levels of TRACK) or presence of tetracycline (TRACK depleted). The lower panels used wild-type procyclic forms derived from AnTat1.1.
Phosphorylation of TRACK
The phosphorylation of Try-246 on RACK1 is one mechanism by which it can regulate cell growth (7, 43, 44). Tyr-248 of RACK1 can also be phosphorylated (7). We evaluated the in vivo phosphorylation of TRACK with the same antibody approach used by others to study RACK1 (7). The antibodies against phospho-Tyr recognize a range of proteins in trypanosome cell homogenates (Fig. 2D). Pull-down assays show that TRACK is not among them (Fig. 2E). As a control to ensure that the appropriate protein precipitated, the assay was repeated with cells depleted of TRACK by tetracycline inducible RNAi. [The RNAi cells are described in detail below (Fig. 5)]. TRACK is present in the pull-down fraction (P) when cells and antibodies are present, but not in the presence of tetracycline. The lower panels show results from wild-type trypanosomes. These data indicate that TRACK is not phosphorylated on Tyr in vivo. The low-level background phosphorylation is not significant since it is also detected in lanes without cells. The related proteins CACK (Fig. 1S) and LACK (25) each contain a Phe substitution at the two major phosphorylation sites. Thus it appears that trypanosomatids do not use this method of protein recruitment to control infectivity or cell growth as is the case with RACK1 (7, 43, 44). The same antibody approach also does not detect phosphorylated Thr or Ser residues in TRACK (data not shown).
Figure 5.
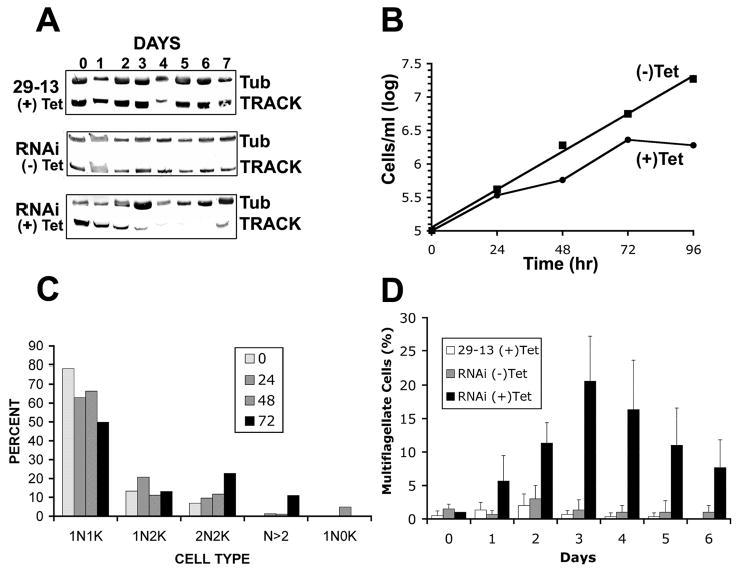
RNAi of track causes growth arrest of PF cells. A. Western blot of TRACK with tubulin (TUB) as a loading control. Each lane contains 15 μg of total cell protein separated on 12% polyacrylamide gels. Cell lines include parental 29–13, and RNAi clone G11 either with or without 1 μg/ml tetracycline as indicated. B. Growth curve of RNAi clone G11 in the presence or absence of 1 μg/ml tetracycline. C. Percentage of cells with different configurations of nuclei and kinetoplasts. At the indicated times after the addition of 1 μg/ml tetracycline, RNAi clone G11 was fixed with paraformaldehyde and stained with DAPI. Cells were scored for the number of kinetoplasts and nuclei. The experiment was repeated at least three times and at least 100 cells were counted per experiment. D. The percent of cells with two or more flagella was quantified at different times after the addition of 1 μg/ml tetracycline. Cell populations include parental 29–13 cells plus tetracycline, and RNAi clone G11 minus tetracycline and plus tetracycline.
Localization of TRACK in PF Trypanosomes
TRACK is presumed to function as an anchor that tethers signal complexes to the appropriate location in the cell. Our rabbit antibodies against TRACK did not prove useful in localization studies. Therefore, we expressed an AU1 epitope tagged version of TRACK in PF cells (Fig. 3). The AU1 antibodies do not cross-react with any protein in control cells (Fig. 3, lane a) but recognized TRACK.AU1 (lane b). Densitometry of TRACK and the GAPDH loading control indicate that TRACK increases by no more than 9% in AnTat1.1::pTSA.TRACK.AU1 cells (Fig. S2). For localization studies, cells are labeled with mouse anti-AU1 and Cy2-conjugated secondary antibodies, and counterstained with the nuclear stain TOTO. In wild-type cells, no AU1 labeling is observed (panel B). The distribution of TRACK.AU1 is shown during the cell cycle. Early in the division cycle, when the cells have one nucleus (N) and one kinetoplast (K) (1N1K), or have 1N2K, TRACK is concentrated in a region around the nucleus and extends into the cytoplasm (Fig. 3C, upper panels). As nuclear division commences, TRACK.AU1 remains concentrated in the region along the nuclear envelope (lower panel) and eventually surrounds each separated nucleus. An exclusion zone between the nuclei is often seen.
Figure 3.
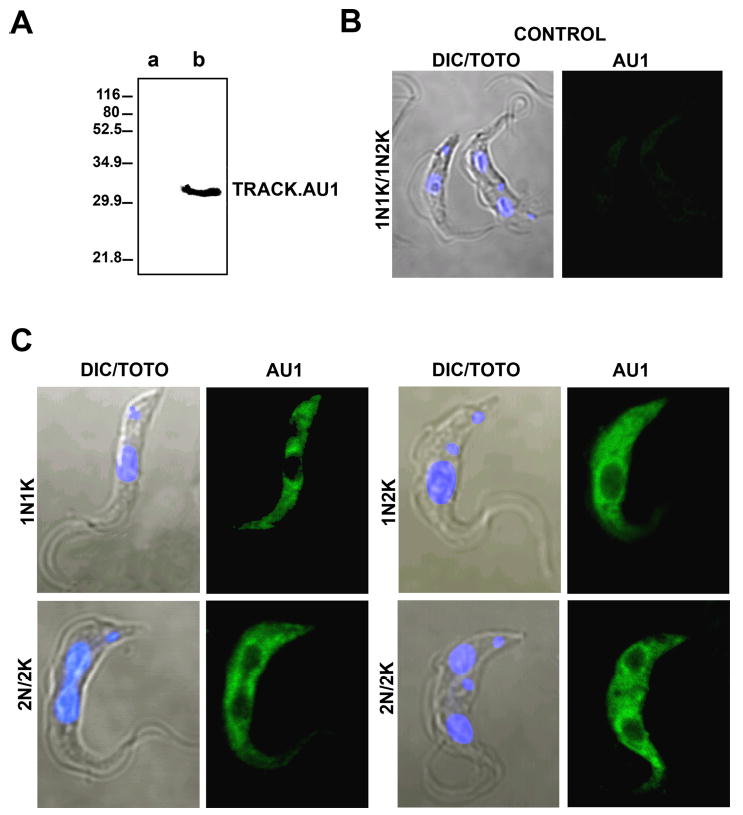
TRACK is localized to the cytoplasm and a region around the nucleus throughout the cell cycle in PF cells. PF cells derived from AnTat1.1 were transformed with the constitutive vector pTSA.TRACK.AU1. A. Western blot with mouse anti-AU1 shows the absence of cross-reacting protein in parental cell lines (lane a) and the presence of tagged TRACK in transformed cell lines. B. Fluorescence microscopy shows the absence of AU1 staining in parental cells. C. Transformed cells at different stages of the cell cycle were analyzed. G1 corresponds to one nucleus and one kinetoplast (1N1K). S/G2 corresponds to 1N2K. Post-mitotic corresponds to 2N2K. The nucleus was stained with TOTO and the AU1 tag was identified with secondary antibodies conjugated to Cy2. Images were collected with a Nikon C1 Digital Eclipse Confocal E600 microscope using the EZ-C1 software.
Although much of the TRACK.AU1 appears to be cytosolic, cell fractionation indicates that it is also associated with particulate material similar to the untagged TRACK (Fig. 4A). To establish whether the distribution of TRACK corresponds to organelles, cells expressing TRACK.AU1 were also labeled with antibodies against Tb.BiP (ER localization) or MitoTracker Red (mitochondrial localization) (Fig. 4B). TRACK.AU1 co-localizes with Tb.BiP along the cytoplasmic face of the nucleus but not along the nucleoplasmic face or in any other region of the cell. The labeling pattern for the mitochondrion is also distinct from that of TRACK.AU1.
Figure 4.
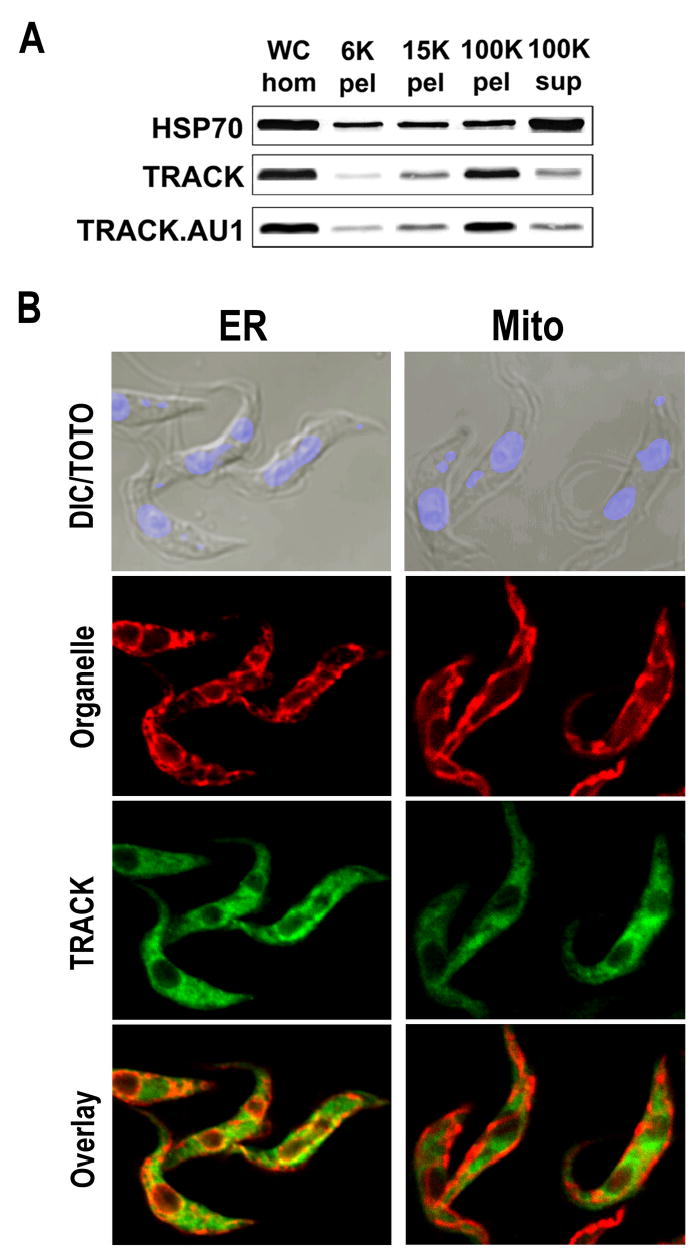
The majority of TRACK is in a high-speed particulate fraction but does not co-localize with the ER or mitochondrion. A. Parental cells or cells expressing TRACK.AU1 were sonicated and fractionated by centrifugation. Each particulate fraction was washed one-time. The protein equivalent to 5.8×10⁶ cells was loaded onto the lanes of a 10% polyacrylamide gel and evaluated by western blot with antibodies against a soluble marker (Hsp70) or TRACK (parental cells) or the AU1-tag (TRACK.AU1 cells). B. The ER was labeled with antibodies against Tb.BiP and secondary antibodies conjugated to Cy3. The mitochondrion was labeled with MitoTracker Red. TRACK.AU1 was localized with mouse anti-AU1 and secondary antibodies conjugated to Cy2. The nuclei and kinetoplasts were counterstained with TOTO. BiP and TRACK co-localize along the cytoplasmic face of the nucleus (yellow) but not along the nucleoplasmic face (red).
TRACK Knockdown in PF Trypanosomes
To evaluate the role TRACK might play in cell function, RNAi was used. dsRNA was produced from dually opposed tetracycline inducible T7 promoters in the stably integrated vector pZJM.TRACK. Cloned cell lines were obtained by limiting dilution and each exhibited the same phenotype upon induction of RNAi. Western blots show the level of TRACK expression for one of these clones (Fig. 5A). The monoclonal antibody E7 against β-tubulin is used as a loading control and rabbit anti-TRACK is used to monitor the quantity of TRACK in the cell. For the parental 29–13 procyclic cell line, addition of 1 μg/ml tetracycline is without effect on TRACK expression (Fig. 5A, top panel). In the absence of tetracycline, the RNAi cells also produce stable amounts of TRACK. By contrast, TRACK levels declined over a 4-day period following induction of RNAi with tetracycline. The levels remain low until day 7 when the cells began to recover.
Upon addition of tetracycline, RNAi cells grow normally for 24 hr and thereafter slow (Fig. 5B). After 96 hr post-induction, the RNAi cell population has a cell density that is only 10% that of RNAi cells without tetracycline (Fig. 5B) or of parental cells in the presence of tetracycline (not shown). After this time, cell growth recovers as is occasionally the case with RNAi in trypanosomes. These data verify that TRACK is an essential component of T. brucei. Cell cycle progression was evaluated in an effort to understand the basis for growth arrest (Fig. 5C). As described by others, DAPI staining can distinguish between several cell cycle stages in T. brucei (45). The mitochondrial DNA (kinetoplast) divides during S phase, producing cells with one nucleus and two kinetoplasts (1N2K). Nuclear division follows, producing cells that have 2N2K. In control procyclic populations, approximately 78% of PF cells are 1N1K. Upon induction of RNAi for 72 hr, the 1N1K population decreases significantly to 50% and the 2N2K population increases by approximately 3-fold (Fig. 5C). Additionally, the number of cells with greater than 2 nuclei rose from 0% of the population to 11% of the population. These data indicate that cell cycle progression was impaired at a post-mitotic stage. After 48 hr of RNAi induction approximately 5% of the cells appear as zoids with 0N and 1K. Zoids result from a misaligned cell cleavage. The population of zoids decreases to 0.3% of the population by 72 hr. Remarkably, 20% of the RNAi cells eventually initiate a normal cytokinesis, but appear stuck part way through (Fig. 5D). Because trypanosomes lack some cell cycle checkpoints (31) they undergo multiple rounds of partial cytokinesis. These cells have one or more distinct cleavage furrows with an attached flagellum on each of the resultant cytoplasmic extensions [Fig. 6A–D; and confirmed with cells stained for nuclei (TOTO) and flagella (anti-PFR) (Fig. 6E–H)]. Each of the resultant cytoplasmic extensions with attached flagellum is fully motile. A movie of these cells is at http://faculty.smu.edu/lruben/. Interestingly, the successive rounds of cytokinesis are nonsynchronous in that only one of the partial-daughter cells divides at a time. The nonsynchronous division produces an odd number of cytoplasmic extensions (Fig. 6, B–D) or as seen in panels D and F, two daughter cells remain connected by a cytoplasmic bridge, and one of these cells has already become stuck in the next round of mitosis.
Figure 6.
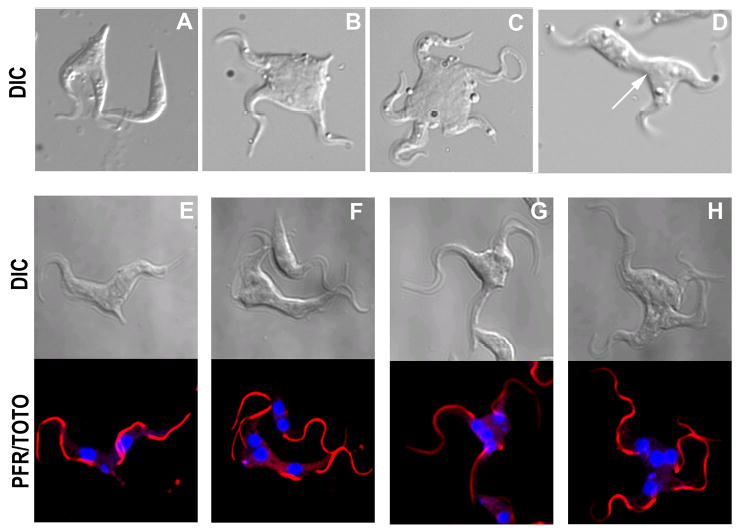
The PF TRACK RNAi cells have multiple cleavage furrows. Panels A–D. Cells were treated with 1 μg/ml tetracycline for 96 hr, fixed with paraformaldehyde and examined with Nomarski/DIC optics. Arrow indicates the position of a cytoplasmic bridge where each attached cell has progressed through the cell cycle at different rates. Panels E–H. Confocal microscopy of TRACK RNAi cells after 72 hr exposure to 1 μg/ml tetracycline. Nuclei were stained with TOTO and flagella stained with rat anti-paraflagellar rod and secondary antibody conjugated to Cy3. Note that in panel F, the kinetoplasts are in a different focal plane.
When evaluated by flow cytometry, a 50% reduction in G1 phase cells is seen in the RNAi population (Fig. 7). The percentage of cells with greater than 4C DNA content rises from 0.63% to nearly 23% of the population. The increase in DNA content is similar to reports for PF trypanosomes treated with other inhibitors that affect the cell cycle. For example, after 18 hours of growth in either okadaic acid or vinblastine, trypanosomes, fail to initiate cytokinesis, become multinucleate and have increased DNA content (46, 47). However, none of these inhibitors produce the same phenotype as TRACK RNAi. The multinucleate cells are shown in the left panels while the increase in DNA content is indicated on the right.
Figure 7.
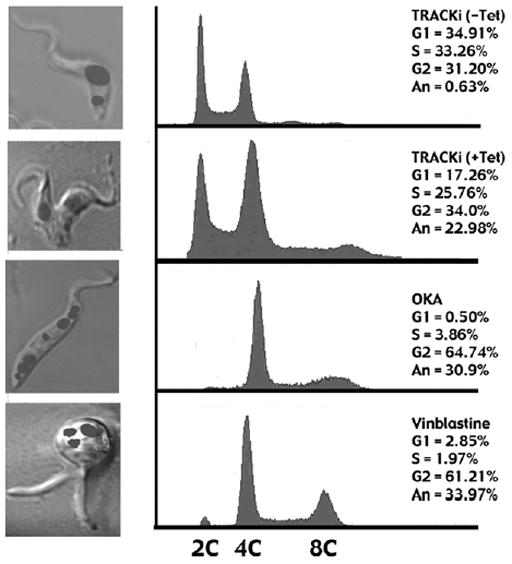
Flow cytometry of PF TRACK RNAi cells. Flow cytometry profiles are shown of RNAi cells in the absence of tetracycline, RNAi cells after 96 hr growth in the presence of 1 μg/ml tetracycline, cells treated for 18 hr with 100 nM okadaic acid, and cells treated for 18 hr with 3 μg/ml vinblastine. The left panel shows a representative morphology of these cytokinesis arrested cells. The image is an overlay of DAPI stained nuclei and Nomarski/DIC optics. The right panel indicates percentage of cells in different cell cycle stages as determined with the ModFitLTV3.0 program.
Altogether, these data demonstrate that cytokinesis in PF trypanosomes is discontinuous. TRACK is not required for the onset of cytokinesis, but it is essential for completion of the cleavage furrow. Additionally, the two fused daughter cells can each be followed into the next cell cycle and although they share considerable cytoplasm, they progress through the cell cycle at different rates.
TRACK Knockdown in BF Trypanosomes
An unusual feature of the trypanosome cell cycle is the way in which conserved regulatory proteins can have different functions depending upon the lifecycle stage of the organism (40, 48–52). Here we evaluate whether a similar situation occurs with TRACK. The same tetracycline inducible RNAi vector was electroporated into BF trypanosomes. Cells derived from two independent transformations were initially tested and gave the same results. Following induction of RNAi with tetracycline, densitometry of western blots reveals that the cell content of TRACK declines to approximately 48% of control levels over a 4-day period (Fig. 8A). Although the knockdown of TRACK is less complete than occurred in PF trypanosomes (Fig. 5A), the impact on growth is more severe. Cell division continues for a 24 hr period and then is inhibited. Cell density begins to decrease after 48 hr and the cells do not recover, even after 120 hr of growth (Fig. 8B). The growth inhibition is accompanied by changes in the cell cycle (Fig. 8C). Within 72 hr of RNAi induction, the percent of cells with 1N1K declines from 82% of the population to 45% of the population. Similar to the RNAi in PF cells, a three-fold increase in the 2N2K population is observed. Cells that have additional kinetoplasts (K>2) increase from 0% to 7.4% of the population (Fig. 8C). The cells in general appear to be stalled in a post-mitotic stage. Some of the morphology types are shown in cells where the nucleus is stained with TOTO and the flagella is labeled with antibodies against PFR (Fig. 9). Unlike the situation with PF cells, the RNAi BF cells do not exhibit partial cytokinesis. Many of the morphology types are those seen during a normal cell cycle. The kinetoplasts replicate and align laterally at the posterior end of the cell (Fig. 9B). The flagellum also replicates and moves to lateral positions on either side of the cell body. Unusual phenotypes are also observed. The replication of flagella continues in the absence of cytokinesis, and cells are observed with 4K4F and an indeterminate number of nuclei (Fig. 9C–D). Overall, these data demonstrate that TRACK is essential for the initiation of cytokinesis in BF cells.
Figure 8.
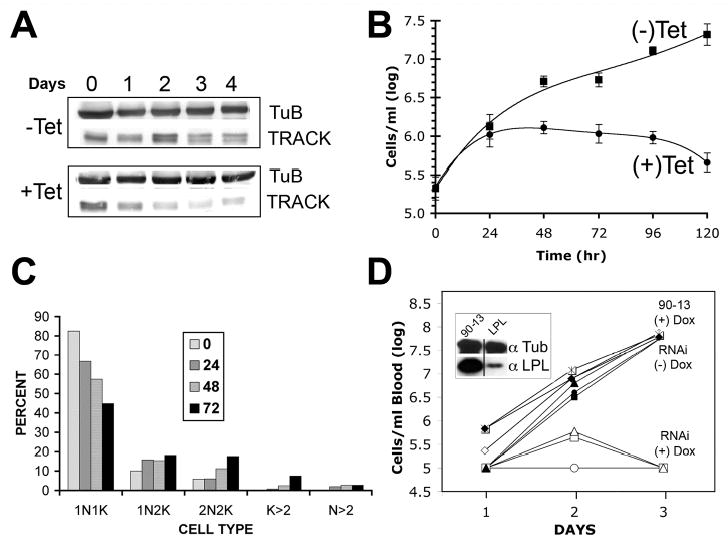
RNAi of TRACK causes growth arrest of BF cells. A. Western blot of TRACK RNAi BF cells. Cell homogenates were collected at the indicated times after induction of RNAi with 1 μg/ml tetracycline. Each lane contains 25 μg homogenate protein separated on 12% polyacrylamide gels. B. Growth curve of BF RNAi cells in the presence or absence of 1 μg/ml tetracycline. The average value ± SD of three separate experiments is shown. C. Percentage of cells with different configurations of nuclei and kinetoplasts. At the indicated times after the addition of 1 μg/ml tetracycline, BF RNAi cells were fixed with paraformaldehyde and stained with DAPI. Cells were scored for the number of kinetoplasts and nuclei. The experiment was repeated at least three times and at least 100 cells were counted per experiment. D. Groups of three mice were infected ip with 1×10⁶ BF RNAi trypanosomes or control BF 90–13 parental cells. The mice were either untreated or treated with 1 mg/ml doxycycline in the water supply. Parasitemia was quantified in peripheral tail blood at the times indicated and each curve plots the progression of infection in a single mouse. The groups of mice include control 90–13 cells (+) Dox, the RNAi cells (−) Dox, and the RNAi cells (+) Dox as indicated. The detection limit for this assay is 1×10⁵ trypanosomes per ml of blood. The inset to Panel D is a western blot of trypanosomes isolated from mice three-days post-infection. The mice were either infected with parental 90–13 cells, or trypanosomes containing the RNAi construct for the non-essential lysophospholipase gene (LPL). Both sets of mice were treated with 1 mg/ml doxycycline. Western blots reveal that doxycycline is sufficient to knockdown LPL in situ. Tubulin is used as a loading control.
Figure 9.
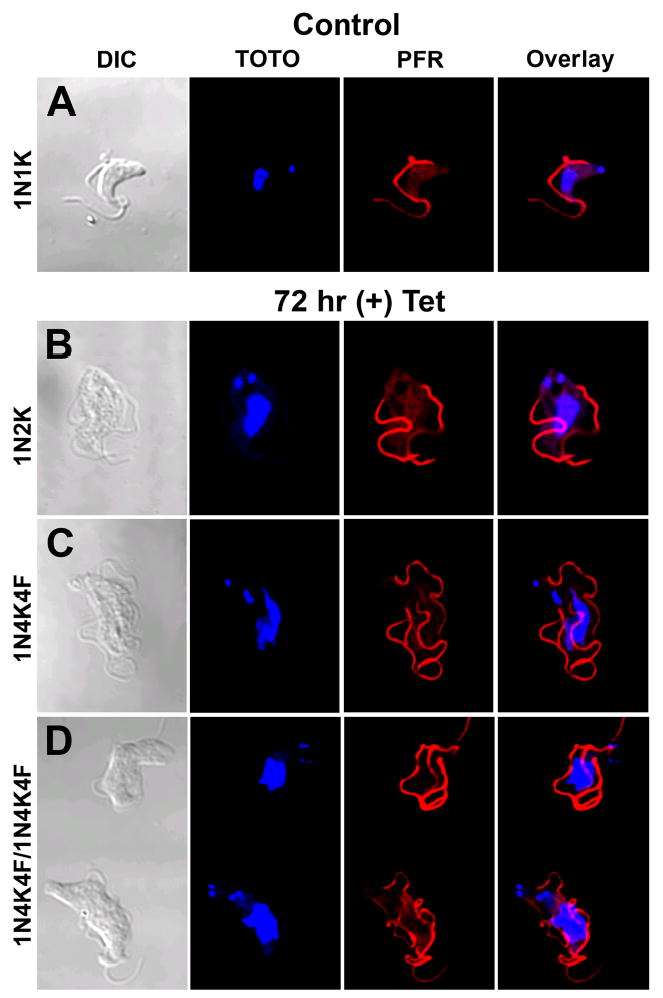
Morphology of the BF RNAi cells. Confocal microscopy of BF TRACK RNAi cells without tetracycline (upper panel) or after 72 hr exposure to 1 μg/ml tetracycline (lower panels). Nuclei were stained with TOTO and flagella stained with rat anti-paraflagellar rod and secondary antibody conjugated to Cy3. The number of nuclei, kinetoplasts and flagella are indicated.
TRACK Knockdown During Infections in Mice
To verify that TRACK is important to trypanosome survival in the mammalian host, TRACK RNAi was induced during the course of infection within mice. Nine mice were divided into three groups and each mouse was inoculated with TRACK RNAi trypanosomes or control 90–13 trypanosomes. The mice were either untreated, or treated with 1 mg/ml of doxycycline added to the drinking water in order to induce RNAi. Parasitemia was quantified in peripheral tail blood at the times indicated and each curve plots the progression of infection in a single mouse. In mice infected with the TRACK RNAi trypanosomes, parasitemia was below the detectable levels of 1×10⁵ trypanosomes per ml of peripheral blood by the third day of doxycycline treatment (Fig. 8D). Doxycycline did not by itself cure the trypanosome infection in control 90–13 parental BF cells (Fig. 8D). We did not specifically verify that TRACK became depleted because the RNAi cells died after 3 days. However, cells containing the knockdown construct for a non-essential gene (lysophospholipase) were evaluated by western blot three days post-infection (inset to Fig. 8D). The specific loss of lysophospholipase is evident in the RNAi cells but not the parental cells. The sensitivity of BF cells to TRACK depletion indicates that TRACK and its partners might be targeted in the design of novel therapies.
DISCUSSION
TRACK and Cell Growth
We began this project to investigate signal pathways that might be associated with growth regulation. Previous reports indicated that expression of track transcript is highest in cells whose growth is inhibited, either by apoptosis-like cell death, or during Go growth arrest in the stumpy stage of the lifecycle (27, 28). In some mammalian cells, overexpression of RACK1 is also associated with a slow growth rate (44). The phenotype is mediated by phosphorylation of Tyr-246 in RACK1 (7). Tyr-228 can also be phosphorylated (7). The kinetoplastid homologues LACK and CACK have Phe substitutions at each of these residues, and phosphotyrosines were not observed in TRACK. Therefore, any growth regulatory properties of TRACK occur independent of its phosphorylation on Tyr-246 or Tyr-228. While overexpression of track mRNA correlates with slow growth, here we show that depletion of TRACK with RNAi also causes growth arrest. In the latter case, the cells remain metabolically active, as indicated by full motility, but arrest during the process of cytokinesis.
The role of TRACK in the cell division process is dependent upon the lifecycle stage. When depleted of TRACK by RNAi, PF cells can initiate cytokinesis, while BF trypanosomes do not. BF cells are especially sensitive to the loss of TRACK and cell division halts after 24 hr of RNAi induction. The decreased number of cells with a 1N1K configuration, and increase in cells with 2N2K is consistent with a preferential cell cycle arrest in a pre-cytokinesis state. In PF cells, cytokinesis initiates, but once this happens, the progression is halted midway through cleavage. The cells continue to replicate nuclei, kinetoplasts and attached flagella, and continue to form multiple partial cleavage furrows. These data indicate that the role of TRACK is discontinuous in cytokinesis (that is, cytokinesis can initiate without TRACK, but cannot progress beyond a midstage of cell cleavage). Because the daughter cells remain fused in the track RNAi cells it is also possible to follow each progeny into the next cell cycle. Interestingly, the two cells progress at different rates even though they share considerable cytoplasm. A similar phenomenon has been reported for bud formation in S. cerevisae where the daughter cell takes longer than the mother cell to transit the next cell cycle (53). None of the other treatments that disrupt cytokinesis in T. brucei produce a similar phenotype to the TRACK RNAi (40, 46, 47, 51, 54–56).
Trypanosomes and Cytokinesis
The trypanosome genome appears to lack clear homologues of many yeast cell cycle proteins (57). Notably absent are components of the spindle-pole body, kinetochore structures, kinetochore motors and checkpoint proteins. Nonetheless, cyclins and Cdc2-related kinases (CRKs) have been shown to have a role in G1/S progression (49, 50, 52), G2/M progression (49, 51, 58) and cell morphology (52). A role for NDR family kinases has been inferred by RNAi knockdown of the scaffold MOB1 (40). Further evidence for the importance of kinase cascades comes from RNAi depletion of the phosphoserine-threonine binding protein 14-3-3, which along with the phosphatase inhibitor okadaic acid also disrupt cytokinesis (59, 47). Although the mechanism of action is not understood, synthesis of the GPI-anchored variant surface glycoprotein is also tied to completion of mitosis (48, 60).
Ultimately, the signaling cascades must impinge on a mechanical process to split the cells in two. The mechanical process is not known for T. brucei. Unlike the mammalian host, a role for actin is not apparent. Actin has not been localized to the cleavage furrow and RNAi knockdown of actin in PF cells does not prevent cytokinesis (61). Instead, flagellar replication is a requirement for cell division. The onset of cytokinesis is inhibited by depletion of the flagellum attachment protein-1 (Fla1) (55), while the cleavage furrow can be misaligned by knockdown of intraflagellar transport proteins (56) or overexpression of microtubule associated proteins CAP15 and CAP17 (54). The process is also disrupted with vinca alkaloids (46).
TRACK and Cytokinesis
The distribution of TRACK in T. brucei does not provide a ready explanation for how it modulates cytokinesis. None of the RACK1 homologues including Cpc2, LACK or CACK has ever been localized by immunostaining to the mitotic apparatus, and the majority are associated with the cytoplasm (9, 20, 26), plasma membrane (10–15, 26), Golgi (62) or nucleus (23). We identify TRACK.AU1 in a perinuclear region where it co-localizes with a portion of the ER marker Tb.BiP. It is also found in the cytoplasm. A similar cytoplasmic distribution was found for the trypanosome MOB1 anchor protein which also affects cytokinesis although it does not localize to the cleavage furrow (40). More recently, a MudPIT analysis of mammalian midbodies identified RACK1 among the cell division proteins (30). Based upon these observations, RNAi was used to knock down RACK1 in the early C. elegans zygote. Interestingly, the cells initiated but failed to complete the first cytokinesis (30). The phenotype was similar to that observed in the TRACK RNAi cells, except that in C. elegans the incomplete cleavage furrow disintegrated while in T. brucei the incomplete cleavage furrow remains.
The ability of RACK1 to form ternary complexes with a range of receptors and signal proteins may account for much of its growth regulatory properties (6, 10–15). However, it has recently become apparent that RACK1 also associates with the translation machinery (18–22), and the control of protein synthesis is a separate mechanism by which cytokinesis might be regulated. In a range of organisms, cryo-electron microscopy, tandem MS, or western blots of polysome preparations have led to the conclusion that RACK1 is a component of the 40S ribosomal subunit. Indeed, TOP regulatory sequences allow RACK1 to be expressed coordinately with the other ribosomal proteins (63). RACK1 null mutants decrease the steady state expression level of several proteins (20). Surprisingly, when cryo-electron microscopy was performed on T. cruzi 80S ribosomes, TRACK was conspicuously absent (24). Nonetheless, TRACK might still affect translation in trypanosomes by other means. In S. cerevisiae, RACK1 associates with the RNA-binding protein Scp160p along with elongation factor-1α and Rps3p (64). In neurons, RACK1 is a component of ribonucleoprotein complexes where it interacts with polyA-binding protein 1 and KIAA0217 (65). In a variety of cultured cells, eIF6 prevents 80S ribosome assembly because it is phosphorylated in a manner that involves ternary complex formation with PKC and RACK1 (66).
Overall, regulatory processes that coordinate lifecycle events in T. brucei are not well understood. Here we report that TRACK is part of the cell division pathway in these organisms. The TRACK RNAi cells demonstrate that formation of the cleavage furrow is discontinuous in terms of its protein requirements while cell cycle progression of fused cells is asynchronous. Growth studies of the TRACK RNAi cells demonstrate that TRACK is essential for cell survival in BF and PF cells. Current efforts are underway to identify TRACK partners and to identify proteins that change upon induction of TRACK RNAi.
Supplementary Material
Figure S1. Sequence comparisons between TRACK and its homologues. TRACK is compared with CACK (from Crithidia; accession number AAC116380), RACK1 (rat; accession number P25388) and Cpc2 (S. pombe: accession number AAA5685). The WD consensus motif and loop regions are indicated above the sequence. The grey boxes indicate residues that are identical with TRACK. Binding motifs within RACK1 or Cpc2 are labeled with black boxes. Motifs include the RACK1 PKC-binding sites (PKC), Cpc2 Ran Kinase recognition site referred to as Ran Kinase Domains (RKD), and the tyrosine phosphorylation sites in RACK1 (P-Y).
Figure S2. Comparisons of TRACK levels in control PF cells and in PF cells transformed with pTSA.TRACK.AU1. Western blots were used to calculate the extent to which transfomation of PF cells with pTSA.TRACK.AU1 increased the total level of TRACK. The Integrated Density Value was determined. Rabbit antibodies to TRACK were used to evaluate the total amount of TRACK while antibodies to GAPDH were used as a loading control. A. Linearity of the assay to varying amounts of cell homogenate was tested by western blot. Control PF cells (5×10⁷ cells in 50 μl) were boiled in SDS-PAGE sample buffer and the following volume was added to each lane of a polyacrylamide gel:1 μl, 2 μl, 3 μl, 4 μl, 5 μl, 6 μl, 8 μl and 10 μl, as indicated. The boxes outline the region chosen for IDV measurements. B. The data from panel A were plotted to demonstrate that the ratio of IDV for TRACK:GAPDH is independent of protein concentration over a 10-fold range of values. C. The IDV data from 4 independent experiments are shown. The summary indicates that the average IDV for the pTSA.TRACK.AU1 cells increased by 8.9 ± 0.08% above the control PF cells.
Acknowledgments
We are grateful to our colleagues for their generosity with reagents. We wish to thank G. Cross, The Rockefeller University for the trypanosome cell lines; Tom. Seebeck, University of Bern, for antibodies against trypanosome PFR; Jay Bangs, University of Wisconsin for antibodies against Tb.BiP; Paul Michaels, Christian de Duve Institute of Cellular Pathology, Brussels, for antibodies against Tb.GAPDH; Steve Hajduk, Marine Biology Laboratory, Woods Hole, MA, for antibodies against Tb.cytochrome C1; P. Englund, Johns Hopkins University for pZJM vector; D. Mochly-Rosen, Stanford University for expression plasmid pDM31 containing rat RACK1; and Maureen McLeod State University of New York, Downtown Medical Center for the S. pombe SBP190 null mutants and corresponding pALT expression vectors. We also wish to thank Jim Waddle, Southern Methodist University for his critical review of this paper. The work was supported by NIH grants AI24627 and AI051531.
The abbreviations used are
- BF
bloodstream forms
- CACK
Crithidia Receptor for Activated C kinase
- DAPI
4′-6-diamidino-2-phenylindole
- GPI
glycosylphosphatidylinositol
- LACK
Leishmania Receptor for Activated C Kinase
- PF
procyclic forms
- PFR
paraflagellar rod
- PKC
protein kinase C
- SF
stumpy forms
- TRACK
Trypanosome Receptor for Activated C Kinase
References
- 1.Parsons M, Ruben L. Parasitol Today. 2000;16:56–62. doi: 10.1016/s0169-4758(99)01590-2. [DOI] [PubMed] [Google Scholar]
- 2.Ruben L, Kelly JM, Chakrabarti D. In: Molecular Medical Parasitology. Marr JJ, Nilsen TW, Komuniecki RW, editors. Amsterdam: Academic Press; 2003. pp. 241–276. [Google Scholar]
- 3.Moreno SN, Docampo R. Curr Opin Microbiol. 2003;6:359–364. doi: 10.1016/s1369-5274(03)00091-2. [DOI] [PubMed] [Google Scholar]
- 4.Kilunga KB, et al. J Biol Chem. 2005;280:26371–82. doi: 10.1074/jbc.M413884200. [DOI] [PubMed] [Google Scholar]
- 5.Schechtman D, Mochly-Rosen D. Oncogene. 2001;20:6339–6347. doi: 10.1038/sj.onc.1204778. [DOI] [PubMed] [Google Scholar]
- 6.McCahill A, Warwicker J, Bolger GB, Houslay MD, Yarwood SJ. Mol Pharmacol. 2002;62:1261–1273. doi: 10.1124/mol.62.6.1261. [DOI] [PubMed] [Google Scholar]
- 7.Chang BY, Harte RA, Cartwright CA. Oncogene. 2002;21:7619–7629. doi: 10.1038/sj.onc.1206002. [DOI] [PubMed] [Google Scholar]
- 8.Rodriguez MM, Ron D, Touhara K, Chen CH, Mochly-Rosen D. Biochemistry. 1999;38:13787–94. doi: 10.1021/bi991055k. [DOI] [PubMed] [Google Scholar]
- 9.Ron D, Luo J, Mochly-Rosen D. J Biol Chem. 1995;270:24180–87. doi: 10.1074/jbc.270.41.24180. [DOI] [PubMed] [Google Scholar]
- 10.Usacheva A, Smith R, Minshall R, Baida G, Seng S, Croze E, Colamonici O. J Biol Chem. 2001;276:22948–53. doi: 10.1074/jbc.M100087200. [DOI] [PubMed] [Google Scholar]
- 11.Kiely PA, Sant A, O’Connor R. J Biol Chem. 2002;277:22581–89. doi: 10.1074/jbc.M201758200. [DOI] [PubMed] [Google Scholar]
- 12.Geijsen N, Spaargaren M, Raaijmakers JA, Lammers JW, Koenderman L, Coffer PJ. Oncogene. 18:5126–5130. doi: 10.1038/sj.onc.1202896. [DOI] [PubMed] [Google Scholar]
- 13.Besson A, Wilson TL, Yong VW. J Biol Chem. 2002;277:22073–84. doi: 10.1074/jbc.M111644200. [DOI] [PubMed] [Google Scholar]
- 14.Mourton T, Hellberg CB, Burden-Gulley SM, Hinman J, Rhee A, Brady-Kalnay SM. J Biol Chem. 2001;276:14896–901. doi: 10.1074/jbc.M010823200. [DOI] [PubMed] [Google Scholar]
- 15.Steele MR, McCahill A, Thompson DS, MacKenzie C, Isaacs NW, Houslay MD, Bolger GB. Cell Signal. 2001;13:507–513. doi: 10.1016/s0898-6568(01)00167-x. [DOI] [PubMed] [Google Scholar]
- 16.Osmanagic-Myers S, Wiche G. J Biol Chem. 2004;279:18701–10. doi: 10.1074/jbc.M312382200. [DOI] [PubMed] [Google Scholar]
- 17.Won M, Park SK, Hoe KL, Jang YJ, Chung KS, Kim DU, Kim HB, Yoo HS. Biochem Biophys Res Commun. 2001;282:10–15. doi: 10.1006/bbrc.2001.4535. [DOI] [PubMed] [Google Scholar]
- 18.Gerbasi VR, Weaver CM, Hill S, Friedman DB, Link AJ. Mol Cell Biol. 2004;24:8276–8287. doi: 10.1128/MCB.24.18.8276-8287.2004. [DOI] [PMC free article] [PubMed] [Google Scholar]
- 19.Sengupta J, Nilsson J, Gursky R, Spahn CM, Nissen P, Frank J. Nat Struct Molec Biol. 2004;11:957–962. doi: 10.1038/nsmb822. [DOI] [PubMed] [Google Scholar]
- 20.Shor B, Calaycay J, Rushbrook J, McLeod M. J Biol Chem. 2003;278:49119–28. doi: 10.1074/jbc.M303968200. [DOI] [PubMed] [Google Scholar]
- 21.Manuell AL, Yamaguchi K, Haynes PA, Milligan RA, Mayfield SP. J Mol Biol. 2005;351:266–279. doi: 10.1016/j.jmb.2005.06.022. [DOI] [PubMed] [Google Scholar]
- 22.Giavalisco P, Wilson D, Kreitler T, Lehrach H, Klose J, Gobom J, Fucini P. Plant Mol Biol. 2005;57:577–591. doi: 10.1007/s11103-005-0699-3. [DOI] [PubMed] [Google Scholar]
- 23.He DY, Vagts AJ, Yaka R, Ron D. Mol Pharmacol. 2002;62:272–280. doi: 10.1124/mol.62.2.272. [DOI] [PubMed] [Google Scholar]
- 24.Gao H, Ayub MJ, Levin MJ, Frank J. Proc Natl Acad Sci, USA. 2005;102:10206–11. doi: 10.1073/pnas.0500926102. [DOI] [PMC free article] [PubMed] [Google Scholar]
- 25.Mougneau E, Altare F, Wakil AE, Zheng S, Coppola T, Wang ZE, Waldmann R, Locksley RM, Glaichenhaus N. Science. 1995;268:563–566. doi: 10.1126/science.7725103. [DOI] [PubMed] [Google Scholar]
- 26.Taladriz S, Gonzalez-Aseguinolaza G, Marquet A, Larraga V. FEBS Lett. 1999;443:375–380. doi: 10.1016/s0014-5793(99)00006-x. [DOI] [PubMed] [Google Scholar]
- 27.Matthews KR, Gull K. Mol Biochem Parasitol. 1998;95:81–95. doi: 10.1016/s0166-6851(98)00100-5. [DOI] [PubMed] [Google Scholar]
- 28.Welburn SC, Murphy NB. Cell Death Differ. 1998;5:615–622. doi: 10.1038/sj.cdd.4400393. [DOI] [PubMed] [Google Scholar]
- 29.Kelly BL, Stetson DB, Locksley RM. J Exp Med. 2003;198:1689–1698. doi: 10.1084/jem.20031162. [DOI] [PMC free article] [PubMed] [Google Scholar]
- 30.Skop AR, Liu H, Yates J, III, Meyer BJ, Heald R. Science. 2004;305:61–66. doi: 10.1126/science.1097931. [DOI] [PMC free article] [PubMed] [Google Scholar]
- 31.Ploubidou A, Robinson DR, Docherty RC, Ogbadoyi EO, Gull K. J Cell Sci. 1999;112:4641–4650. doi: 10.1242/jcs.112.24.4641. [DOI] [PubMed] [Google Scholar]
- 32.Wirtz E, Leal Sl, Ochatt C, Cross GA. Mol Biochem Parasitol. 1999;99:89–101. doi: 10.1016/s0166-6851(99)00002-x. [DOI] [PubMed] [Google Scholar]
- 33.Hirumi H, Hirumi K. J Parasitol. 1989;75:985–989. [PubMed] [Google Scholar]
- 34.Ruben L, Ridgley EL, Haghighat NG, Chan E. Mol Biochem Parasitol. 1991;46:123–136. doi: 10.1016/0166-6851(91)90206-l. [DOI] [PubMed] [Google Scholar]
- 35.Medina-Acosta E, Cross GA. Mol Biochem Parasitol. 1993;59:327–329. doi: 10.1016/0166-6851(93)90231-l. [DOI] [PubMed] [Google Scholar]
- 36.Sommer JM, Cheng QL, Keller GA, Wang CC. Mol Biol Cell. 1992;3:749–759. doi: 10.1091/mbc.3.7.749. [DOI] [PMC free article] [PubMed] [Google Scholar]
- 37.McLeod M, Shor B, Caporaso A, Wang W, Chen H, Hu L. Mol Cell Biol. 2000;20:4016–4027. doi: 10.1128/mcb.20.11.4016-4027.2000. [DOI] [PMC free article] [PubMed] [Google Scholar]
- 38.Wang Z, Morris JC, Drew ME, Englund PT. J Biol Chem. 2000;211:4998–5005. [Google Scholar]
- 39.Traub-Cseko YM, Costa-Pinto D, McMahon-Pratt D. Parasitology Today. 1998;14:41–42. doi: 10.1016/s0169-4758(97)01156-3. [DOI] [PubMed] [Google Scholar]
- 40.Hammarton TC, Lillico SG, Welburn SC, Mottram JC. Molec Microbiol. 2005;56:104–116. doi: 10.1111/j.1365-2958.2005.04542.x. [DOI] [PMC free article] [PubMed] [Google Scholar]
- 41.Kushnirov VV. Yeast. 2000;16:857–860. doi: 10.1002/1097-0061(20000630)16:9<857::AID-YEA561>3.0.CO;2-B. [DOI] [PubMed] [Google Scholar]
- 42.Torri AF, Bertrand KI, Hajduk SL. Mol Biochem Parasitol. 1993;57:305–315. doi: 10.1016/0166-6851(93)90206-d. [DOI] [PubMed] [Google Scholar]
- 43.Mamidipudi V, Zhang J, Lee KC, Cartwright CA. Mol Cell Biol. 2004;24:6788–6798. doi: 10.1128/MCB.24.15.6788-6798.2004. [DOI] [PMC free article] [PubMed] [Google Scholar]
- 44.Chang BY, Conroy KB, Machleder EM, Cartwright CA. Mol Cell Biol. 1998;18:3245–3256. doi: 10.1128/mcb.18.6.3245. [DOI] [PMC free article] [PubMed] [Google Scholar]
- 45.Woodward R, Gull K. J Cell Sci. 1990;95:49–57. doi: 10.1242/jcs.95.1.49. [DOI] [PubMed] [Google Scholar]
- 46.Grellier P, Sinou V, Garreau-de Loubresse N, Bylen E, Boulard Y, Schrevel J. Cell Motil Cytoskeleton. 1999;42:36–47. doi: 10.1002/(SICI)1097-0169(1999)42:1<36::AID-CM4>3.0.CO;2-G. [DOI] [PubMed] [Google Scholar]
- 47.Das A, Gale M, Jr, Carter V, Parsons M. J Cell Sci. 1994;107:3477–3483. doi: 10.1242/jcs.107.12.3477. [DOI] [PubMed] [Google Scholar]
- 48.Lillico S, Field MC, Blundell P, Coombs GH, Mottram JC. Molec Biol Cell. 2003;14:1182–1194. doi: 10.1091/mbc.E02-03-0167. [DOI] [PMC free article] [PubMed] [Google Scholar]
- 49.Li Z, Wang CC. J Biol Chem. 2003;278:20652–58. doi: 10.1074/jbc.M301635200. [DOI] [PubMed] [Google Scholar]
- 50.Hammarton TC, Engstler M, Mottram JC. J Biol Chem. 2004;279:24757–64. doi: 10.1074/jbc.M401276200. [DOI] [PubMed] [Google Scholar]
- 51.Tu X, Wang CC. J Biol Chem. 2004;279:20519–28. doi: 10.1074/jbc.M312862200. [DOI] [PubMed] [Google Scholar]
- 52.Tu X, Wang CC. Molec Biol Cell. 2005;16:97–105. doi: 10.1091/mbc.E04-05-0368. [DOI] [PMC free article] [PubMed] [Google Scholar]
- 53.Lew DJ, Marini NJ, Reed SI. Cell. 1992;69:317–327. doi: 10.1016/0092-8674(92)90412-6. [DOI] [PubMed] [Google Scholar]
- 54.Vedrenne C, Giroud C, Robinson DR, Besteiro S, Bosc C, Bringaud F, Baltz T. Molec Biol Cell. 2002;13:1058–1070. doi: 10.1091/mbc.01-06-0298. [DOI] [PMC free article] [PubMed] [Google Scholar]
- 55.LaCount DJ, Barrett B, Donelson JE. J Biol Chem. 2002;277:17580–88. doi: 10.1074/jbc.M200873200. [DOI] [PubMed] [Google Scholar]
- 56.Kohl L, Robinson D, Bastin P. EMBO J. 2003;22:5336–546. doi: 10.1093/emboj/cdg518. [DOI] [PMC free article] [PubMed] [Google Scholar]
- 57.Berriman M, et al. Science. 2005;309:416–422. doi: 10.1126/science.1112642. [DOI] [PubMed] [Google Scholar]
- 58.Hammarton TC, Clark J, Douglas F, Boshart M, Mottram JC. J Biol Chem. 2003;278:22877–86. doi: 10.1074/jbc.M300813200. [DOI] [PubMed] [Google Scholar]
- 59.Inoue M, Nakamura Y, Yasuda K, Yasaka N, Hara T, Schnaufer A, Stuart K, Fukuma T. J Biol Chem. 2005;280:14085–96. doi: 10.1074/jbc.M412336200. [DOI] [PubMed] [Google Scholar]
- 60.Sheader K, Vaughan S, Minchin J, Hughes K, Gull K, Rudenko G. Proc Natl Acad Sci USA. 2005;102:8716–8721. doi: 10.1073/pnas.0501886102. [DOI] [PMC free article] [PubMed] [Google Scholar]
- 61.Garcia-Salcedo JA, Perez-Morga D, Gijon P, Dilbeck V, Pays E, Nolan DP. EMBO J. 2004;23:780–789. doi: 10.1038/sj.emboj.7600094. [DOI] [PMC free article] [PubMed] [Google Scholar]
- 62.Ron D, Jiang Z, Yao L, Vagts A, Diamond I, Gordon A. J Biol Chem. 1999;274:27039–46. doi: 10.1074/jbc.274.38.27039. [DOI] [PubMed] [Google Scholar]
- 63.Loreni F, Iadevaia V, Tino E, Caldarola S, Amaldi F. FEBS Lett. 2005;579:5517–5520. doi: 10.1016/j.febslet.2005.09.016. [DOI] [PubMed] [Google Scholar]
- 64.Baum S, Bittins M, Frey S, Seedorf M. Biochem J. 2004;380:823–830. doi: 10.1042/BJ20031962. [DOI] [PMC free article] [PubMed] [Google Scholar]
- 65.Angenstein F, Evans AM, Settlage RE, Moran ST, Ling SC, Klintsova AY, Shabanowitz J, Hunt DF, Greenough WT. J Neurosci. 2002;22:8827–8837. doi: 10.1523/JNEUROSCI.22-20-08827.2002. [DOI] [PMC free article] [PubMed] [Google Scholar]
- 66.Ceci M, Gaviraghi C, Gorrini C, Sala LA, Offenhauser N, Marchisio PC, Biffo S. Nature. 2003;426:579–584. doi: 10.1038/nature02160. [DOI] [PubMed] [Google Scholar]
Associated Data
This section collects any data citations, data availability statements, or supplementary materials included in this article.
Supplementary Materials
Figure S1. Sequence comparisons between TRACK and its homologues. TRACK is compared with CACK (from Crithidia; accession number AAC116380), RACK1 (rat; accession number P25388) and Cpc2 (S. pombe: accession number AAA5685). The WD consensus motif and loop regions are indicated above the sequence. The grey boxes indicate residues that are identical with TRACK. Binding motifs within RACK1 or Cpc2 are labeled with black boxes. Motifs include the RACK1 PKC-binding sites (PKC), Cpc2 Ran Kinase recognition site referred to as Ran Kinase Domains (RKD), and the tyrosine phosphorylation sites in RACK1 (P-Y).
Figure S2. Comparisons of TRACK levels in control PF cells and in PF cells transformed with pTSA.TRACK.AU1. Western blots were used to calculate the extent to which transfomation of PF cells with pTSA.TRACK.AU1 increased the total level of TRACK. The Integrated Density Value was determined. Rabbit antibodies to TRACK were used to evaluate the total amount of TRACK while antibodies to GAPDH were used as a loading control. A. Linearity of the assay to varying amounts of cell homogenate was tested by western blot. Control PF cells (5×10⁷ cells in 50 μl) were boiled in SDS-PAGE sample buffer and the following volume was added to each lane of a polyacrylamide gel:1 μl, 2 μl, 3 μl, 4 μl, 5 μl, 6 μl, 8 μl and 10 μl, as indicated. The boxes outline the region chosen for IDV measurements. B. The data from panel A were plotted to demonstrate that the ratio of IDV for TRACK:GAPDH is independent of protein concentration over a 10-fold range of values. C. The IDV data from 4 independent experiments are shown. The summary indicates that the average IDV for the pTSA.TRACK.AU1 cells increased by 8.9 ± 0.08% above the control PF cells.