

Abstract
Purpose
Necrosis is the most common morphological alteration found in tumors and surrounding normal tissues after radiation therapy or chemotherapy. Accurate measurement of necrosis may provide an early indication of treatment efficacy or associated toxicity. The purpose of this report is to evaluate the selective accumulation of polymeric paramagnetic magnetic resonance (MR) contrast agents—gadolinium p-aminobenzyl-diethylenetriaminepentaacetic acid-poly(glutamic acid) (L-PG-DTPA-Gd and D-PG-DTPA-Gd)—in necrotic tissue.
Methods and Materials
Two different solid tumor models, human Colo-205 xenograft and syngeneic murine OCA-1 ovarian tumors, were used in this study. Necrotic response was induced by treatment with poly(L-glutamic acid)-paclitaxel conjugate (PG-TXL). T1-weighted spin-echo images were obtained immediately and up to 4 days after contrast injection and compared with corresponding histologic specimens. Two low-molecular-weight contrast agents, DTPA-Gd and oligomeric(L-glutamic acid)-DTPA-Gd, were used as nonspecific controls.
Results
Initially, there was minimal tumor enhancement following injection of either L-PG-DTPA-Gd or D-PG-DTPA-Gd but rapid enhancement following injection of low-molecular-weight agents. However, polymeric contrast agents, but not low-molecular-weight contrast agents, caused sustained enhancement in regions of tumor necrosis in both tumors treated with PG-TXL and untreated tumors. These data indicate that high molecular weight, rather than in vivo biodegradation, is necessary for the specific localization of polymeric MR contrast agents to necrotic tissue. Moreover, biotinylated L-PG-DTPA-Gd co-localized with macrophages in the tumor necrotic areas, suggesting that selective accumulation of L- and D-PG-DTPA-Gd in necrotic tissue was mediated through residing macrophages.
Conclusions
Our data suggest that MRI with PG-DTPA-Gd may be a useful technique for noninvasive characterization of treatment-induced necrosis.
Keywords: Magnetic resonance imaging, necrosis, macrophages, polymer, treatment response
Introduction
Necrosis is the most common morphological alteration found in tumors after radiation therapy and chemotherapy. Patients with clinical improvement with therapy sometimes have no decrease in tumor size but have increased necrosis (1). In addition, in some tumors, the degree of therapy-induced necrosis has been shown to be associated with long-term treatment outcome (2-4). For example, in patients with primary osteosarcoma undergoing chemotherapy, extensive necrosis is highly predictive of improved long-term survival (2, 3). On the other hand, in patients with pancreatic cancer undergoing neoadjuvant chemoradiotherapy followed by resection, extensive necrosis is a strong and independent predictor of worse overall survival (4). Therefore, although reduction in tumor size is the standard index of therapeutic efficacy, in some tumors, the size of the necrotic area after therapy may be more informative.
Likewise, differentiation of radiation necrosis from recurrent disease after radiotherapy represents a substantial challenge for clinicians. CT and MRI offer imperfect discrimination of tumor viability and radiation necrosis (5, 6). Some newer imaging techniques have shown some ability to non-invasively differentiate tumor recurrence from radiation necrosis, including positron emission tomography (PET), single-photon emission computed tomography (SPECT), and 1H MR spectroscopy. However, they are not entirely reliable. For example, using [18F]fluorodeoxyglucose or L-[methyl-11C]methionine-PET scanning, differentiation between necrosis induced by radiation and low-grade glioma has occasionally proven difficult (7). Using 201thallium (201Tl)-SPECT scanning, increased 201TI uptake was observed in both radiation necrosis and inflammatory/infectious processes (8). 1H MR spectroscopy allow reliable differential diagnostic statements to be made when the tissues are composed of either pure tumor or pure necrosis, however spectral patterns are less definitive when tissues composed of varying degrees of mixed tumor and necrosis are examined (9).
T2-weighted images, commonly used to evaluate extent of necrosis on the basis of its hyperintense appearance, are not specific for necrosis because other components, such as edema and cystic changes, are also hyperintense on such sequences. More recently, diffusion-weighted MRI, which can reveal changes in tumor water diffusion rates, has been shown to be a sensitive technique for identifying regions of necrosis (10, 11), and for differentiating radiation induced brain injury from tumor recurrence (6). However, further work is required to determine whether the measured changes in water diffusion are a reproducible and specific response to necrosis because other effects, such as edema and cystic changes, may also increase water diffusion rates independent of necrosis. Other limitations of current diffusion-weighted MRI techniques include relatively low spatial resolution, suboptimal geometric accuracy, and low signal-to-noise ratio. Furthermore, if long acquisition times are used to improve signal-to-noise ratio, gross motion can negatively affect measurements of the apparent diffusion coefficient (12).
If MRI of necrosis is to be developed into a viable technique for the assessment of chemo- and radiotherapy induced necrosis, an MR contrast agent must be identified that selectively accumulates in necrotic tissue and provides high contrast-to-noise ratio. In the present study, we report preliminary MRI study of two such agents, L-PG-DTPA-Gd and D-PG-DTPA-Gd, in two different solid tumor models. L-PG is a synthetic polyamino acid that can be readily degraded by lysosomal enzymes whereas D-PG is not degradable.
Materials and Methods
Materials
P-aminobenzyl-diethylenetriaminepentaacetic acid-t-butyl ester [NH2-benzyl-DTPA(t-butyl ester)] was obtained from Macrocyclics (Dallas, TX). L-PG (Mn = 41.4 KDa), D-PG (Mn = 26.6 KDa), MES buffer, and cathepsin B were purchased from Sigma-Aldrich Chemicals Inc. (St. Louis, MO). 1-Ethyl-3-(3-dimethylaminopropyl)carbodiimide (EDC), (+)-biotinyl-3,6-dioxaoctanediamine, and EZ biotin quantitation kit were obtained from Pierce (Rockford, IL). Spectra/Pro 7 dialysis tubing with molecular-weight cutoff of 10,000 and Centricon Plus-20 centrifugal filters were purchased from Fisher Scientific (Pittsburgh, PA). PD-10 columns was purchased from Amersham-Pharmacia Biotech (Piscataway, NJ). DTPA-Gd (gadopentetate dimeglumine, Magnevist) was purchased from Berlex Laboratories, Inc. (Wayne, NJ).
Water-soluble paclitaxel analogue poly(L-glutamic acid)-paclitaxel (PG-TXL) was synthesized according to previously reported procedures (13). The compound had a number-average molecular weight of 119K, had a polydispersity of 1.04, and contained 24% paclitaxel by weight.
Analytical methods
Gel permeation chromatography was performed on a Waters (Milford, MA) high-performance liquid chromatography system consisting of a 600 controller, a 717 plus auto sampler, and a Viscotek E-Zpro triple detector (Viscotek, Houston, TX) that records refractive index, viscosity, and light-scattering signals. The samples were separated using a TSK-G4000PW 4.6 mm × 30 cm column (TosoHaas, Montgomeryville, PA) eluted with phosphate-buffered saline (PBS) containing 0.1% LiBr at a flow rate of 1.0 ml/minutes. Number-average molecular weights of the polymer conjugates were calculated using Viscotek TriSEC gel permeation chromatography software. The degree of DTPA substitution was determined by titrating DTPA with GdCl3 solution using 4-(2-pyridylazo)-resorcinol as a Gd3+ indicator. Elemental analysis was performed by Galbreith Laboratories (Knoxville, Tenn).
Synthesis and characterization of L-PG-DTPA-Gd, D-PG-DTPA-Gd, biotinylated L-PG-DTPA-Gd, and Oligo(L-glutamic acid-DTPA-Gd)
L-PG-DTPA-Gd and D-PG-DTPA-Gd were synthesized from L-PG and D-PG, respectively, using previously reported procedures (14). Briefly, each PG polymer (130 mg, 1.0 mmoles of carboxylic unit) was reacted with NH2-benzyl-DTPA(t-butyl ester) (281 mg, 0.36 mmoles) using 1,3-diisopropylcarbodiimide (52 mg, 0.4 mmoles) as the coupling reagent and pyridine (0.16 mL) as the base. At the end of the reaction, the protecting groups in NH2-benzyl-DTPA(t-butyl ester) were removed by treatment with trifluoroacetic acid. The dried product was dissolved in 1 M NaHCO3, and the solution was dialyzed against PBS and de-ionized water sequentially (molecular weight cut-off 10,000), filtered, and lyophilized to yield 230 mg of spongelike powder. To chelate Gd3+ with PG-DTPA, 0.37 mL of GdCl3·6H2O (100 mg/ml, 0.1 mmoles) in 0.1 M sodium acetate solution was added into 10 mL of a sodium acetate-buffered aqueous solution of PG-DTPA. The solution was dialyzed against water (molecular weight cutoff 10,000) until no free Gd3+ was detectable in the receiving vessel. The solution was then lyophilized to yield the final product. The chemical structures of PG-DTPA-Gd are shown in Figure 1 and the physicochemical properties of L- and D-PG-DTPA-Gd are summarized in Table 1.
Fig. 1.
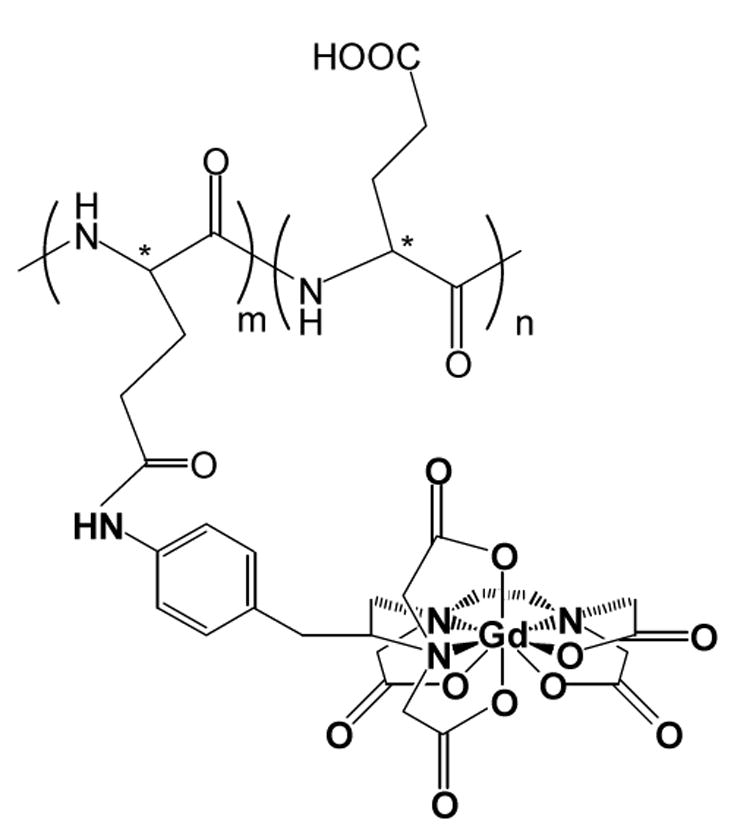
Chemical structure of PG-DTPA-Gd. L-PG-DTPA-Gd and D-PG-DTPA-Gd differ in their stereoisomeric carbon center (*). In oligomeric (L-glutamic acid)-DTPA-Gd, the number of repeating units m and n = 1-3. DTPA-Gd chelates are randomly distributed in the polymer chain.
Table 1.
Physicochemical properties of Gd-DTPA-bound poly(L-glutamic acid)
| Property | L-PG-DTPA-Gd | D-PG-DTPA-Gd | DTPA-Gd |
|---|---|---|---|
| Molecular Weight | 101,400* | 85,200* | 560 |
| Polydispersity† | 1.20 | 1.42 | |
| Degree of substitution | 0.23‡ | 0.19‡ | |
| (mol/mol of COOH) | |||
| Gd content, % (w/w)§ | 10.7 | 12.0 | 28.5 |
| Relaxivity¶ | |||
| R1 | 8.1 | 8.0 | 4.1 |
| R2 | 21.5 | 26.5 | 5.2 |
Measured by gel permeation chromatography with a Viscotek E-Zpro triple detector system as described in Materials and Methods.
Polydispersity is defined as the ratio between weight average molecular weight and number average molecular weight (Mw/Mn).
Determined by UV/Vis measurement of Bz-DTPA absorbance at 250 nm.
Measured by elemental analysis.
All data were obtained at 4.7T in PBS. Data for Gd-DTPA were taken from reference measured at 1.5T (24).
To prepare biotinylated L-PG-DTPA-Gd, L-PG-DTPA-Gd (200 mg, 0.00125 mmoles) was stirred at room temperature with (+)-biotinyl-3,6-dioxaoctanediamine (10 mg, 0.027 mmol) and EDC (20 mg, 0.1 mmol) in 0.1 M MES buffer (pH 6.1) for 2 hours. The reaction product was purified by dialysis against PBS and water (molecular weight cut-off, 10 KDa). The resulting solution was lyophilized to yield 196 mg of biotin-L-PG-DTPA-Gd. The number of biotin molecules attached to PG polymer was quantified using an EZ biotin quantitation kit. Seven biotin molecules (2.5% carboxylic acid units) were attached to each L-PG-DTPA-Gd conjugate.
To prepare oligo(L-glutamic acid)-DTPA-Gd, L-PG-DTPA-Gd was dissolved in PBS buffer (pH 5) at a concentration of 5.3 mg/ml. Cathepsin B was added to the solution to a final concentration of 10 units/ml. The solution was incubated at 37°C for 24 hours. Complete degradation of L-PG-DTPA-Gd was confirmed by gel permeation chromatography and by liquid chromatography-mass spectrometry. The major degradation products were Glu-Glu and Glu-Glu-DTPA-Gd dimmers.
Mouse models
All animal work was carried out in the Small Animal Imaging Facility at The University of Texas M. D. Anderson Cancer Center in accordance with institutional guidelines. Human Colo-205 colon carcinoma cells (2×10⁶ cells plus matrigel, 2:1) were inoculated subcutaneously on the backs of CD-1 nude mice (n = 6) 1 cm above the base of the tail. Animals were initially imaged when the tumors had grown to approximately 350 mm3.
C3Hf/Kam mice were bred and maintained in a pathogen-free facility. Solitary tumors were produced in female C3H/Kam mice (25-30 g) by injecting 5×10⁵ OCA-1 murine ovarian carcinoma cells into the muscle of the right thigh. Mice were divided into groups of 3 mice each when the tumors had grown to approximately 8 mm in average diameter. In the treatment groups, mice received a single dose of PG-TXL in saline at a dose of 120 equiv. paclitaxel/kg body weight. In the control groups, mice were not treated.
Magnetic resonance imaging
Mice were anesthetized with 1-2% isoflurane in 1 l/min O2 flow and placed prone within a custom sled. A custom catheter made from 2 Fr silicone tubing and a 27-gauge needle was inserted in the tail vein of each mouse. All injections of contrast agents and PG-TXL were done through the catheter. The catheter was flushed with normal saline after each injection. All mice tolerated these procedures well.
For nude mice bearing Colo-205 tumors, L-PG-DTPA-Gd (0.04 mmol Gd/kg) was injected on days 0, 2, 4, and 7. MR images were obtained before each injection of contrast agent (day 0) and 4 days after the last injection (day 11).
For C3Hf/Kam mice bearing OCA-1 tumors, L-PG-DTPA-Gd, D-PG-DTPA-Gd, and oligo(L-glutamic acid)-DTPA-Gd were injected at a dose of 0.04 mmol Gd/kg. DTPA-Gd was injected at a dose of 0.2 mmol/kg. MR images were acquired before, and at 10 minutes, 2 days, and 4 days after contrast agent injection. For PG-TXL-treated mice, injections of MRI contrast agents were initiated within 1 hour of the injection of PG-TXL.
Two-dimensional axial images were obtained using a 4.7 T/40 cm MR scanner (Bruker Biospin Corp., Billerica, MA) with 950 mT/m, 5.7 cm inner diameter actively shielded gradient coil system (19,000 mT/m-s slew rate) and a 3.5 cm inner diameter volume radiofrequency coil. T1-weighted (TE = 15 ms, TR = 1000 ms) and T2-weighted (TEeff = 80 ms, TR = 4150 ms) MR images were acquired with a 4-cm field of view, 1-mm section thickness, 0.2-mm gap, and a 256 × 256 matrix. In each imaging session, a set of sagittal T2-weighted fast spin-echo images was also acquired.
Analysis of MRI data
The pixel-by-pixel signal intensity (SI) values for tumor and for normal muscle (in the contralateral leg) were measured using regions of interest (ROIs) defined using both the pre-contrast T1-weighted and the T2-weighted image data. For each animal, three contiguous images, representing the largest tumor cross-sectional slices, were analyzed. For each section, the tumor area was computed from the total number of pixels contained in each ROI and the pixel dimension. Also in each imaging section, the signal intensity enhancement within the ROI was expressed as the ratio of SI values between tumor and normal muscle tissue—i.e., signal ratio (SR) = SI tumor / SI muscle. Mean SR values and mean tumor cross-sectional area measures were computed for each animal from the three imaging sections. From these data, the average SR values from 3 mice per group were calculated and plotted. The values were compared between groups using an unpaired Student's t test with p < 0.05. Before the calculation of SI, the tumor signal intensities were first subjected to a threshold criterion of threshold = SImuscle ROI * 1.25. This thresholding operation provided a means of consistently identifying regions of contrast agent uptake based on normal muscle signal intensity and compensates for any small variations in SI due to inter-session variation in coil tuning and matching, contrast agent dose, etc..
Histologic analysis of tumors
At the end of the last imaging session, the mice were euthanized by CO2 exposure and the tumors were immediately excised. For each individual mouse, a pre-contrast sagittal T2-weighted MR image, with cross-reference lines indicating the axial imaging slices through the tumor, was used to guide the placement of each tumor specimen so that its orientation was approximately the same as the orientation when it was imaged. The tumor was marked with a marker and then cut into cranial and caudal portions at one of the slice locations within the middle of the tumor. The two halves of the tumor were carefully marked with small cuts to delineate left or right side of the tumor. The tumor halves were then placed into a tissue cassette with the cut surface facing down, fixed in formalin, and embedded in paraffin. The paraffin-embedded samples were cut into 4-μm sections in the plane similar to that of the MR images to facilitate matching of the lesion seen on MRI with the lesion in the specimen. The sections were stained with hematoxylin and eosin (H&E) and with factor VIII (see next paragraph). Microscopy was performed with a DMR microscope (Leica Micarosystems, Inc., Bannockburn, IL).
For factor VIII staining, sections were deparaffinized in xylene, rehydrated through graded alcohols, and transferred to PBS. Immunohistochemical staining was performed using factor VIII rabbit polyclonal antibody (Zymed Laboratories, San Francisco, CA). Sections were placed in preheated antigen retrieval solution (DAKO Corporation, Carpinteria, CA) in a steamer for 20 minutes. All samples were then blocked in 3% H2O2 in methanol for 15 minutes and then incubated in 1% normal goat serum for 20 minutes. After washing steps, slides were incubated overnight at 4°C with a 1:75 concentration of anti-factor VIII. This was followed by a standard avidin-biotin peroxidase complex assay using Vector ABC Elite Kit (Vector Laboratories, Burlingame, CA). Slides were developed with 3,3′-diaminobenzidine (DAB) (Biocare Medical, Concord, CA) and counterstained with 10% hematoxylin.
For biotinylated L-PG-DTPA-Gd and macrophage staining, OCA-1 tumor-bearing mice were injected intravenously with biotin-L-PG-DTPA-Gd conjugate at a dose of 0.2 mmol Gd/kg. Tumors were removed 2 days after biotin-L-PG-DTPA-Gd injection. The tissues were fixed in neutral formalin, processed through graded alcohols, and embedded in paraffin. Five-micrometer sections of paraffin-embedded specimens were deparaffinized and rehydrated. Slides were treated as follows: incubation with 3% hydrogen peroxide solution for 5 minutes to block endogenous peroxidase, incubation with avidin and biotin blocking solutions (Biocare Medical) for 15 minutes each, incubation with Background Sniper (Biocare Medical) for 10 minutes at room temperature, and incubation with the biotin-binding Four-Plus streptavidin-horseradish peroxidase conjugate (Biocare Medical) for 5 minutes followed by DAB staining. To detect macrophages, a second immunohistochemical staining reaction was performed on the same tissue sections. Antigen retrieval was performed by treatment with Reveal citrate buffer (Biocare Medical) in a steamer for 20 minutes. Rat monoclonal antibody against mouse macrophage F4/80 antigen (Serotec, Oxford, UK) was biotinylated using a MOM biotinylation Kit (1:50 dilution, Biocare Medical) per the manufacturer's instructions. Specimens were then incubated with biotinylated antibody for 30 minutes. Lastly, the slides were incubated with Four-Plus streptavidin alkaline phosphatase conjugate (Biocare Medical) for 10 minutes and labeled with a Vulcan Fast Red substrate kit (Biocare Medical). Slices were counterstained with hematoxylin (blue) for 30 seconds, cover-slipped with Permount (Fisher), and viewed under a microscope.
Results
MRI of Colo-205 tumors in CD-1 nude mice
To correlate intratumoral distribution of L-PG-DTPA-Gd with histologic findings, we imaged Colo-205 tumors inoculated subcutaneously on the back of a CD-1 nude mouse. Multiple doses of L-PG-DTPA-Gd were given intravenously in an attempt to maximize the signal intensity of the contrast agent. Images acquired on day 2 (2 days after the first dose), day 4 (2 days after the second dose), day 7 (3 days after the third dose), and day 11 (4days after the fourth and last dose) revealed a similar pattern of intratumoral distribution of L-PG-DTPA-Gd. Figure 2 shows representative T2-weighted (A) and T1-weighted (B) transverse MR images of a Colo-205 tumor. On the T1-weighted image (Fig.2B), the central zone of the tumor was significantly enhanced. An H&E-stained section of the tumor in the same plane as the MR image showed areas of necrosis that closely resembled the areas of positively enhanced signal in the MR image (Fig. 2C). On the other hand, while the T2-weighted image (Fig. 2A) showed the presence of presumed necrosis in the central zone of the tumor, the distribution of the hyperintense areas was poorly defined and did not match the area of necrosis in the H&E-stained section. These results suggested that L-PG-DTPA-Gd is distributed to the necrotic area of the tumor and that T1-weighted imaging with this agent is more accurate than conventional T2-weighted imaging in mapping necrosis.
Fig. 2.
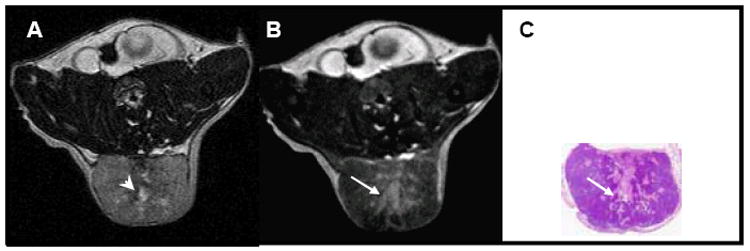
Representative images from a mouse bearing a subcutaneously inoculated Colo-205 tumor. The mouse received intravenous injections of L-PG-DTPA-Gd (0.04 mmol Gd/kg) on days 0, 2, 4, 7, and 11. Shown are (A) T2-weighted and (B) T1-weighted images acquired on day 11 (before injection of L-PG-DTPA-Gd); (C) a photograph of a H&E-stained section of the tumor. Small hyperintense regions on the T2-weighted image (arrowhead in A), presumed to be necrotic regions, are contained in the more extensive hyperintense area on the T1-weighted image (arrow in B). However, the hyperintense region on the T1-weighted image is in much better agreement with the necrotic areas in the H&E-stained tumor section (arrow in C).
MRI of OCA-1 tumors in C3Hf/Kam mice
We previously showed that PG-TXL induced substantial necrotic response in syngeneic OCA-1 ovarian tumors inoculated in C3Hf/Kam mice (13). To test whether PG-DTPA-Gd could be used to detect chemotherapy-induced necrosis, we compared T1-weighted MR images of OCA-1 tumors obtained after a single intravenous injection of high-molecular-weight (PG-DTPA-Gd) and low-molecular-weight contrast agents [DTPA-Gd or oligo(L-glutamic acid)-DTPA-Gd] in C3Hf/Kam mice.
Shortly after the injection of DTPA-Gd or oligo(L-glutamic acid)-DTPA-Gd, contrast agent was rapidly distributed to the extravascular fluid space, with enhancement mainly visualized in the periphery of the tumor (Fig. 3A and D). Although a hypointense region typical of a poorly perfused or cystic component could be visualized in the central zone of the tumors in PG-TXL-treated mice, there was poor correlation between the viability of the tumor cells and the intratumoral distribution of the contrast agents (compare Figs. 3A and 3C, and 3D and 3F). The enhancement with DTPA-Gd or oligo(L-glutamic acid)-DTPA-Gd progressively diminished; on day 2 after contrast agent injection, the necrotic lesions generally were undetectable on T1-weighted images because they appeared isointense relative to the surrounding normal tissue in both treated and untreated tumors (Fig. 3B and 3E).
Fig. 3.
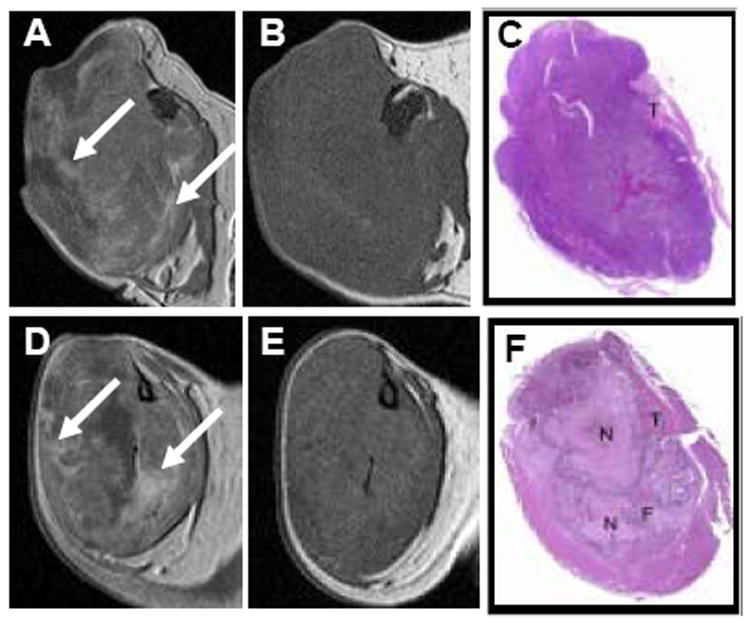
Representative transverse T1-weighted spin echo images and photographs of H&E-stained tissue sections of OCA-1 tumors after intravenous injection of oligo(L-glutamic acid)-DTPA-Gd (0.04 mmol.kg) in an untreated mouse (A-C) and DTPA-Gd (0.2 mmol/kg) in a mouse treated with PG-TXL (120 mg equiv. paclitaxel/kg) (D-F). Images were acquired at 10 minutes (A, D) and 2 days (B, E) after contrast injection. C and F: Macroscopic photographs of the tumors sectioned on the transverse plane similar to that of the MR images. N: necrosis; F: fibrosis; T: tumor. Arrows in (A) and (D) indicate representative regions of dramatic DTPA-Gd and oligo(L-glutamic acid)-DTPA-Gd uptake at 10 min following injection. These areas of enhancement are absent 2 days following injection (B, E).
In contrast to the rapid decrease in signal intensity (“wash-out”) seen after injection of DTPA-Gd and oligo(L-glutamic acid)-DTPA-Gd, the signal intensity increase due to L-PG-DTPA-Gd or D-PG-DTPA-Gd administration was significantly less but was maintained with no apparent “wash-out” over the duration of a given imaging session. In fact, both PG-DTPA-Gd agents caused a prolonged enhancement in necrotic areas of the tumors 2 days after contrast injection. Figure 4 compares MR images and corresponding photographs of H&E-stained sections of tumors after injection of L-PG-DTPA-Gd in an untreated mouse and in a mouse treated with PG-TXL. Ten minutes after contrast injection, with the exception of moderate enhancement scattered around the tumor periphery, the whole tumors were virtually indistinguishable from the surrounding muscle in both untreated and treated mice (compare Fig. 4A and 4B, and Fig. 4F and 4G). At 2 days and 4 days after contrast injection, sustained retention of the contrast agent in the tumors was seen. In tumors of untreated mice, contrast enhancement was more pronounced in isolated areas, whereas in tumors of treated mice, contrast enhancement was more pronounced throughout the tumor (compare Fig. 4C and 4H, and Fig. 4D and 4I). The tumor became discernible from the surrounding normal muscle. Similar findings were observed with D-PG-DTPA-Gd (data not shown).
Fig. 4.
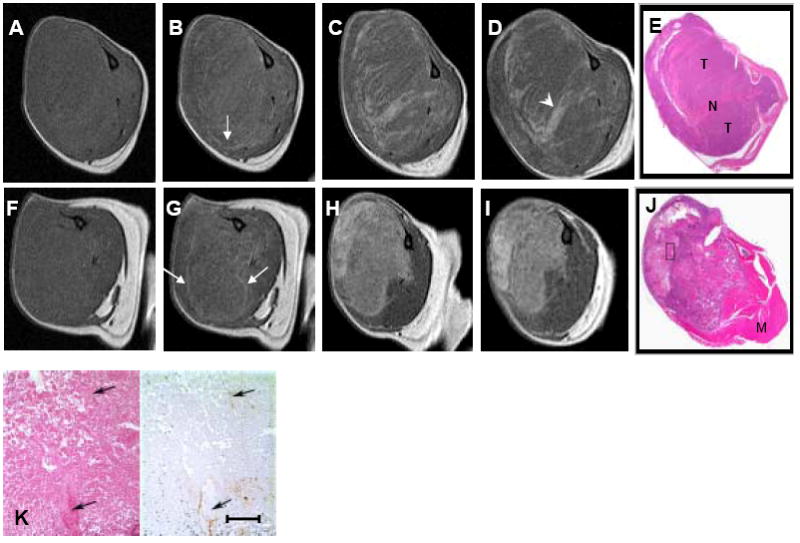
Representative MR images of OCA-1 tumors from an untreated mouse (A-E) and a mouse treated with PG-TXL (120 mg equiv. paclitaxel/kg) (F-J). Transverse T1-weighted spin echo images before (A, F) and at 10 minutes (B, G), 2 days (C, H), and 4 days (D, I) after intravenous injection of L-PG-DTPA-Gd (0.04 mmol/kg). E and J: Macroscopic photographs of the tumors sectioned on the transverse plane showing the necrotic regions in the tumors (N: necrosis; T: tumor; M: muscle). Arrows in B and G: peripheral tumor enhancement owing to blood pool imaging effect of the contrast agents; arrowheads in D: necrotic area. K: Higher-power photomicrographs (left panel: H&E stain; right panel: factor VIII immunohistochemical stain) of tumor in J from boxed region. Note the scattered factor VIII-positive cells in the necrotic zone (arrows). Scale bar: 100 μm.
The regions that demonstrated positive contrast enhancement on the delayed MR images acquired with L-PG-DTPA-Gd in both untreated and treated tumors corresponded histologically to intratumoral necrosis (Fig. 4E and J). Of interest, Fig. 4J revealed a “bean-shaped” area of coagulation and liquifactive necrosis in the top left portion of the tumor, separated by narrow zone of granulation tissue and pre-existing skeletal muscle from an area of actively growing tumor cells arranged as single cell layers on delicate fibrovascular septa surrounding central regions of caseous necrosis in the lower portion of the tumor. Contrast-enhanced MR image findings matched well with the bean-shaped liquifactive necrosis in the top-left portion and with the caseous necrosis in the lower-right portion of the tumor (Fig. 4I). Factor VIII staining of the adjacent slide revealed few endothelial cells within the necrotic zone (Fig. 4K).
Distribution of biotin-L-PG-DTPA-Gd and macrophages in OCA-1 tumors
Treatment with PG-TXL induced substantial necrotic response (compare Fig. 5A and B). Biotin-L-PG-DTPA-Gd and mouse macrophages were localized to the necrotic areas in both untreated and PG-TXL-treated tumors. Biotin-L-PG-DTPA-Gd was seen inside macrophages as it was phagocytosed (Fig. 5).
Fig. 5.
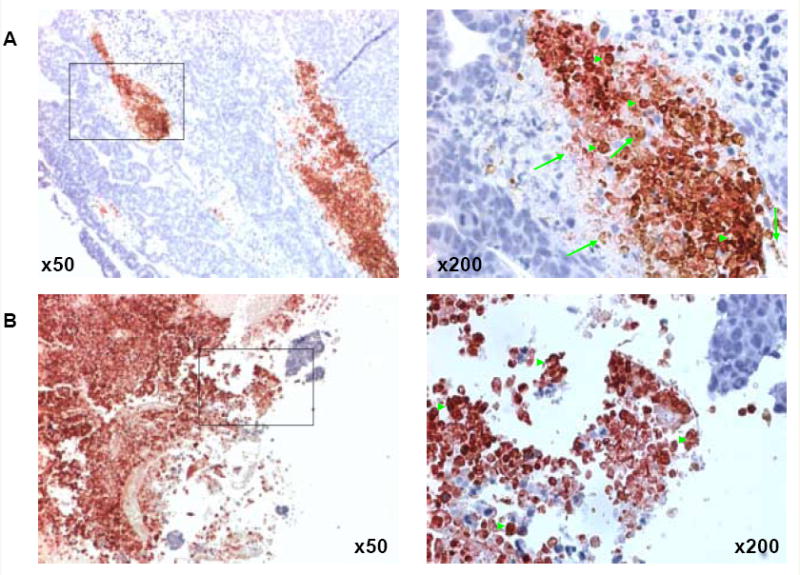
Co-localization of macrophages and biotinylated L-PG-DTPA-Gd in the necrotic area in OCA-1 tumors. Staining with anti-mouse monoclonal antibody directed against macrophage antigen F4/80 (reddish-pink) shows widespread macrophage infiltration in necrotic areas in both untreated (A) and PG-TXL-treated (B) tumors. Staining with streptavidin-horseradish peroxidase and DAB for biotinylated L-PG-DTPA-Gd shows extensive distribution of the polymer and its degradation products to the necrotic area (brown). Phagocytosed biotin-L-PG-DTPA-Gd in macrophages was also seen (brick red). The sections were counterstained with hematoxylin (blue) to label the nuclei of viable tumor cells. Examples of biotin-L-PG-DTPA-Gd staining and dual F4/80 and biotin staining are indicated with arrows and arrowheads, respectively. Most macrophages in treated tumor in the necrotic zone contained biotinylated L-PG-DTPA-Gd.
Quantitative analysis
The average tumor-to-muscle signal intensity ratios (SR) for tumors of mice treated with PG-TXL at different times after contrast injection are summarized in Fig. 6. Treatment with PG-TXL caused reduction in tumor size as reflected by an average 48% decrease in cross-section areas by day 4 (Fig. 6B), while untreated tumors increased in cross-sectional area by 36% (data not shown). While DTPA-Gd administration resulted in a 14.9% increase in SR within 10 minutes of injection and an increase of 13.1% was evident at 4 days after injection, both L-PG-DTPA-Gd and D-PG-DTPA-Gd induced significantly higher (49.1% and 51.9% at day 2, respectively) and prolonged (41.1% and 36.8% at day 4, respectively increases in SR compared to that obtained with DTPA-Gd (Fig. 6A) (p < 0.05). As expected, given the high MW of the L-PG-DTPA-Gd, the increase in SR within 10 minutes following injection was not significant.
Fig. 6.
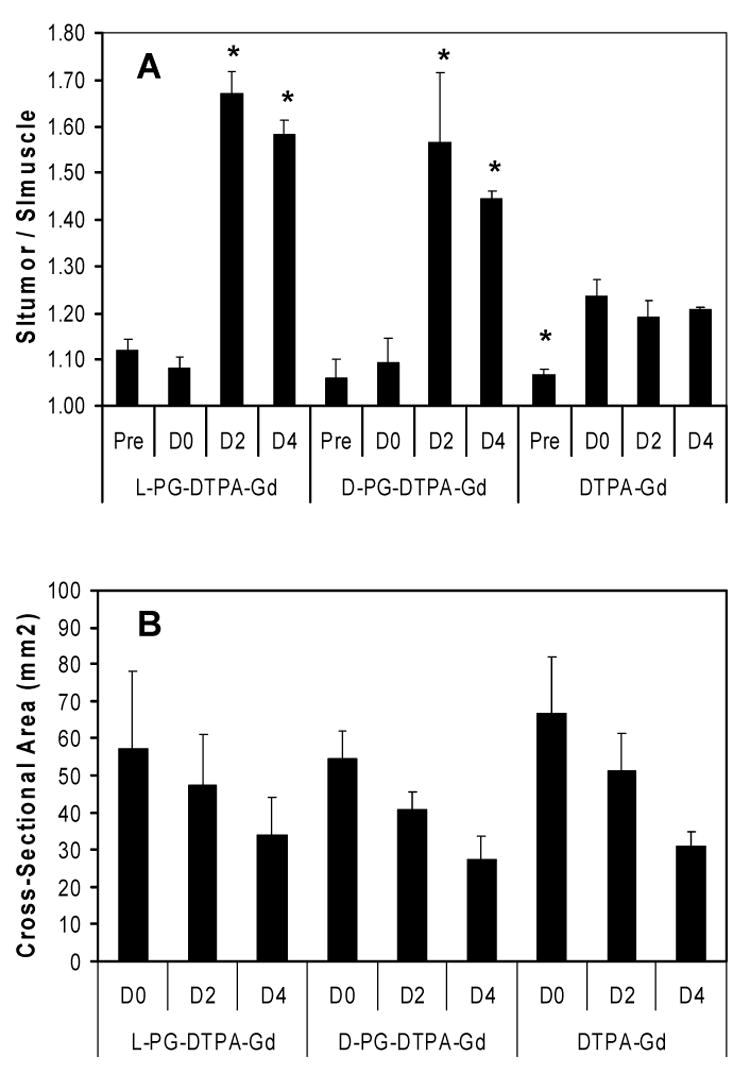
A: Comparison of signal ratio (SR) values (A) for groups of mice treated with PG-TXL and injected with L-PG-DTPA-Gd, D-PG-DTPA-Gd, or DTPA-Gd. Pre: before injection; D0: 10 min following injection; D2: 2 days following injection; and D4: 4 days following injection. B: Cross-section area of the same slices of the same tumors as in (A) measured at the indicated times. Measurements were obtained in 3 consecutive matched tumor slice images in each mouse and then averaged across groups. Each data point represents mean ± standard error (n = 3). * indicates significant difference compared to the D0 time point (p < 0.05). SI, signal intensity.
To assess the effect of treatment on necrosis, the number of pixels with a nonzero thresholded SI value was computed for the three imaging sections centered on the tumor (Fig. 7). From these data, the percent tumor enhancement was computed and averaged across all three imaging sections for each mouse. The average percent tumor enhancement for each group was then computed. The percent of tumor enhancement in mice treated with PG-TXL and injected with D-PG-DTPA-Gd was significantly greater than that of untreated mice injection with D-PG-DTPA-Gd (Fig. 7E) (p < 0.05).
Fig. 7.
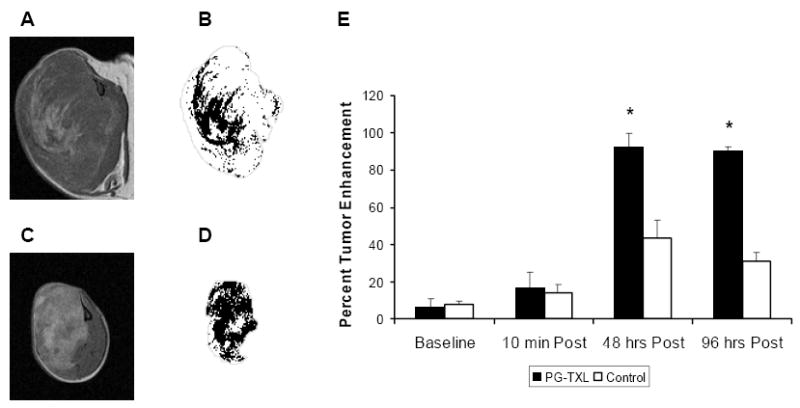
Representative sectional images of tumors (A, C) and corresponding segmentation of “necrosis” with tumor outline (gray) (B, D) obtained from mice 4 days after intravenous injection of D-PG-DTPA-Gd (0.04 mmol/kg). The mice were either not treated (A, B) or treated with PG-TXL (120 mg equiv. paclitaxel/kg) (C, D). E, Comparison of average percent enhancement (3 sections of each tumor) in untreated tumors and in tumors treated with PG-TXL. * indicates significant difference compared to the untreated tumors (p < 0.05).
Discussion
In the current study, we found that two polyanionic polymeric contrast agents—one degradable (L-PG-DTPA-Gd) and the other nondegradable (D-PG-DTPA-Gd)—induced a strong and persistent enhancement in both pre-existing and therapy-induced necrosis in solid tumors (Figs. 2 and 4).
The mechanism of selective accumulation of PG-DTPA-Gd in necrotic tissue is not entirely clear at the present time. However, the observation that biotin-L-PG-DTPA-Gd co-localized with macrophages in the necrotic tissue in OCA-1 tumors suggest that the affinity of PG-DTPA-Gd for necrotic tissue may be mediated through macrophages (Fig. 5). In this model, the polymeric contrast agents are captured by migrating and/or resident macrophages in the necrotic areas. Consisting with this hypothesis, recent studies using a monoclonal antibody that specifically recognizes PG-TXL showed that PG-TXL was taken up by macrophages in vitro through endocytosis (15), and that PG-TXL preferentially localized to perinecrotic areas in tumors in vivo (16). Alternatively, retention of PG-DTPA-Gd in necrotic areas may be due to physiochemical interaction or binding of polyanionic species with the tissue debris, which may be denatured proteins, nucleotides, calcium precipitates, or some combination of these species. This mechanism has been proposed to explain the accumulation of paramagnetic metalloporphyrins (17) and radiolabeled glucarate (18) in necrotic tissues.
Our data also suggest that for these models to work, it is necessary that the contrast agents are in polymeric form, which has prolonged blood half-life as compared to small molecular weight contrast agents, and thus may give sufficient time to interact with migrating or residing macrophages (14). The enhanced permeability and retention effect of macromolecules is also necessary for their transport from the vicinity of tumor blood vessels to the necrotic areas through a diffusion process if the interaction between PG-DTPA-Gd and tissue debris in the necrotic area is responsible for its affinity for necrotic tissue. Indeed, enhancement of the necrotic tissue of the tumors was observed only with polymeric contrast agents, not with low-molecular-weight contrast agents, including oligo(L-glutamic acid)-DTPA-Gd. Although low-molecular-weight contrast agents were able to cause a prompt enhancement of the tumor periphery, the enhancement was not sustained, because they were rapidly cleared from the blood circulation (Fig. 3). Affinity of PG-DTPA-Gd for necrotic tissue was not dependent on the stereoisomeric structure of the polymeric contrast agents (D-PG vs L-PG) or the biodegradability of the polymers, indicating that the affinity of PG-DTPA-Gd for necrosis is not mediated by a specific biological process, whether an enzymatic or a receptor-mediated transport mechanism. Direct extravasation of PG-DTPA-Gd in the necrotic zone through functional blood vessels is also unlikely since few residual blood vessels exist in necrotic areas (Fig. 4K).
Selective accumulation of L- and D-PG-DTPA-Gd in tumor necrosis can be used not only to map pre-existing necrosis but also to evaluate early treatment responses. By measuring changes in the tumor-to-muscle signal ratio or the percent tumor enhancement, the extent of therapy-induced necrosis can be quantified (Figs. 6 and 7). Since L- and D-PG-DTPA-Gd are also blood-pool imaging agents, dual-functional imaging with PG-DTPA-Gd may be possible after a single intravenous injection. Dynamic contrast-enhanced MRI could be performed immediately after contrast injection to determine functional parameters such as microvascular volume fraction, and this could be followed by a late-phase imaging session to measure the extent of tumor necrosis. Furthermore, dual-tracer DCE-MRI studies can be performed using PG-DTPA-Gd as an initial tracer to determine microvascular volume fraction (and saturate the signal from the blood) followed by DCE-MRI scanning with a second lower molecular weight agent to assess the endothelial transfer constant (Ktrans) and the extravascular, extracellular volume fraction (ve) are possible, as originally proposed by Weissleder et al. (19).
MRI with PG-Gd-DTPA may be incorporated into fairly routine clinical assessments of cancer patients. For example, baseline pre-therapy evaluations could be undertaken with standard MRI protocols using currently utilized low molecular weight DTPA-Gd, which would form the basis for morphologic evaluations of tumor size, for standard RECIST and/or WHO size criteria. We envision that PG-DTPA-Gd would be administered at the same MRI evaluation, and thereafter therapy commenced. A repeat MRI scan would then be undertaken within 7 days, with the aim of assessing therapy-induced necrosis. It is possible that this assessment will act as an early marker of therapeutic efficacy, but clearly this needs further preclinical and clinic evaluations. Currently, a follow-up imaging session is usually performed in 4-8 weeks (i.e, after 1-2 cycles of therapy) to assess changes in tumor size. In principle, the above protocol could be repeated at follow-up assessment, which would then enable simultaneous evaluation of changes in tumor size and the extent of necrosis.
The chemotherapeutic agent used in this study, PG-TXL (Xyotax®), is currently being studied in clinical trials (13, 20) (www.cticseattle.com). Preclinically, PG-TXL demonstrated potent radiosensitizing activity, with radiation enhancement factors reaching 4.0, as compared to 1.5-2.0 for paclitaxel (21-23). Since PG-TXL and PG-DTPA-Gd share the same PG polymeric backbone, we speculate that PG-TXL may be retained in solid tumors through the same mechanism by which PG-DTPA-Gd is retained. If this is the case, the superior radiosensitizing effect achieved with PG-TXL may be attributed to its accumulation and retention in the necrotic areas of the tumors, with subsequent sustained release of the active drug to the hypoxia areas in the vicinity of the necrotic zone.
In conclusion, we have found that PG-based paramagnetic DTPA-Gd conjugates selectively localized to necrotic tissue in solid tumors, and that this selective localization was mediated by macrophages. PG-DTPA-Gd may be used to assess chemotherapy induced necrosis. Further study is needed to evaluate the potential use of PG-DTPA-Gd in imaging radiation necrosis.
Acknowledgments
Supported in part by NIH grants R01 EB000174 (CL) and U54 CA90810 (EFJ) and by the John S. Dunn Foundation (CL). The Centralized Histopathology Laboratory and the Small Animals Imaging Facility are supported by Cancer Center Support Grant CA16672 awarded by the National Cancer Institute, Department of Health and Human Services. We thank Stephanie P. Deming for editorial assistance.
Footnotes
Publisher's Disclaimer: This is a PDF file of an unedited manuscript that has been accepted for publication. As a service to our customers we are providing this early version of the manuscript. The manuscript will undergo copyediting, typesetting, and review of the resulting proof before it is published in its final citable form. Please note that during the production process errors may be discovered which could affect the content, and all legal disclaimers that apply to the journal pertain.
References
- 1.Jeong YY, Mitchell DG, Hann HW, et al. Hepatocellular carcinoma after systemic chemotherapy: gadolinium-enhanced MR measurement of necrosis by volume histogram. J Comput Assist Tomogr. 2001;25:624–628. doi: 10.1097/00004728-200107000-00019. [DOI] [PubMed] [Google Scholar]
- 2.Picci P, Bohling T, Bacci G, et al. Chemotherapy-induced tumor necrosis as a prognostic factor in localized Ewing's sarcoma of the extremities. J Clin Oncol. 1997;15:1553–1559. doi: 10.1200/JCO.1997.15.4.1553. [DOI] [PubMed] [Google Scholar]
- 3.Lindner NJ, Scarborough MT, Spanier SS, et al. Local host response in osteosarcoma after chemotherapy referred to radiographs, CT, tumour necrosis and patient survival. Journal of Cancer Research and Clinical Oncology. 1998;124:575–580. doi: 10.1007/s004320050217. [DOI] [PMC free article] [PubMed] [Google Scholar]
- 4.White RR, Xie HB, Gottfried MR, et al. Significance of histological response to preoperative chemoradiotherapy for pancreatic cancer. Annals of Surgical Oncology. 2005;12:214–221. doi: 10.1245/ASO.2005.03.105. [DOI] [PubMed] [Google Scholar]
- 5.Soler C, Beauchesne P, Maatougui K, et al. Technetium-99m sestamibi brain single-photon emission tomography for detection of recurrent gliomas after radiation therapy. Eur J Nucl Med. 1998;25:1649–1657. doi: 10.1007/s002590050344. [DOI] [PubMed] [Google Scholar]
- 6.Asao C, Korogi Y, Kitajima M, et al. Diffusion-weighted imaging of radiation-induced brain injury for differentiation from tumor recurrence. AJNR Am J Neuroradiol. 2005;26:1455–1460. [PMC free article] [PubMed] [Google Scholar]
- 7.Dethy S, Goldman S, Blecic S, et al. Carbon-11-methionine and fluorine-18-FDG PET study in brain hematoma. J Nucl Med. 1994;35:1162–1166. [PubMed] [Google Scholar]
- 8.Iwai Y, Yamanaka K, Oda J, et al. Tracer accumulation in radiation necrosis of the brain after thallium-201 SPECT and [11C]methionine PET--case report. Neurol Med Chir (Tokyo) 2001;41:415–418. doi: 10.2176/nmc.41.415. [DOI] [PubMed] [Google Scholar]
- 9.Rock JP, Hearshen D, Scarpace L, et al. Correlations between magnetic resonance spectroscopy and image-guided histopathology, with special attention to radiation necrosis. Neurosurgery. 2002;51:912–919. doi: 10.1097/00006123-200210000-00010. discussion 919-920. [DOI] [PubMed] [Google Scholar]
- 10.Chenevert TL, Stegman LD, Taylor JMG, et al. Diffusion magnetic tesonance imaging: an early surrogate marker of therapeutic efficacy in brain tumors. J Natl Cancer Inst. 2000;92:2029–2036. doi: 10.1093/jnci/92.24.2029. [DOI] [PubMed] [Google Scholar]
- 11.Nelson SJ. Imaging of brain tumors after therapy. Neuroimaging Clin N Am. 1999;9:801–819. [PubMed] [Google Scholar]
- 12.Dzik-Jurasz A, Domenig C, George M, et al. Diffusion MRI for prediction of response of rectal cancer to chemoradiation. The Lancet. 2002;360:307–308. doi: 10.1016/S0140-6736(02)09520-X. [DOI] [PubMed] [Google Scholar]
- 13.Li C, Yu DF, Newman RA, et al. Complete regression of well-established tumors using a novel water-soluble poly(L-glutamic acid)-paclitaxel conjugate. Cancer Res. 1998;58:2404–2409. [PubMed] [Google Scholar]
- 14.Wen X, Jackson EF, Price RE, et al. Synthesis and characterization of poly(L-glutamic acid) gadolinium chelate: a new biodegradable MRI contrast agent. Bioconjug Chem. 2004;15:1408–1415. doi: 10.1021/bc049910m. [DOI] [PubMed] [Google Scholar]
- 15.Chipman S, Rosler R, Bonham L, et al. Energy dependent uptake of paclitaxel poliglumex by human NSCLC tumor and murine macrophase-like cell lines. 18th EORTC-NCI-AACR Symposium on Molecular Targets and Cancer Therapeutics; Prague, Czech Republic. November 7-10; 2006. Abstract #643. [Google Scholar]
- 16.Fornasier M, Bergottini R, Radaelli E, et al. Paclitaxel poliglumex cellular uptake by normal tissues and human tumor xenograft: an IHC study in nude mice. 18th EORTC-NCI-AACR Symposium on Molecular Targets and Cancer Therapeutics; Prague, Czech Republic. November 7-10; 2006. Abstract #637. [Google Scholar]
- 17.Ni Y, Petre C, Miao Y, et al. Magnetic resonance imaging-histomorphologic correlation studies on paramagnetic metalloporphyrins in rat models of necrosis. Invest Radiol. 1997;32:770–779. doi: 10.1097/00004424-199712000-00008. [DOI] [PubMed] [Google Scholar]
- 18.Khaw BA, Nakazawa A, O'Donnell SM, et al. Avidity of technetium 99m glucarate for the necrotic myocardium: in vivo and in vitro assessment. J Nucl Cardiol. 1997;4:283–290. doi: 10.1016/s1071-3581(97)90105-7. [DOI] [PubMed] [Google Scholar]
- 19.Weissleder R, Cheng HC, Marecos E, et al. Non-invasive in vivo mapping of tumour vascular and interstitial volume fractions. Eur J Cancer. 1998;34:1448–1454. doi: 10.1016/s0959-8049(98)00195-6. [DOI] [PubMed] [Google Scholar]
- 20.Li C. Poly(L-glutamic acid)--anticancer drug conjugates. Adv Drug Deliv Rev. 2002;54:695–713. doi: 10.1016/s0169-409x(02)00045-5. [DOI] [PubMed] [Google Scholar]
- 21.Li C, Ke S, Wu QP, et al. Tumor irradiation enhances the tumor-specific distribution of poly(L-glutamic acid)-conjugated paclitaxel and its antitumor efficacy. Clin Cancer Res. 2000;6:2829–2834. [PubMed] [Google Scholar]
- 22.Milas L, Mason KA, Hunter N, et al. Poly(L-glutamic acid)-paclitaxel conjugate is a potent enhancer of tumor radiocurability. Int J Radiat Oncol Biol Phys. 2003;55:707–712. doi: 10.1016/s0360-3016(02)04153-6. [DOI] [PubMed] [Google Scholar]
- 23.Ke S, Milas L, Charnsangavej C, et al. Potentiation of radioresponse by polymer-drug conjugates. J Control Release. 2001;74:237–242. doi: 10.1016/s0168-3659(01)00322-4. [DOI] [PubMed] [Google Scholar]
- 24.Unger EC, Shen D, Wu G, et al. Gadolinium-containing copolymeric chelates-a new potential MR contrast agent. Magma. 1999;8:154–162. doi: 10.1007/BF02594593. [DOI] [PubMed] [Google Scholar]