Abstract
Phosphorylation of light-activated rhodopsin by the retina-specific enzyme, rhodopsin kinase (RK), is the primary event in the initiation of desensitization in the visual system. RK binds to the cytoplasmic face of rhodopsin, and the binding results in activation of the enzyme which then phosphorylates rhodopsin at several serine and threonine residues near the carboxyl terminus. To map the RK binding sites, we prepared two sets of rhodopsin mutants in the cytoplasmic CD and EF loops. In the first set, peptide sequences in both loops were either deleted or replaced by indifferent sequences. In the second set of mutants, the charged amino acids (E134, R135, R147, E239, K245, E247, K248, and E249) were replaced by neutral amino acids in groups of 1–3 per mutant. The deletion and replacement mutants in the CD loop showed essentially no phosphorylation, and they appeared to be defective in binding of RK. Of the mutants in the EF loop, that with a deletion of 13 amino acids, was also defective in binding to RK while the second mutant containing a replacement sequence bound RK but showed a reduction of about 70% in Vmax for phosphorylation. The mutants containing charged to neutral amino acid replacements in the CD and EF loops were all phosphorylated but to different levels. The charge reversal mutant E134R/R135E showed a 50% reduction in Vmax relative to wild-type rhodopsin. Replacements of charged residues in the EF loop decreased the Km by 5-fold for E239Q and E247Q/K248L/E239Q. In summary, both the CD and EF cytoplasmic loops are intimately involved in binding and interaction of RK with light-activated rhodopsin.
Keywords: rhodopsin phosphorylation, phototransduction, desensitization, site-directed mutagenesis, G protein-coupled receptors
Light activation of rhodopsin initiates two biochemical cascades, one leading to visual sensitization and the other to desensitization. The primary event in the first cascade is the binding of transducin to light-activated rhodopsin (metarhodopsin II; Meta II), and that in the second is the binding of rhodopsin kinase (RK) to the same photointermediate resulting in its phosphorylation (2–4). While the structural requirements for interaction between Meta II and transducin have been investigated extensively, the study of RK–rhodopsin interaction has begun only recently. Akhtar and coworkers (5) dissected the action of RK into two distinct steps. The first involved binding to Meta II, which resulted in activation of the enzyme. Catalysis of phosphorylation then followed as a second step. Palczweski et al. (6) compared the activation of RK by a number of rhodopsin derivatives and concluded that the cytoplasmic EF loop was involved in binding to RK. More recently, Weiss and coworkers (7) studied the effects of certain amino acid replacements in cytoplasmic loops AB, CD, and EF and suggested the involvement of all the three loops in phosphorylation by RK.
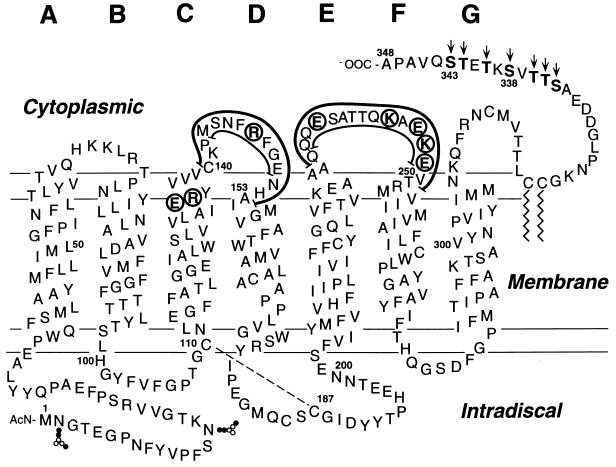
We now report on further characterization of the requirements for the binding of RK to Meta II and catalysis of the phosphorylation reaction. Two sets of mutants in the cytoplasmic loops CD and EF (Fig. 1) (8) have been studied. In one set, peptide sequences in both loops are either deleted or replaced by indifferent peptide sequences. In the second set, the charged amino acids (E134, R135, R147, E239, K245, E247, K248, and E249) are replaced by neutral amino acids in groups of 1–3 per mutant (Fig. 1, Table 1). Studies of the mutants as substrates for phosphorylation by RK in a homogeneous dodecylmaltoside (DM)-solubilized system show that both the CD and EF loops are intimately involved in the binding and interaction of RK with light-activated rhodopsin. A brief report of a part of these results has been made previously (9).
Figure 1.
A secondary structure model of rhodopsin showing the sites of single amino acid replacements (circles), deletions (thin lines), and replacements (thick lines) of peptide sequences in cytoplasmic loops CD and EF. Also shown are the potential sites in the C-terminal tail for phosphorylation by RK (arrows). The total mutations in the cytoplasmic loops that were studied are also shown in Table 1.
Table 1.
Deletions (Δ), replacement (R) of sequences, and single amino acid substitutions in cytoplasmic loops of rhodopsin
| Loop | Mutant | Deletion or replacement | Mutant | Amino acid replacement(s) |
|---|---|---|---|---|
| CD | CD-Δ | M143–E150 | CD-1 | E134A/R135A |
| CD-R | C140–H152 | CD-2 | E134R/R135E | |
| by GTEGPNFYVPFTS | CD-3 | R147Q | ||
| EF | EF-Δ | Q237–E249 | EF-1 | E239Q |
| EF-R | A235–V250 | EF-2 | K245L/K248L | |
| by TSLHGYSVTGPTGSNL | EF-3 | E247Q/K248L/E249Q |
MATERIALS AND METHODS
Materials.
DM was from Anatrace (Maumee, OH). 11-cis-Retinal was a gift from R. Crouch (Medical University of South Carolina and National Eye Institute, National Institutes of Health). Cyanogen bromide-activated Sepharose 4B was from Sigma. The enhanced chemiluminescence detection system and horseradish peroxidase-conjugated goat anti-mouse IgG were from Amersham. Anti-rhodopsin mAb, rho-1D4 (10), was purified from a myeloma cell line provided by R. S. Molday (University of British Columbia). It was coupled to cyanogen bromide-activated Sepharose 4B as described (11). Frozen bovine retinae were from J. A. Lawson (Lincoln, NE), and rod outer segments (ROS) were prepared by the method of Papermaster (12). The nitrocellulose membranes were obtained from Schleicher & Schuell, and the PNGase F was from New England Biolabs. Endoproteinase Asp-N was obtained from Boehringer Mannheim, concanavalin A-Sepharose was from Pharmacia Biotech, and [γ-32P]ATP (6000 Ci/mmol; 1 Ci = 37 GBq) was from DuPont/NEN.
Rhodopsin Mutants.
The mutant opsin genes corresponding to the mutant proteins in Table 1 are all among those previously described by Franke et al. (8). For convenience, the numbering of the mutants has been changed from that in the original paper (8) as in Table 1. All the mutant genes were expressed in COS-1 cells and purified by absorption on anti-rhodopsin 1D4-Sepharose as described (11, 13). In addition, the deletion and sequence replacement mutants in Table 1 were prepared by expression in stable mammalian cell lines (14).
UV/Vis Spectroscopy.
UV/Vis spectra were measured in a Perkin–Elmer λ7 spectrophotometer. For bleaching, the samples were illuminated for 30 sec with light at λ > 495 nm and the spectra recorded immediately.
Purification of RK.
RK was purified and assayed by the method of Palczewski (15), except that frozen retinae were used and DM (0.05%) was included as the detergent in the heparin-Sepharose purification step. Fractions containing the kinase activity were pooled, concentrated, diluted with an equal volume of 10 mM bis-tris-propane (BTP) buffer (pH 7.5) containing 40% adonitol and stored frozen at −70°C. The enzyme was stable for several months under these conditions.
Deglycosylation of Rhodopsin Mutants.
For SDS/PAGE assays in which rhodopsin mutants prepared from mammalian cell lines were used, the oligosaccharide chains were removed so as to obtain sharp bands on gels. The mutants (1 μg) were incubated with 50 units of PNGase F for 3 h at 37°C in 50 mM sodium phosphate buffer (pH 7.5) containing 1% SDS and 1% Nonidet P-40 detergent.
Assays for Phosphorylation of Rhodopsin and Mutants. Reaction conditions.
The reaction mixtures contained 100 mM [γ-32P]ATP (2000–3000 cpm/pmol), 2 mM MgCl2 in 20 mM BTP (pH 7.5) buffer, and 0.02% DM. The total volumes were 25 μl per reaction whereas in time course experiments, each time point contained 25 μl. Concentrations of RK used varied from 4 to 620 ng per reaction mixture. Thus, for initial rate determination, RK was present at 60 ng concentration; for determination of maximum phosphate incorporation, the concentration was 620 ng; and for Km determination, the concentration was 4 ng RK/20 μl reaction mixtures with different concentrations of rhodopsin or mutants (see also legends to figures).
In inhibition experiments, rhodopsin was used as the substrate at 0.1 μM concentration, but inhibition by mutants was tested at varying concentrations. Rhodopsin truncated at the C terminus (Rho-CT) served as a positive control. For testing inhibition by the mutant rhodopsins the C-terminal tails were not removed. This was because (i) the phosphorylation of the mutants is very low and (ii) the proteins expressed in stable mammalian cell lines (14) run as a smear on the gel and can be readily resolved from the native rhodopsin band.
Assays for incorporation of [32P]phosphate.
(i) Using nitrocellulose membranes. Aliquots of 25 μl, for maximum incorporation experiments, or 40 μl, for initial rate experiments, were diluted with an equal volume of 100 mM ATP to stop the reaction. The samples were applied to nitrocellulose membranes presoaked in 1 M KH2PO4 containing 20 mM ATP. The membranes were washed five times with 50 ml of 1 M KH2PO4, and radioactivity was measured by Cerenkov counting. Control reactions, using only ATP, ATP and RK, or ATP and Rho, in all cases gave no more than 10% of the signal.
(ii) Using SDS/PAGE. The reactions were terminated by the addition of 4× SDS gel loading buffer (0.25 mM Tris·HCl, pH 6.8/2% SDS/2% 2-mercaptoethanol/10% glycerol/0.002% bromophenol blue) and loaded directly onto 12% polyacrylamide/SDS gels with 5% stackers. The radioactivity in bands was counted using a Molecular Dynamics PhosphorImager.
Preparation of Rho-CT.
Palczewski et al. (6) have described the use of endoproteinase Asp-N for the cleavage of rhodopsin between Gly-329 and Asp-330. The truncated rhodopsin thus obtained is now designated Rho-CT. ROS were suspended in 300 μl 10 mM Tris·HCl (pH 7.5) to a final concentration of 3.5 mg/ml. To this 2 μg of endoproteinase Asp-N was added and the sample was incubated at room temperature for 18 h in the dark. EDTA (2 μl of 0.5 M) and 4 μl of 0.1 M DTT were then added and the membranes pelleted. The membranes were then dispersed in 50 mM Tris·HCl (pH 8.0) containing 5 M urea and 5 mM EDTA. The membranes were pelleted again and washed four times with 20 mM BTP (pH 7.5). Rho-CT in the membranes was solubilized in 1% DM in Tris-buffered saline (TBS; pH 7.0). Nontruncated rhodopsin was removed by absorption on 1D4-Sepharose, and Rho-CT in the supernatant was purified by using concanavalin A-Sepharose (16).
Decay Rates for Meta II Intermediates from the Rhodopsin Mutants.
These were determined by the fluorescence increase assay (17) using 0.02% DM for solubilization.
Other Methods.
SDS/PAGE was run by the method of Laemmli (18). Protein was determined according to Bradford (19).
RESULTS
Preparation and Characterization of the Rhodopsin Mutants.
Construction of the mutant opsin genes, their expression in COS-1 cells, and purification of the proteins have all been described (8). UV/Vis absorption spectra of the mutants all showed A280/A500 nm ratios between 1.6 and 1.8. The rates of Meta II decay following illumination are now reported in Table 2. These were all determined by the fluorescence assay (17) in 0.02% DM, the concentration of the detergent used in all the experiments now reported. It is noted that the times shown in Table 2 are shorter (about 70–80%) than those observed in 0.1% DM, in which the previous determinations were done (1, 17).
Table 2.
Meta II decay rates of mutant rhodopsins at 0.02% DM
| Mutant | t½, min | Mutant | t½ min |
|---|---|---|---|
| WT | 11.0 | CD-1 | 9.9 |
| EF-R | 9.0 | CD-2 | 9.7 |
| EF-Δ | 11.5 | CD-3 | 10.3 |
| CD-R | 12.6 | EF-1 | 9.0 |
| CD-Δ | 15.7 | EF-2 | 11.9 |
| EF-3 | 11.6 |
Phosphorylation of Rhodopsin by RK in DM-Solubilized System.
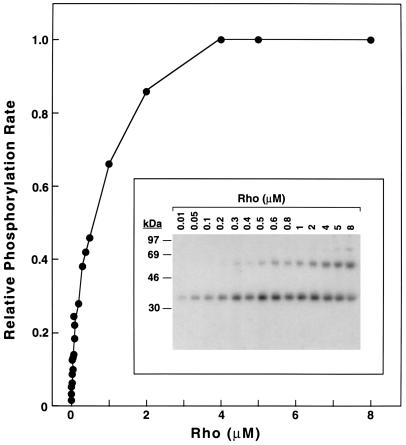
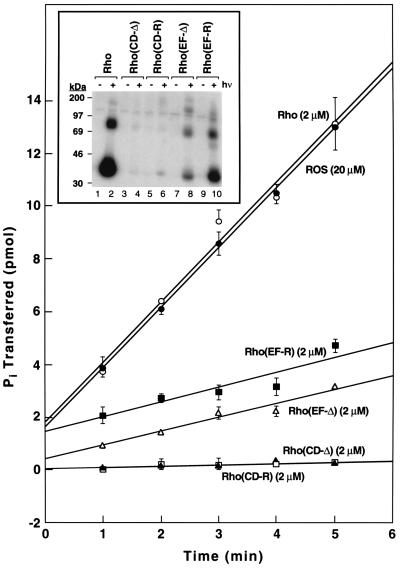
To compare phosphorylations of wild-type (WT) rhodopsin and the mutants, a solubilized system using purified components was desired. Because DM has proved to be satisfactory in previous studies of rhodopsin, the present experiments have been carried out in homogeneous reaction mixtures containing this detergent. The rate of phosphorylation was studied first as a function of rhodopsin concentration (Fig. 2), and the reaction was followed by the SDS/PAGE assay (Fig. 2 Inset). The band with mobility about 40 kDa corresponds to phosphorylated rhodopsin while the slower band (about 65 kDa) corresponds to rhodopsin dimer (positive immunoblot). Analysis of the data using an Eadie–Hofstee plot (20, 21) indicated a Km of 0.45 ± 0.04 μM, which is about 10-fold less than that reported (4 μM) for rhodopsin phosphorylation in ROS membranes (6). Next, the initial rates of phosphorylation for rhodopsin were determined both in ROS membranes and solubilized rhodopsin. ROS membranes were used at 20 μM concentration while the solubilized rhodopsin was used at 2 and 4 μM. As seen in Fig. 3, the phosphorylation rates were the same in both the membrane and solubilized systems. Thus, while the Vmax is the same in both the heterogeneous and homogeneous reactions, the Km is much lower in the detergent-solubilized system.
Figure 2.
Rate of phosphorylation of rhodopsin solubilized in DM by RK as a function of rhodopsin concentration. The incorporation of phosphate from [γ-32P]ATP was measured by SDS/PAGE (Inset) followed by autoradiography and quantitation by phosphoimaging as described. [γ-32P]ATP, which was used in excess, migrates off the gel on electrophoresis. The amount of RK used was 4 ng per assay as described.
Figure 3.
Comparative rates of phosphorylation of rhodopsin mutants by RK. In the control experiments, rhodopsin concentration was 2 μM while ROS membranes were used at 20 μM rhodopsin concentration. The incorporation of phosphate from [γ-32P]ATP was measured by nitrocellulose filter binding and quantitated by Cerenkov counting. The assays measured initial rates of phosphorylation. All assays (Materials and Methods) used 61 ng RK of standard specific activity. (Inset) Analysis by gel electrophoresis of phosphorylation of rhodopsin mutants at 10 μM substrate concentration except for WT rhodopsin, which was at 2 μM concentration. Shown are phosphorylation reactions of WT rhodopsin, CD-Δ, CD-R, EF-Δ, and EF-R in the dark and after illumination. Each assay used 61 ng of RK of standard specific activity. To facilitate separation by SDS/PAGE the proteins were treated with PNGase F for deglycosylation before loading onto the gel (Materials and Methods). The incorporation of phosphate from [γ-32P]ATP was measured by phosphoimaging.
Phosphorylation of Rhodopsin Mutants Containing Deletions and Peptide Sequence Replacements in the Cytoplasmic Loops.
Phosphorylation of the four mutants, CD-Δ, CD-R, EF-Δ, and EF-R (Table 1), was studied using 2 μM concentration of each mutant. Under the conditions used no more than 10% of the substrate was consumed, and therefore the reactions proceed at maximal rates. The results in Fig. 3 show that in the mutants CD-Δ and CD-R phosphorylation was essentially nondetectable, whereas in the mutants EF-Δ and EF-R phosphorylation proceeded at reduced rates, about 20% relative to rhodopsin.
Phosphorylation of each of the above four mutants was next studied at the high concentration of 10 μM, relative to a WT rhodopsin concentration of 2 μM (Fig. 3 Inset). The SDS/PAGE assay was used because this is particularly suited for detection of phosphorylation at low levels. The relatively large amounts of mutants required for this experiment were prepared by the stable mammalian cell line expression system; because these mutants smear on gels (14), they were deglycosylated enzymatically before gel electrophoresis to obtain sharp bands. Analysis of radioactivity by phosphoimaging showed that even at the high substrate concentrations, phosphorylation of the mutants CD-Δ and CD-R was hardly detectable. Phosphorylation of the mutant EF-Δ was 10–20% of rhodopsin phosphorylation whereas that of the mutant EF-R was more significant (about 30% of rhodopsin).
Do the Rhodopsin Deletion and Sequence Replacement Mutants Bind to RK in a Light-Dependent Manner?
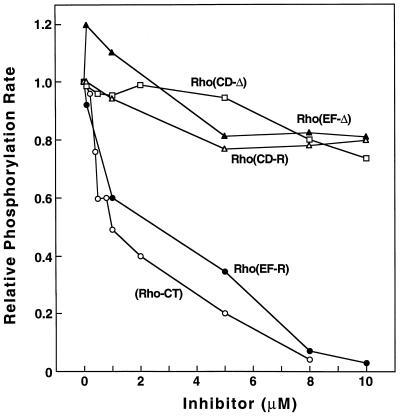
Phosphorylation of light-activated rhodopsin by RK is assumed to occur in two steps. First, RK binds to light-activated rhodopsin and is activated. Phosphorylation then occurs in a distinct second step. The possibility that in the above mutants, binding of RK is affected was studied by looking for competitive inhibition. If the above mutants, which do not undergo phosphorylation, bind to RK, they should inhibit the phosphorylation of WT rhodopsin. The truncated rhodopsin, Rho-CT, which activates RK (6) but is not itself phosphorylated, was used as a positive control for inhibition of WT rhodopsin. The inhibition experiments were carried out under initial rate conditions using saturating concentrations of the substrates. Under these conditions, the amount of free enzyme should determine the rate of reaction. Fig. 4 shows the results of experiments in which relative phosphorylation rates of WT rhodopsin at 0.1 μM concentration was studied in the presence of increasing concentrations, up to 10 μM, of the mutants. Rho-CT indeed inhibited the phosphorylation of rhodopsin, causing 50% inhibition at 1 μM concentration. The mutant EF-R also caused inhibition similar to Rho-CT, indicating that this mutant binds to RK. A rough approximation of the Km for EF-R showed it to be similar to that of WT rhodopsin (data not shown). None of the other three mutants showed any significant inhibition at concentrations up to 10 μM (Fig. 4). The results support the conclusion that these mutants are defective in binding to RK.
Figure 4.
Inhibition of rhodopsin phosphorylation by rhodopsin mutants. Rhodopsin was present at 0.1 μM concentration while the mutants were added at increasing concentrations up to 10 μM. Truncated rhodopsin (Rho-CT) was used as the control for inhibition of WT rhodopsin phosphorylation. The [32P]phosphate incorporation was measured by SDS/PAGE. Each assay (Materials and Methods) used 4 ng RK of standard specific activity.
Phosphorylation Characteristics of Rhodopsin Mutants Containing Amino Acid Replacements in the Cytoplasmic Loops. Maximal phosphorylation of the mutants using high levels of RK.
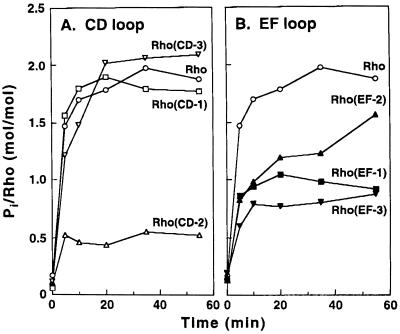
Phosphorylation of the six mutants (Table 1) was compared, alongside WT rhodopsin, at limiting (0.1 μM) concentrations of the mutants using excess (620 ng) of RK. Under these conditions, 2 mol of phosphate were incorporated per mole of WT rhodopsin. The mutants CD-1 and CD-3 showed phosphorylation at levels similar to that of WT rhodopsin (Fig. 5A), whereas phosphorylation of the mutant CD-2 plateaued at the much lower level (0.5 mol phosphate/mol protein) of incorporation (Fig. 5A). The mutants in the EF loop (Fig. 5B) all showed reduced phosphorylation at plateau levels (0.7–1.3 mol/mol) relative to WT rhodopsin. The reduced levels cannot be due to higher instability of the Meta II intermediates in these mutants because, as described above, they showed decay rates not very different from that of WT Meta II (Table 2).
Figure 5.
Comparison of the levels of phosphorylation of WT rhodopsin and of rhodopsin mutants. Analysis was by filter binding assay using [γ-32P]ATP. Reactions were carried out using 620 ng RK of standard specific activity and 0.1 μM rhodopsin or the mutants.
Km values for phosphorylation of the mutants.
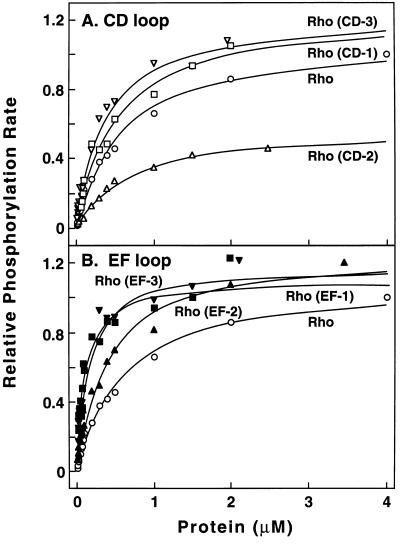
These values were determined under initial rate conditions. Dependence of the initial rates of phosphorylation on concentration is shown in Fig. 6. The data were plotted according to the Eadie–Hofstee equation to determine Km values, assuming that Michaelis–Menten mechanism applied. A theoretical Michaelis–Menten plot calculated from the Km values was plotted alongside the experimental data (Fig. 6). In general, the fit was good. Thus, it seems reasonable to use the Michaelis–Menten equation for internal comparisons of the mutants with WT rhodopsin. The Km values derived from the data and the calculated kcat/Km values are summarized in Table 3. Thus, two mutants in the EF loop (EF-1 and EF-3) and one mutant in the CD loop (CD-2) showed a significant change in the kcat/Km with 3- to 5-fold increase and 2.5-fold decrease, respectively.
Figure 6.
Phosphorylation of WT rhodopsin and of rhodopsin mutants by RK as a function of concentration. Incorporation of [32P]phosphate was measured by SDS/PAGE. The protein concentrations ranged from 0.01 to 4 μM. Each assay (Materials and Methods) used 13 ng RK of standard specific activity.
Table 3.
Reaction characteristics for the phosphorylation of rhodopsin mutants
| Mutant | Amino acid replacements by RK
|
||
|---|---|---|---|
| Vmax, pmol/min/μg RK | Km, μM | kcat/Km (s−1·M−1) | |
| WT | 39 ± 2 | 0.45 ± 0.04 | 9.2 × 10⁴ (1.0) |
| CD-1 | 40 ± 1 | 0.34 ± 0.05 | 1.2 × 10⁵ (1.3) |
| CD-2 | 19 ± 1 | 0.56 ± 0.09 | 3.6 × 10⁴ (0.4) |
| CD-3 | 33 ± 2 | 0.40 ± 0.04 | 8.5 × 10⁴ (0.9) |
| EF-1 | 35 ± 6 | 0.07 ± 0.01 | 5.1 × 10⁵ (5.5) |
| EF-2 | 52 ± 3 | 0.32 ± 0.02 | 1.6 × 10⁵ (1.7) |
| EF-3 | 24 ± 3 | 0.09 ± 0.01 | 2.8 × 10⁵ (3.0) |
The Km values were calculated from Eadie–Hofstee plots derived from the data of Fig. 6. The Vmax values are from the rates of phosphorylation (data not shown). For the values of kcat/Km, kcat values are obtained from Vmax = kcat [E]0, where [E]0 is the amount of enzyme present in each time point aliquot.
Vmax values for phosphorylation of the cytoplasmic loop mutants.
Initial rates of phosphorylation were studied using rhodopsin concentrations of 2 μM under conditions where no more than 10% of the substrate was consumed. The mutants CD-2 and EF-3 showed significantly lower Vmax values than WT rhodopsin whereas the other mutants had Vmax like WT rhodopsin (Table 3).
DISCUSSION
Transducin and RK both bind to the cytoplasmic face of light-activated rhodopsin and initiate, respectively, the sensitization and desensitization cascades. Understanding the visual response, which involves a precisely regulated balance between the two cascades under a given illumination, will require at the outset mapping of the binding sites of the above two proteins to light-activated rhodopsin. At present, this information is essentially nonexistent, especially for the interaction between RK and light-activated rhodopsin.
In this report, we have used a solubilized system for phosphorylation of rhodopsin by RK and have studied a variety of mutants in the cytoplasmic loops CD and EF of rhodopsin. Mutations with extensive modifications of the loops showed drastic effects on phosphorylation. Two possibilities for the results were considered: (i) the mutants are defective in the binding of RK to light-activated rhodopsin, or (ii) RK can bind but its activation and/or the catalysis of phosphorylation is affected. Results of the inhibition study have provided suggestive evidence regarding the requirements for the binding process. It seems clear that both the loops studied are involved in the binding of RK to rhodopsin. The deletion in the CD loop abolished the binding and replacement of the deleted sequence by an unrelated sequence did not restore the binding capacity. The deletion in the EF loop also abolished the binding but the replacement sequence in this loop allowed binding as shown by inhibition (Fig. 4) of WT rhodopsin phosphorylation. However, the replacement sequence allowed phosphorylation only partially (30%).
All the rhodopsin mutants containing replacements of charged amino acids were phosphorylated by RK although variations in the extents of phosphorylation were observed (Fig. 5). The kinetic data on the mutants are summarized in Table 3. The data on both Km and Vmax can be used to determine the ratio kcat/Km, which is an indication of the arrival and binding of the substrate to its site. In the EF loop, the mutant EF-1 and EF-3 showed a significantly higher kcat/Km ratio, suggesting that the mutations improved the binding of RK to rhodopsin. On the other hand, the mutations in EF-2 did not affect the kcat/Km ratio. Therefore, it appears that among the charged residues, only acidic ones are involved in the binding of RK in the EF loop. In the CD loop, the charge residues do not seem to play any significant role in the binding of RK to rhodopsin since the kcat/Km ratio is not affected by the CD-1 and CD-3 mutations. The charge reversal in the CD-2 mutant, however, leads to a reduction in the binding of RK to rhodopsin (lower kcat/Km ratio) and a significant decrease in Vmax. Therefore, the presence of a positive charge at position 134 and/or a negative charge at position 135 are deleterious to the interaction of RK with rhodopsin.
Because the results reported above on both groups of mutations suggest an important role for the CD loop in RK binding and of the EF loop, both in binding and catalysis, it is very likely that other amino acids in these loops are also involved in RK/rhodopsin interactions. This conclusion is consistent with the results of Shi et al. (7) that suggested the involvement of residues 147–149 of the CD loop and residues 234–235 of EF loop in the RK-rhodopsin interaction.
Acknowledgments
We have benefited greatly from discussions with Prof. U. L. RajBhandary (Massachusetts Institute of Technology Biology Department), Dr. Kiweon Cha, and Dr. Christophe Bruel of this laboratory. Ms. Judy Carlin’s assistance during the manuscript preparation is gratefully acknowledged. This work was supported by Grant GM 28289 from the National Institutes of Health. R.L.T. was the recipient of National Institutes of Health Research Service Award 1-F32-EY06466.
ABBREVIATIONS
- RK
rhodopsin kinase
- Meta II
metarhodopsin II
- DM
dodecylmaltoside
- ROS
rod outer segments
- Rho-CT
rhodopsin truncated at C terminus
- WT
wild type
Footnotes
This is paper 23 in the series “Structure and Function in Rhodopsin.” Paper 22 is ref. 1.
References
- 1.Yang K, Farrens D L, Altenbach C, Hubbell W L, Khorana H G. Biochemistry. 1996;35:12464–12469. doi: 10.1021/bi960848t. [DOI] [PubMed] [Google Scholar]
- 2.Kuhn H, Dreyer W J. FEBS Lett. 1972;20:1–6. doi: 10.1016/0014-5793(72)80002-4. [DOI] [PubMed] [Google Scholar]
- 3.Palczewski K, Benovic J L. Trends Biochem Sci. 1991;16:387–391. doi: 10.1016/0968-0004(91)90157-q. [DOI] [PubMed] [Google Scholar]
- 4.Inglese J, Freedman N J, Koch W J, Lefkowitz R J. J Biol Chem. 1993;268:23735–23738. [PubMed] [Google Scholar]
- 5.Brown N G, Fowles C, Sharma R, Akhtar M. Eur J Biochem. 1992;208:659–667. doi: 10.1111/j.1432-1033.1992.tb17232.x. [DOI] [PubMed] [Google Scholar]
- 6.Palczewski K, Buczylko J, Kaplan M W, Polans A S, Crabb J W. J Biol Chem. 1991;266:12949–12955. [PubMed] [Google Scholar]
- 7.Shi W, Osawa S, Dickerson C D, Weiss E R. J Biol Chem. 1995;270:2112–2119. doi: 10.1074/jbc.270.5.2112. [DOI] [PubMed] [Google Scholar]
- 8.Franke R R, Sakmar T P, Graham R, Khorana H G. J Biol Chem. 1992;267:14767–14774. [PubMed] [Google Scholar]
- 9.Thurmond R L, Khorana H G. Biophys J. 1995;68:A385. (abstr.). [Google Scholar]
- 10.Molday R S, MacKenzie D. Biochemistry. 1983;22:653–660. doi: 10.1021/bi00272a020. [DOI] [PubMed] [Google Scholar]
- 11.Oprian D D, Molday R S, Kaufman R J, Khorana H G. Proc Natl Acad Sci USA. 1987;84:8874–8878. doi: 10.1073/pnas.84.24.8874. [DOI] [PMC free article] [PubMed] [Google Scholar]
- 12.Papermaster D S. Methods Enzymol. 1982;81:240–246. doi: 10.1016/s0076-6879(82)81037-9. [DOI] [PubMed] [Google Scholar]
- 13.Ridge K D, Lu Z, Liu X, Khorana H G. Biochemistry. 1995;34:3261–3267. doi: 10.1021/bi00010a016. [DOI] [PubMed] [Google Scholar]
- 14.Reeves P J, Thurmond R L, Khorana H G. Proc Natl Acad Sci USA. 1996;93:11487–11492. doi: 10.1073/pnas.93.21.11487. [DOI] [PMC free article] [PubMed] [Google Scholar]
- 15.Palczewski K. In: Photoreceptor Cells. Hargrave P A, editor. New York: Academic; 1993. pp. 217–225. [Google Scholar]
- 16.Litman B J. Methods Enzymol. 1982;81:150–153. doi: 10.1016/s0076-6879(82)81025-2. [DOI] [PubMed] [Google Scholar]
- 17.Farrens D L, Khorana H G. J Biol Chem. 1995;270:5073–5076. doi: 10.1074/jbc.270.10.5073. [DOI] [PubMed] [Google Scholar]
- 18.Laemmli U K. Nature (London) 1970;227:680–685. doi: 10.1038/227680a0. [DOI] [PubMed] [Google Scholar]
- 19.Bradford M M. Anal Biochem. 1976;72:248–254. doi: 10.1016/0003-2697(76)90527-3. [DOI] [PubMed] [Google Scholar]
- 20.Eadie G S. J Biol Chem. 1942;146:85–93. [Google Scholar]
- 21.Hofstee B H J. Nature (London) 1959;184:1296–1298. doi: 10.1038/1841296b0. [DOI] [PubMed] [Google Scholar]


