

Abstract
This study was performed in transgenic mice to test the hypothesis that the selective intrarenal overproduction of ANG II increases intrarenal mouse (m) angiotensinogen (AGT) expression. We used the following three groups: 1) single transgenic mice (group A, n = 14) expressing human (h) AGT only in the kidney, 2) double-transgenic mice (group D, n = 13) expressing human renin systemically in addition to hAGT only in the kidney, and 3) wild-type (group W, n = 12) mice. Exogenous hAGT protein is inactive in group A because endogenous mouse renin cannot cleave hAGT to ANG I because of a high species specificity. All mice were monitored from 12 to 18 wk of age. Systolic blood pressure progressively increased from 116 ± 5 mmHg (12 wk) to 140 ± 7 (18 wk) in group D. This increase was not observed in groups A or W. Intrarenal hAGT levels were similar in groups A and D; however, hAGT was not detectable in kidneys of group W. Kidney ANG II levels were increased in group D (216 ± 43 fmol/g) compared with groups A (117 ± 16) and W (118 ± 17). However, plasma ANG II concentrations were similar among the three groups. Endogenous renal mAGT mRNA was increased significantly in group D (1.46 ± 0.19, ratio) compared with groups A (0.97 ± 0.12) and W (1.00 ± 0.08). Endogenous renal mAGT protein was also significantly increased in group D compared with groups A and W. Interstitial collagen-positive area, interstitial macrophage/monocyte infiltration, and afferent arteriolar wall thickness were increased significantly in group D compared with groups A and W. These data indicate for the first time that the selective stimulation of intrarenal production of ANG II from hAGT augments endogenous intrarenal mAGT mRNA and protein expression.
Keywords: hypertension, transgenic mouse, angiotensin II, renal injury
Recent attention has been focused on the existence of unique renin-angiotensin systems (RAS) in various tissues (10). Emerging evidence has demonstrated the importance of the tissue RAS in the brain (1), heart (7), adrenal glands (34), vasculature (5, 13, 15, 36), and kidneys (37). The RAS has been acknowledged as an endocrine, paracrine, autocrine, and intracrine system and thus it has been difficult to delineate the quantitative contributions of systemically delivered vs. locally formed ANG peptides to the levels existing in any given tissue (37). In this regard, the kidneys are unique in terms of the tissue concentrations of ANG II, which are much greater than can be explained by the concentrations delivered by the arterial blood flow (19). There is substantial evidence that the major fraction of ANG II present in renal tissues is generated locally from angiotensinogen (AGT) delivered to the kidney as well as from AGT locally produced by proximal tubule cells (18). Renin secreted by the juxtaglomerular apparatus cells in the renal interstitium and vascular compartment also provides a pathway for the local generation of ANG I (35). ANG-converting enzyme is abundant in the rat kidney and is present in proximal and distal tubules, the collecting ducts, and renal endothelial cells (3). ANG I delivered to the kidney can also be converted to ANG II (31). Therefore, all of the components necessary to generate intrarenal ANG II are present along the nephron (29).
Previous studies performed primarily in rats have shown that systemic ANG II infusions increase intrarenal ANG II levels, partially because of concomitant increases in proximal tubular AGT mRNA and protein further augmenting intrarenal ANG II levels, leading to progressive development of hypertension and renal injury in ANG II-infused rats (23–25, 27, 30). However, it has not been established if selective increases in intrarenal ANG II can be responsible for the stimulation of intrarenal AGT along with the development of progressive hypertension and/or renal injury. With the use of a transgenic mouse model in which human (h) AGT is expressed only in the kidney (6, 8, 9), experiments were performed to determine if selective renal overproduction of ANG II elicited by stimulating hAGT present only in the kidney in the presence of human renin (hR) will cause increases in endogenous mouse (m) AGT mRNA and protein expression in kidneys. The primary objective of this study was to determine if intrarenally produced ANG II elicited by activating the transgenes would stimulate endogenous mAGT. Because the hAGT is localized only in the kidney, the double-transgenic mice also harboring the hR gene will have an increased intrarenal ANG II generated from hAGT. Thus, by using this model, it was possible to determine if such localized increases in ANG II resulting from activating hAGT would, in turn, lead to augmentation of intrarenal production of endogenous mAGT, which in turn could lead to further increases in intrarenal ANG II levels. Secondarily, we extended the study to evaluate if the hypertension and intrarenal ANG II levels elicited in this manner were also associated with the early indexes of proliferation and/or inflammatory responses in the kidneys as has been observed in rats infused with exogenous ANG II (23–25, 27, 30).
MATERIALS AND METHODS
Preparation of animals
The experimental protocol was approved by the Animal Care and Use Committees of Tulane University and University of Iowa. We used the following three groups of male mice: 1) single transgenic mice (group A, n = 14) expressing hAGT only in the kidney regulated by kidney-specific androgen-regulated protein promoter, 2) double-transgenic mice (group D, n= 13) expressing hR systemically in addition to hAGT only in the kidney, and 3) wild-type (group W, n = 12) mice of genetic background C57BL/6J. These mice have been characterized in previous studies (6, 8, 9). Exogenous hAGT protein is inactive in group A mice because endogenous mouse renin cannot cleave hAGT to ANG I because of high species specificity (12, 16). As previously described (11, 42), mice with only systemic overexpression of hR do not show an increase in blood pressure (BP) because of a high species specificity (12, 16). hR does not cleave ANG I from mAGT and thus we did not include a group with only systemic overexpression of hR in this study. In the colonies used for this study, systolic BP at 18 wk of age in mice with only systemic overexpression of hR was similar to that of group W mice (data not shown). All mice were monitored from 12 to 18 wk of age with free access to a regular diet and water. Systolic BP was measured in conscious mice using tail-cuff plethysmography (BP-2000; Visitech) one time per week as previously described (23–25, 27, 30).
Sample collection
Blood, kidney, and liver samples were harvested at 18 wk of age. After decapitation, trunk blood was collected into chilled tubes containing EDTA (5 mmol/1), enalaprilat (20 μmol/l), pepstatin A (10 μmol/l), and 1,10-phenanthroline (1.25 mmol/1). Plasma was separated and stored at −20°C until assayed for plasma ANG H as previously described (23–25, 27, 30). Immediately after removal, one kidney was homogenized in cold methanol, and renal ANG II was measured as previously described (23–25, 27, 30). The contralateral kidneys were separated into three pieces and immersed in RNAlater (Ambion) for total RNA extraction, immersed in zinc-saturated formalin (Anatech) for tissue fixation, and snap-frozen in liquid nitrogen for protein extraction. A small piece of liver was also collected in RNAlater for total RNA extraction.
Quantitative real-time RT-PCR
Total RNA extraction from mouse kidney and liver and quantitative real-time RT-PCR for exogenous hAGT mRNA and endogenous mAGT mRNA were performed as previously described (28, 39). Data of quantitative real-time RT-PCR were normalized by glyceraldehydes-3-phosphate dehydrogenase (GAPDH) mRNA expression. The information of sequences was as follows: exogenous hAGT mRNA, forward primer, 5′-CAG AAC TGG ATG TTG CTG CT-3′, reverse primer, 5′-GTT GTC CAC CCA GAA CTC CT -3′, probe, 5′-/56-FAM/ GCT TTC AAC ACC TAC GTC CAC TTC CAA /3BHQ-1/-3′; endogenous mAGT mRNA, forward primer, 5′-AAA GCA GGA GAG GAG GAA CA-3′, reverse primer, 5′-TGA GTC CTG CTC GTA GAT GG-3′, probe, 5′-/56-FAM/ ACT GGA TGT GAC CCT GAG CAG CC /3BHQ-1/-3′; GAPDH mRNA, forward primer, 5′-CAG AAC ATC ATC CCT GCA TC-3′, reverse primer, 5′-CTG CTT CAC CAC CTT CTT GA -3′, probe, 5′-/5-HEX/ CCT GGA GAA ACC TGC CAA GTA TGA TGA /3BHQ-2/-3′.
Development of antibodies
For this study, two lines of antibodies were newly raised using a custom service (Zymed Laboratories). Human-specific AGT antibodies were raised in chickens against a synthetic peptide (C)TELNLQKLSNDRIR, that is highly specific for humans. Purification of IgY-rich fraction was also done by Zymed Laboratories. Rodent-specific AGT antibodies were raised in rabbits against a synthetic peptide, (C)AGEEEQPTESAQQPGSPE, that is highly specific for rodents. Affinity purification was also done by Zymed Laboratories.
Western blot analysis
Protein extraction from mouse kidney and Western blot analysis for AGT and β-actin were performed as previously described (23–25, 27, 30). Data of Western blot analysis for endogenous mAGT protein levels were normalized by β-actin protein levels.
Evaluation of renal injury
With the use of zinc-saturated formalin-fixed paraffin-embedded renal sections, the early indexes of proliferation or inflammatory responses in mice were determined by the following three parameters: 1) interstitial collagen-positive area, 2) interstitial macrophage/monocyte infiltration, and 3) afferent arteriolar hypertrophy.
The extent of interstitial collagen-positive area was quantitatively evaluated by automatic image analysis of the area occupied by interstitial tissue staining positively for collagen in PicroSirius Red-stained sections (Mass Histology) as previously described (14, 26, 38). The fraction of renal cortex occupied by interstitial tissue was performed using the Image-Pro plus software (Media Cybernetics). For each microscopic field, the collagen-positive area (pink) was automatically calculated by the software, and this affected area was in turn divided by the total area of the microscopic field. Twenty consecutive microscopic fields were examined for each mouse, and the averaged percentages of the collagen-positive lesions were obtained for each mouse.
The number of macrophages/monocytes was examined by immunohistochemistry using a commercially available antibody against CD68 (Serotec) as previously described (20, 26, 38). Immunohistochemistry was performed by a robotic system (Autostainer; Dako) as previously described (26, 38) and counterstained with hematoxylin-eosin. Twenty consecutive microscopic fields were examined for each mouse, and CD68-positive cells (brown) were counted in interstitium in each microscopic field. The averaged numbers of macrophages/monocytes in interstitium were then obtained for each mouse.
The proliferation of afferent arteriolar wall was evaluated by immunohistochemistry using a commercially available antibody against α-smooth muscle isoform of actin (Sigma) as previously described (2, 26, 38). Immunohistochemistry was performed by a robotic system as previously described (26, 38). Because α-smooth muscle actin was expressed on both afferent and efferent arterioles, elastin was used, which stains only preglomerular vessels, to identify afferent arterioles. The thickness of the wall of afferent arterioles was then measured with microscopy (brown vessels besides a glomerulus in the center of the microscopic field). Twenty afferent arteriolar walls were examined for each mouse, and the averaged thickness of the wall of afferent arterioles was determined for each mouse.
The histological analyses were performed by an outsourcing company (Mass Histology) or a robotic system with an automatic image analysis software (Media Cybernetics) in a blind manner to avoid any biases.
Additional animal protocol
An additional cohort of three groups (groups A, D, and W) of male mice (18 wk of age, n = 4 in each) was prepared, and 24-h urine samples were collected using metabolic cages (Hatteras). Plasma samples were obtained from mice as described above. We have recently developed a sensitive and accurate method to measure hAGT using sandwich-type enzyme-linked immunosorbent assay (ELISA) in which a combination of two lines of human-specific AGT antibodies are used. Levels of hAGT in urine and in plasma from mice were measured by this human-specific AGT ELISA as described recently (21).
Statistical analysis
Statistical analysis was performed using a one-way factorial ANOVA with post hoc Scheffé’s F test. All data are presented as means ± SE. P < 0.05 was considered significant.
RESULTS
Systolic BP
Systolic BPs (Fig. 1 A) were similar at 12 wk of age among the three groups. Systolic BP progressively increased from 116 ± 5 mmHg (12 wk) to 140 ± 7 (18 wk) in double-transgenic mice (group D) expressing hR systemically in addition to hAGT only in the kidney during this period. This increase was not observed in single-transgenic mice (group A, 117 ± 2 at 18 wk) expressing hAGT only in the kidney or wild-type mice (group W, 116 ± 2 at l8 wk).
Fig. 1.
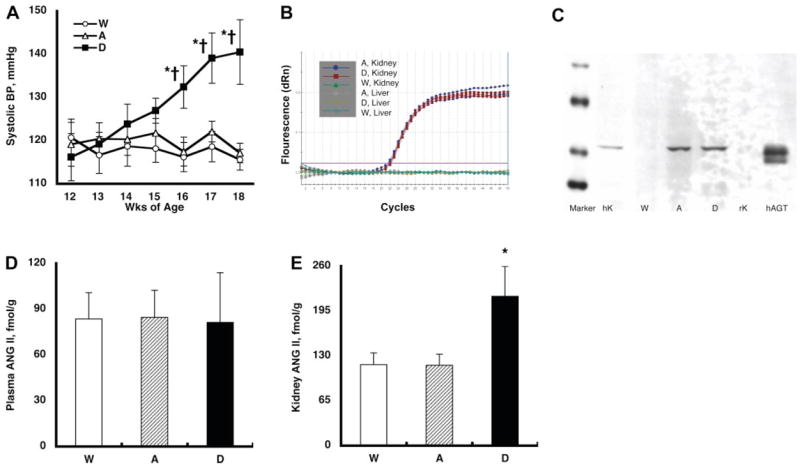
A: temporal profile of systolic blood pressure (BP). Systolic BP was similar at 12 wk of age among the three groups. However, systolic BP progressively increased from 116 ± 5(12 wk) to 140 ± 7 (18 wk) mmHg in double-transgenic mice (group D) expressing human renin (hR) systemically in addition to human (h) angiotensinogen (AGT) only in the kidney during this period. This increase was not observed in single-transgenic mice (group A, 117 ± 2 at 18 wk) expressing hAGT only in the kidney or wild type mice (group W, 116 ± 2 at 18 wk). P < 0.05 compared with the corresponding group W mice at that time period (*) and compared with the corresponding group at 12 wk of age (†). B: representative amplification plot of the real-time RT-PCR for exogenous hAGT mRNA. Kidney RNA samples from group A and group D mice demonstrated a nice and equivalent amplification. Kidney RNA samples from group W mice did not show any amplification. Moreover, liver samples from either group A, group D, or group W mice did not exhibit any amplification. These data clearly indicate that the exogenous hAGT mRNA were expressed only in the kidneys of group A and D mice. C: representative Western blot analysis for exogenous hAGT protein. The developed antibody specific for hAGT recognized AGT in human kidney (hK, 10 μg of protein) and plasma (50 ng; Calbiochem) but not in rat kidney (rK, 10 μg of protein). With the use of this human-specific AGT antibody, kidney protein samples (10 μg of protein) from group A, D, and W mice were evaluated. This human-specific AGT antibody demonstrated AGT protein in group A and D mice but not in group W mice. These data clearly indicate that the exogenous hAGT protein was expressed only in the kidneys of group A and D mice. D: plasma ANG II concentrations. Plasma ANG II levels were similar among the 3 groups. E: kidney ANG II contents. Kidney ANG II levels were increased significantly in group D mice (216 ± 43 fmol/g) compared with group A (117 ± 16) and group W (118 ± 17) mice. *P < 0.05 compared with the group W mice.
Exogenous hAGT mRNA
Figure 1B demonstrates a representative amplification plot of the real-time RT-PCR for exogenous hAGT mRNA. Kidney RNA samples from group A and group D mice demonstrated an equivalent amplification. Kidney RNA samples from group W mice did not show any amplification. Moreover, liver samples from either group A, group D, or group W mice did not exhibit any amplification. These data clearly indicate that the exogenous hAGT mRNA was expressed in the kidneys of group A and group D mice and not in the liver, showing that hAGT does not simply colocalize with mAGT.
Exogenous hAGT protein
Figure 1C demonstrates a representative Western blot analysis for exogenous hAGT protein. The antibody specific for hAGT recognized AGT in human kidney and plasma but not in rat kidney. We previously reported that Western blot analysis for rat AGT demonstrates double bands in plasma but a single band in kidney because of the different magnitude of glycosylation (24). This interpretation may account for the double band in human plasma and the single band in human kidney. With the use of this human-specific AGT antibody, kidney protein samples from group A, D, and W mice were evaluated. As depicted in Fig. 1 C, this human-specific AGT antibody demonstrated AGT protein in group A and D mice but not in group W mice. These data clearly indicate that the exogenous hAGT protein was expressed in the kidneys of group A and D mice.
Plasma and kidney ANG II levels
As demonstrated in Fig. 1D, plasma ANG II concentrations were similar among the three groups. However, kidney ANG II levels were increased significantly in group D mice (216 ± 43 fmol/g) compared with group A (117 ± 16) and group W (118 ± 17) mice, as depicted in Fig. 1E. Thus selective stimulation of intrarenal hAGT in group D mice leads to increases in ANG II levels that are restricted to the kidney and do not lead to increases in plasma ANG II levels, indicating no perceptible release of intrarenal ANG II systemically.
Endogenous mAGT mRNA
Figure 2A demonstrates that endogenous mAGT mRNA levels in the kidney were significantly increased in group D mice (1.46 ± 0.19, relative ratio) compared with group A (0.97 ± 0.12) and group W (1.00 ± 0.08) mice. This augmentation was limited to the kidney, and endogenous mAGT mRNA levels in the liver were not altered among the three groups as described in Fig. 2B.
Fig. 2.
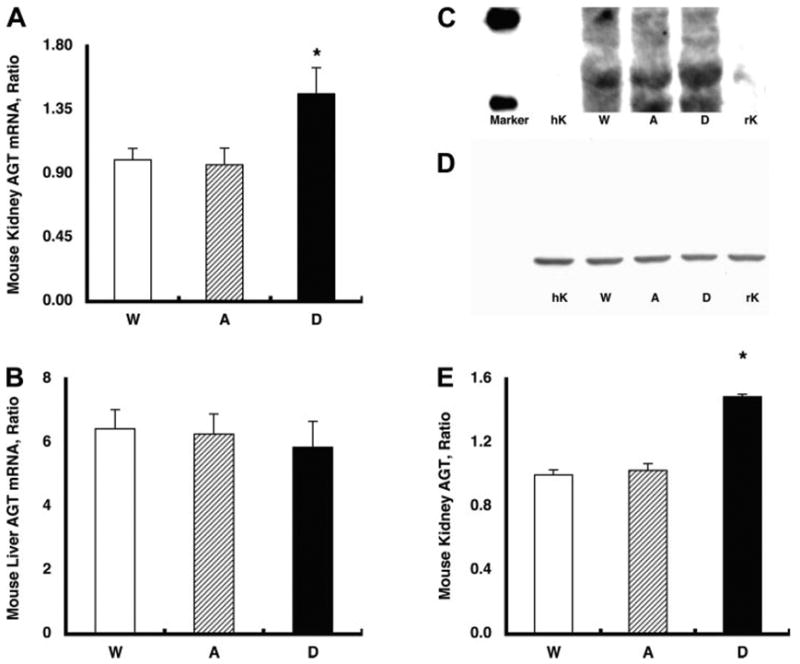
A: endogenous mouse (m) AGT mRNA levels in the kidney. Endogenous mAGT mRNA levels in the kidney were increased significantly in group D mice (1.46 ± 0.19, relative ratio) compared with group A (0.97 ± 0.12) and group W (1.00 ± 0.08) mice. *P < 0.05 compared with the group W mice. B: endogenous mAGT mRNA levels in the liver. The augmented endogenous mAGT levels were limited in the kidney because endogenous mAGT mRNA levels in the liver were not altered among the three groups. C: representative Western blot analysis for endogenous mAGT protein. The developed antibody specific for rodent AGT recognized AGT in mouse kidney (10 μg of protein) and rat kidney (10 μg of protein) but not in human kidney (10 μg of protein). With the use of this rodent-specific AGT antibody, kidney protein samples from group A, D, and W mice were evaluated. D: representative Western blot analysis for β-actin protein showing that β-actin protein levels were similar among the groups. E: densitometric analysis demonstrated that endogenous mAGT protein in the kidney was also increased significantly in group D (1.49 ± 0.02, relative ratio) compared with group A (1.03 ± 0.04) and group W (1.00 ± 0.03) mice. *P < 0.05 compared with the group W mice.
Endogenous mAGT protein
Figure 2C demonstrates a representative Western blot analysis for endogenous mAGT protein. The antibody specific for rodent AGT recognizes AGT in mouse kidney and rat kidney but not in human kidney. With the use of this rodent-specific AGT antibody, kidney protein samples from group A, D, and W mice were evaluated. As depicted in Fig. 2D, (3-actin protein levels were similar among the groups. However, as demonstrated in Fig. 2E, endogenous mAGT protein in the kidney was increased significantly in group D (1.49 ± 0.02, relative ratio) compared with group A (1.03 ± 0.04) and group W (1.00 ± 0.03) mice.
Interstitial collagen-positive area
The interstitial collagen-positive area was stained by PicroSirius Red using zinc-saturated formalin-fixed paraffin-embedded kidney samples from group W (Supplemental Fig. 1A), group A (Supplemental Fig. 1B), and group D (Supplemental Fig. 1C) mice. (Supplemental material for this article can be found at the American Journal of Physiology: Renal Physiology web site.) The collagen-positive area is stained in pink. Analysis using a computer-aided semiautomatic quantification system demonstrated that the interstitial collagen-positive area was increased significantly in group D mice (0.52 ± 0.06%) compared with group A (0.36 ± 0.05) and group W (0.34 ± 0.03) mice as depicted in Supplemental Fig. 1D.
Interstitial macrophage/monocyte infiltration
The interstitial macrophage/monocyte infiltration was evaluated by CD68-positive cell number, which is a surface marker for macro-phages and monocytes, using zinc-saturated formalin-fixed paraffin-embedded kidney samples from group W (Fig. 3A), group A (Fig. 3B), and group D (Fig. 3C) mice. CD68-positive cells are stained in brown. CD68-positive cell numbers were increased significantly in group D mice (46 ± 5 cells/mm2) compared with group A (20 ± 3) and group W (19 ± 2) mice, as demonstrated in Fig. 3D.
Fig. 3.
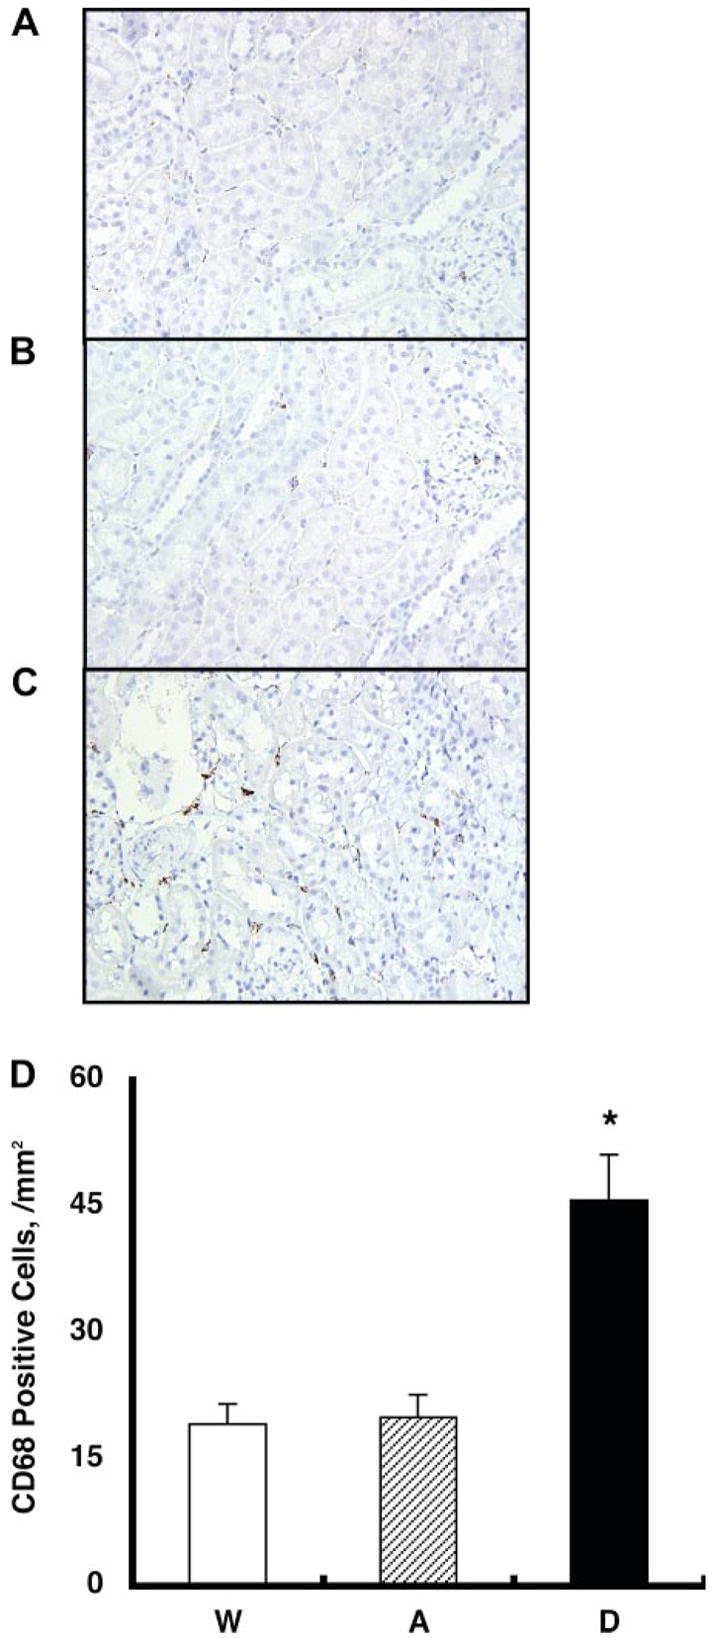
Interstitial macrophage/monocyte infiltration was evaluated by CD68-positive cell number, which is a surface marker for macrophages and monocytes, using zinc-saturated formalin-fixed paraffin-embedded kidney samples from group W (A), group A (B), and group D (C) mice. CD68-positive cells are stained in brown. D: CD68-positive cell numbers were increased significantly in group D mice (46 ± 5 cells/mm2) compared with group A (20 ± 3) and group W (19 ± 2) mice. *P < 0.05 compared with the group W mice.
Afferent arteriolar hypertrophy
The thickness of afferent arteriolar wall was visualized by immunohistochemistry of α-smooth muscle isoform of actin and elastin stain using zinc-saturated formalin-fixed paraffin-embedded kidney samples from group W (Fig. 4A), group A (Fig. 4B), and group D (Fig. 4C mice. Afferent arteriolar walls are stained in brown and purple. The thickness of afferent arteriolar wall was increased significantly in group D mice (3.31 ± 0.41 μm) compared with group A (2.21 ± 0.12) and group W (2.16 ± 0.11) mice, as demonstrated in Fig. 4D.
Fig. 4.
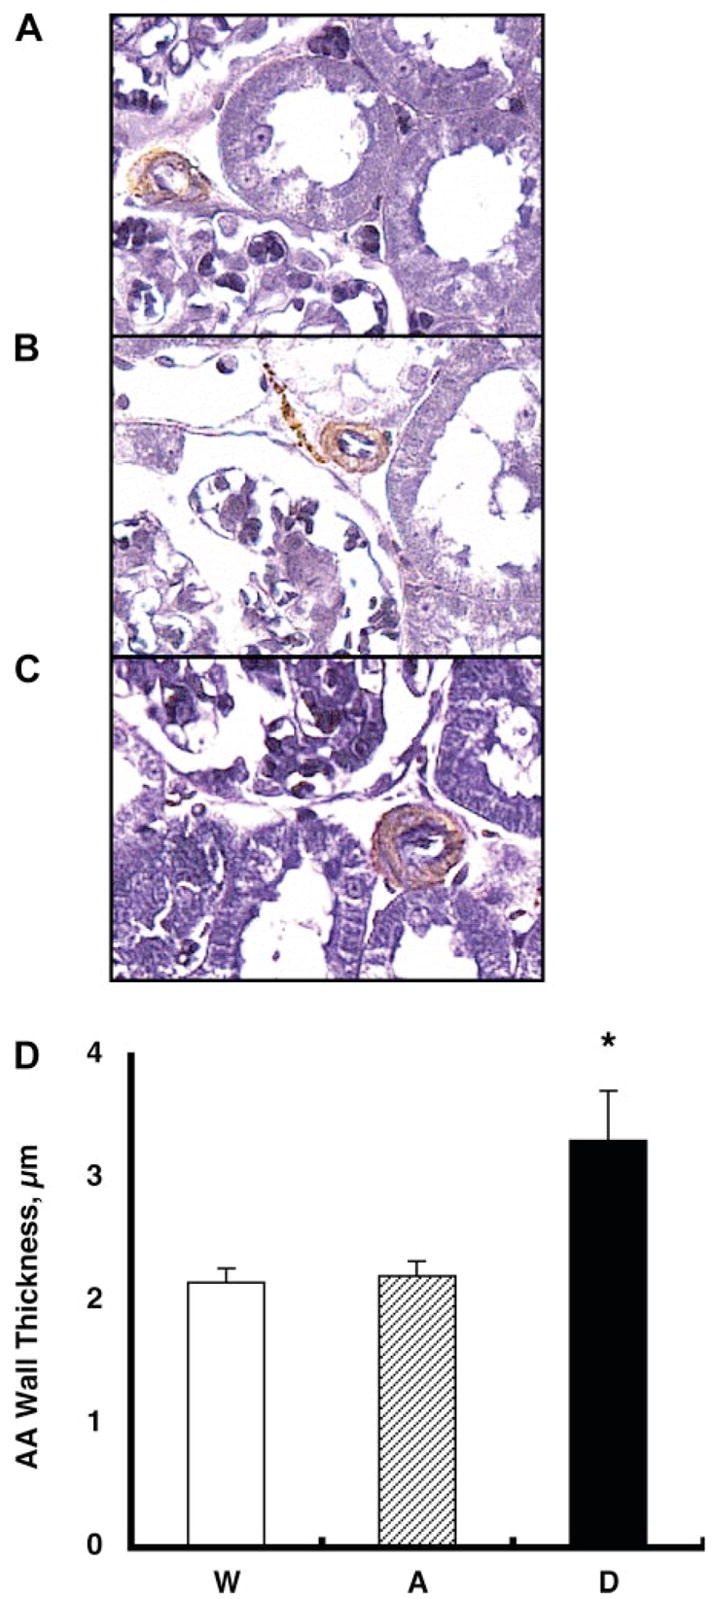
The thickness of afferent arteriolar (AA) wall was visualized by immunohistochemistry of α-smooth muscle isoform of actin and elastin stain using zinc-saturated formalin-fixed paraffin-embedded kidney samples from group W (A), group A (B), and group D (C) mice. Afferent arteriolar walls are stained in brown and purple. D: the thickness of afferent arteriolar wall was increased significantly in group D mice (3.31 ± 0.41 μm) compared with group A (2.21 ± 0.12) and group W (2.16 ± 0.11) mice. *P < 0.05 compared with group W mice.
Levels of hAGT in urine and in plasma from mice
Using a human-specific AGT ELISA system, we measured 12 urinary samples from group W mice (n = 4), group A mice (n = 4), and group D mice (n = 4) and 12 plasma samples from group W mice (n = 4), group A mice (n = 4), and group D mice (n = 4). Our ELISA system clearly showed that urinary samples from group A and group D mice have detectable levels of hAGT (7.4 ± 2.1 and 11.5 ± 2.2 ng/ml, respectively). However, urinary samples from group W mice do not have detectable levels of hAGT. Moreover, we were not able to detect any hAGT in plasma samples from either mouse. These data indicate that leak of exogenous hAGT in the plasma in group A mice or group D mice is negligible.
DISCUSSION
With the use of a transgenic mouse model in which hAGT is expressed only in the kidney (6, 8, 9), the present data demonstrate that selective renal overproduction of ANG II elicited by stimulating hAGT present only in the kidney in the presence of hR increases endogenous mAGT mRNA and protein expression in kidneys, leading to slowly progressive hypertension and the associated proliferative and inflammatory early responses suggesting initiation of renal injury. In preliminary studies, we confirmed that systolic BP in group D mice was not increased before 12 wk of age. Moreover, systolic BP in group D mice increased during the subsequent 6 wk and did not increase further after 18 wk of age. The group D mice remain hypertensive after this age (data not shown), but we chose to study them at 18 wk to investigate primarily the early events. We did not measure plasma testosterone levels of these mice because of the lack of the plasma sample volumes. However, the temporal profile of systolic BP suggests that sexual maturation starts at 12 wk of age and is fully functional by 18 wk of age in these mice.
For this study, two lines of antibodies against AGT were developed. One is specific for hAGT; the other is specific for rodent AGT. The antibody specific for hAGT recognized AGT in human kidney and plasma but not in rat kidney or group W mice kidney, as shown in Fig. 1C. In contrast, the antibody specific for rodent AGT recognized AGT in mouse kidney and rat kidney but not in human kidney, as demonstrated in Fig. 2C. These data clearly indicate that the two antibodies were specific for hAGT and specific for rodent AGT.
Previous studies have shown that ANG II-infused rats have increases in renal AGT mRNA (24, 41) and protein (23) contributing to the elevated intrarenal ANG II levels. Transgenic mice expressing hAGT only in the kidney develop hypertension when a source of hR is available (6, 8, 9). The effects of the ANG II formed from hAGT could be amplified by the local augmentation mechanism by which mAGT was stimulated. Several in vitro studies have demonstrated ANG II-induced augmentation of AGT mRNA expression. Klett et al. (22) presented evidence that ANG II enhances hepatic AGT synthesis by inhibiting degradation of AGT mRNA in hepatocytes. Li and Brasier (32) suggested that activation of the AGT gene by ANG II is mediated by the nuclear factor-κB p65 transcription factor in hepatocytes. Tamura et al. (43) showed that ANG II activates transcription of the AGT gene exclusively via the ANG II type 1 (AT1) receptor pathway in cardiac myocytes. Mascareno et al. (33) showed that activation of the AGT promoter by ANG II depends on the signal transducer and activator of transcription protein signal pathway in cardiac myocytes. Although less is known about the amplification mechanisms in renal tissues, Ingelfinger et al. (17) demonstrated an enhanced AGT mRNA expression by ANG II in an immortalized proximal tubular cell line. These findings support the concept that selective increases in intrarenal ANG II stimulate its precursor, AGT, in the kidney, thus leading to the enhanced intrarenal ANG II formation and the development of progressive hypertension and renal injury in this study. The present study provides direct evidence demonstrating that mAGT mRNA and protein are indeed augmented following stimulation of local ANG II formation from hAGT. Further studies will be needed to determine the quantitative roles of hAGT vs. mAGT to the augmented intrarenal ANG II levels, and the role of activation of mAGT is essential in the subsequent development of the progressive hypertension and the associated proliferative and inflammatory responses initiating renal injury.
The importance of the intrarenal RAS in the development of hypertension and renal injury is also reported in a recent study using a different transgenic mouse model. Sachetelli et al. (40) generated transgenic mice in which kidney-specific overexpression of rat AGT significantly increased BP and initiated renal injury. They also report that treatment with an AT1 receptor antagonist or with an angiotensin-converting enzyme inhibitor reversed these abnormalities in transgenic animals. Our results extend these findings and provide novel information by showing that locally generated ANG II leads to further stimulation of endogenous mAGT. The crucial role of intrarenal ANG II in the development of hypertension is also reported in a recent study by Crowley et al. (4) using a kidney cross-transplantation model. They clearly illustrated in the systemic AT1A receptor knockout mice that the presence of AT1A receptors only in the kidney is sufficient to recapitulate the phenotype of hypertension with ANG II infusion. Conversely, in the renal AT1A receptor knockout group, the absence of AT1A receptors from the kidney alone is sufficient to protect these mice from ANG II-dependent hypertension, despite the expression of AT1A receptors in a number of other key areas that potentially impact BP homeostasis. Although actions of the RAS in a variety of target organs have the potential to promote high BP and tissue injury, they concluded that ANG II causes hypertension primarily through effects on AT1 receptors in the kidney. The intrarenal ANG II augmentation mechanism demonstrated in the present study helps to explain the potent role of intrarenal ANG II in the development of hypertension.
The observed effects could be directly related to increased intrarenal ANG II levels or to the associated increased BP effects of ANG II. Although not specifically addressed in the present study, we have addressed this issue in a recent paper (28). Spontaneously hypertensive rats (SHR) showed the enhanced intrarenal ANG II and hypertension and renal injury at 14 wk of age compared with SHR at 7 wk of age. Two groups of SHR received either an AT1 receptor blocker (olmesartan, 5 mg/day) or triple therapy (hydralazine, 7.5 mg/day; reserpine, 0.15 mg/day; hydrochlorothiazide, 3 mg/day) during weeks 7–14. Olmesartan treatment and the triple-therapy treatment both prevented hypertension. Although olmesartan treatment prevented the augmented intrarenal ANG II and the development of renal injury, the triple-therapy treatment failed to prevent the augmented intrarenal ANG II or the development of renal injury. These results indicate that the development of renal injury in SHR at 14 wk of age was more related to intrarenal ANG II than BP.
It is not clear in this study why an increase in BP failed to downregulate the endogenous circulating ANG II levels, although this may have been balanced by increased ANG II release from the kidneys. Liver mAGT mRNA levels tended to decrease in the group D mice compared with other groups in this study; however, the difference is not statistically significant. The increase in BP in the group D mice (24 mmHg) may fail to downregulate endogenous ANG II because of the local amplification mechanisms, as previously shown in ANG II-infused rats. From studies in rats, it has become clear that, although the hypertension clearly downregulates endogenous juxtaglomerular apparatus renin mRNA and protein, the intrarenal ANG II levels actually increase in a manner apparently independent of juxtaglomerular apparatus renin. This augmentation is the result of several factors, including the presence of renin in proximal and distal nephron segments (39).
In conclusion, these data indicate for the first time that the selective intrarenal overproduction of ANG II stimulates endogenous intrarenal mAGT mRNA and protein expression, which may contribute to the slowly progressive hypertension and the associated initiation of renal injury in the gene-targeted mice.
Supplementary Material
Acknowledgments
We acknowledge excellent technical assistance from My-Linh Rauv, Duy V. Tran, and Dale M. Seth (Tulane University).
Portions of this study were presented in abstract forms at the 59th Annual Fall Conference and Scientific Sessions of the Council for High Blood Pressure Research in association with the Council on the Kidney in Cardiovascular Disease in Washington, D.C. (Hypertension 46: 817, 2005), the 60th Annual Fall Conference and Scientific Sessions of the Council for High Blood Pressure Research in association with the Council on the Kidney in Cardiovascular Disease in San Antonio, TX (Hypertension 48: e26–e27, 2006), and the 21st Scientific Meeting of the International Society of Hypertension in Fukuoka, Japan (J Hypertens 24: S6–S59, 2006).
GRANTS
This study was supported by grants from the National Institute of Diabetes and Digestive and Kidney Diseases (R01DK-072408), the National Center for Research Resources (P20RR-017659), the National Heart, Lung, and Blood Institute (R01HL-026371), the Health Excellence Fund from Louisiana Board of Regents, and Sankyo Co. Ltd. (Tokyo, Japan).
References
- 1.Baltatu O, Silva JA, Jr, Ganten D, Bader M. The brain renin-angiotensin system modulates angiotensin II-induced hypertension and cardiac hypertrophy. Hypertension. 2000;35:409–412. doi: 10.1161/01.hyp.35.1.409. [DOI] [PubMed] [Google Scholar]
- 2.Carey AV, Carey RM, Gomez RA. Expression of alpha-smooth muscle actin in the developing kidney vasculature. Hypertension. 1992;19:II168–II175. doi: 10.1161/01.hyp.19.2_suppl.ii168. [DOI] [PubMed] [Google Scholar]
- 3.Casarini DE, Boim MA, Stella RC, Krieger-Azzolini MH, Krieger JE, Schor N. Angiotensin I-converting enzyme activity in tubular fluid along the rat nephron. Am J Physiol Renal Physiol. 1997;272:F405–F409. doi: 10.1152/ajprenal.1997.272.3.F405. [DOI] [PubMed] [Google Scholar]
- 4.Crowley SD, Gurley SB, Herrera MJ, Ruiz P, Griffiths R, Kumar AP, Kim HS, Smithies O, Le TH, Coffman TM. Angiotensin II causes hypertension and cardiac hypertrophy through its receptors in the kidney. Proc Natl Acad Sci USA. 2006;103:17985–17990. doi: 10.1073/pnas.0605545103. [DOI] [PMC free article] [PubMed] [Google Scholar]
- 5.Danser AH, Admiraal PJ, Derkx FH, Schalekamp MA. Angiotensin I-to-II conversion in the human renal vascular bed. J Hypertens. 1998;16:2051–2056. doi: 10.1097/00004872-199816121-00029. [DOI] [PubMed] [Google Scholar]
- 6.Davisson RL, Ding Y, Stec DE, Catterall JF, Sigmund CD. Novel mechanism of hypertension revealed by cell-specific targeting of human angiotensinogen in transgenic mice. Physiol Genomics. 1999;1:3–9. doi: 10.1152/physiolgenomics.1999.1.1.3. [DOI] [PubMed] [Google Scholar]
- 7.Dell’Italia LJ, Meng QC, Balcells E, Wei CC, Palmer R, Hageman GR, Durand J, Hankes GH, Oparil S. Compartmentalization of angiotensin II generation in the dog heart Evidence for independent mechanisms in intravascular and interstitial spaces. J Clin Invest. 1997;100:253–258. doi: 10.1172/JCI119529. [DOI] [PMC free article] [PubMed] [Google Scholar]
- 8.Ding Y, Davisson RL, Hardy DO, Zhu LJ, Merrill DC, Catterall JF, Sigmund CD. The kidney androgen-regulated protein promoter confers renal proximal tubule cell-specific and highly androgen-responsive expression on the human angiotensinogen gene in transgenic mice. J Biol Chem. 1997;272:28142–28148. doi: 10.1074/jbc.272.44.28142. [DOI] [PubMed] [Google Scholar]
- 9.Ding Y, Sigmund CD. Androgen-dependent regulation of human angiotensinogen expression in KAP-hAGT transgenic mice. Am J Physiol Renal Physiol. 2001;280:F54–F60. doi: 10.1152/ajprenal.2001.280.1.F54. [DOI] [PubMed] [Google Scholar]
- 10.Dzau VJ, Re R. Tissue angiotensin system in cardiovascular medicine. A paradigm shift? Circulation. 1994;89:493–498. doi: 10.1161/01.cir.89.1.493. [DOI] [PubMed] [Google Scholar]
- 11.Fukamizu A, Hatae T, Kon Y, Sugimura M, Hasegawa T, Yokoyama M, Nomura T, Katsuki M, Murakami K. Human renin in transgenic mouse kidney is localized to juxtaglomerular cells. Biochem J. 1991;278:601–603. doi: 10.1042/bj2780601. [DOI] [PMC free article] [PubMed] [Google Scholar]
- 12.Fukamizu A, Sugimura K, Takimoto E, Sugiyama F, Seo MS, Takahashi S, Hatae T, Kajiwara N, Yagami K, Murakami K. Chimeric renin-angiotensin system demonstrates sustained increase in blood pressure of transgenic mice carrying both human renin and human angiotensinogen genes. J Biol Chem. 1993;268:11617–11621. [PubMed] [Google Scholar]
- 13.Fukui T, Ishizaka N, Rajagopalan S, Laursen JB, Capers Qt, Taylor WR, Harrison DG, de Leon H, Wilcox JN, Griendling KK. p22phox mRNA expression and NADPH oxidase activity are increased in aortas from hypertensive rats. Circ Res. 1997;80:45–51. doi: 10.1161/01.res.80.1.45. [DOI] [PubMed] [Google Scholar]
- 14.Graciano ML, Cavaglieri RdC, Delle H, Dominguez WV, Casarini DE, Malheiros DMAC, Noronha IL. Intrarenal renin-angiotensin system is upregulated in experimental model of progressive renal disease induced by chronic inhibition of nitric oxide synthesis. J Am Soc Nephrol. 2004;15:1805–1815. doi: 10.1097/01.asn.0000131528.00773.a9. [DOI] [PubMed] [Google Scholar]
- 15.Griendling KK, Minieri CA, Ollerenshaw JD, Alexander RW. Angiotensin II stimulates NADH and NADPH oxidase activity in cultured vascular smooth muscle cells. Circ Res. 1994;74:1141–1148. doi: 10.1161/01.res.74.6.1141. [DOI] [PubMed] [Google Scholar]
- 16.Hatae T, Takimoto E, Murakami K, Fukamizu A. Comparative studies on species-specific reactivity between renin and angiotensinogen. Mol Cell Biochem. 1994;131:43–47. doi: 10.1007/BF01075723. [DOI] [PubMed] [Google Scholar]
- 17.Ingelfinger JR, Jung F, Diamant D, Haveran L, Lee E, Brem A, Tang SS. Rat proximal tubule cell line transformed with origin-defective SV40 DNA: autocrine ANG II feedback. Am J Physiol Renal Physiol. 1999;276:F218–F227. doi: 10.1152/ajprenal.1999.276.2.F218. [DOI] [PubMed] [Google Scholar]
- 18.Ingelfinger JR, Pratt RE, Ellison K, Dzau VJ. Sodium regulation of angiotensinogen mRNA expression in rat kidney cortex and medulla. J Clin Invest. 1986;78:1311–1315. doi: 10.1172/JCI112716. [DOI] [PMC free article] [PubMed] [Google Scholar]
- 19.Ingert C, Grima M, Coquard C, Barthelmebs M, Imbs JL. Contribution of angiotensin II internalization to intrarenal angiotensin II levels in rats. Am J Physiol Renal Physiol. 2002;283:F1003–F1010. doi: 10.1152/ajprenal.00322.2001. [DOI] [PubMed] [Google Scholar]
- 20.Kanda T, Wakino S, Hayashi K, Homma K, Ozawa Y, Saruta T. Effect of fasudil on Rho-kinase and nephropathy in subtotally nephrectomized spontaneously hypertensive rats. Kidney Int. 2003;64:2009–2019. doi: 10.1046/j.1523-1755.2003.00300.x. [DOI] [PubMed] [Google Scholar]
- 21.Katsurada A, Hagiwara Y, Miyashita K, Satou R, Miyata K, Ohashi N, Navar LG, Kobori H. Novel Sandwich ELISA for Human Angiotensinogen. Am J Physiol Renal Physiol. doi: 10.1152/ajprenal.00090.2007. In press. [DOI] [PMC free article] [PubMed] [Google Scholar]
- 22.Klett C, Nobiling R, Gierschik P, Hackenthal E. Angiotensin II stimulates the synthesis of angiotensinogen in hepatocytes by inhibiting adenylylcyclase activity and stabilizing angiotensinogen mRNA. J Biol Chem. 1993;268:25095–25107. [PubMed] [Google Scholar]
- 23.Kobori H, Harrison-Bernard LM, Navar LG. Enhancement of angiotensinogen expression in angiotensin II-dependent hypertension. Hypertension. 2001;37:1329–1335. doi: 10.1161/01.hyp.37.5.1329. [DOI] [PMC free article] [PubMed] [Google Scholar]
- 24.Kobori H, Harrison-Bernard LM, Navar LG. Expression of angiotensinogen mRNA and protein in angiotensin II-dependent hypertension. J Am Soc Nephrol. 2001;12:431–439. doi: 10.1681/asn.v123431. [DOI] [PMC free article] [PubMed] [Google Scholar]
- 25.Kobori H, Harrison-Bernard LM, Navar LG. Urinary excretion of angiotensinogen reflects intrarenal angiotensinogen production. Kidney Int. 2002;61:579–585. doi: 10.1046/j.1523-1755.2002.00155.x. [DOI] [PMC free article] [PubMed] [Google Scholar]
- 26.Kobori H, Katsurada A, Ozawa Y, Satou R, Miyata K, Hase N, Suzaki Y, Shoji T. Enhanced intrarenal oxidative stress and angiotensinogen in IgA nephropathy patients. Biochem Biophys Res Commun. 2007;358:156–163. doi: 10.1016/j.bbrc.2007.04.105. [DOI] [PMC free article] [PubMed] [Google Scholar]
- 27.Kobori H, Nishiyama A, Harrison-Bernard LM, Navar LG. Urinary angiotensinogen as an indicator of intrarenal angiotensin status in hypertension. Hypertension. 2003;41:42–49. doi: 10.1161/01.hyp.0000050102.90932.cf. [DOI] [PMC free article] [PubMed] [Google Scholar]
- 28.Kobori H, Ozawa Y, Suzaki Y, Nishiyama A. Enhanced intrarenal angiotensinogen contributes to early renal injury in spontaneously hypertensive rats. J Am Soc Nephrol. 2005;16:2073–2080. doi: 10.1681/ASN.2004080676. [DOI] [PMC free article] [PubMed] [Google Scholar]
- 29.Kobori H, Ozawa Y, Suzaki Y, Prieto-Carrasquero MC, Nishiyama A, Shoji T, Cohen EP, Navar LG. Young Scholars Award Lecture: Intra-tubular angiotensinogen in hypertension and kidney diseases. Am J Hypertens. 2006;19:541–550. doi: 10.1016/j.amjhyper.2005.11.014. [DOI] [PMC free article] [PubMed] [Google Scholar]
- 30.Kobori H, Prieto-Carrasquero MC, Ozawa Y, Navar LG. AT1 receptor mediated augmentation of intrarenal angiotensinogen in angiotensin II-dependent hypertension. Hypertension. 2004;43:1126–1132. doi: 10.1161/01.HYP.0000122875.91100.28. [DOI] [PMC free article] [PubMed] [Google Scholar]
- 31.Komlosi P, Fuson AL, Fintha A, Peti-Peterdi J, Rosivall L, Warnock DG, Bell PD. Angiotensin I conversion to angiotensin II stimulates cortical collecting duct sodium transport. Hypertension. 2003;42:195–199. doi: 10.1161/01.HYP.0000081221.36703.01. [DOI] [PubMed] [Google Scholar]
- 32.Li J, Brasier AR. Angiotensinogen gene activation by angiotensin II is mediated by the rel A (nuclear factor-kappaB p65) transcription factor: one mechanism for the renin angiotensin system positive feedback loop in hepatocytes. Mol Endocrinol. 1996;10:252–264. doi: 10.1210/mend.10.3.8833654. [DOI] [PubMed] [Google Scholar]
- 33.Mascareno E, Dhar M, Siddiqui MA. Signal transduction and activator of transcription (STAT) protein-dependent activation of angiotensinogen promoter: a cellular signal for hypertrophy in cardiac muscle. Proc Natl Acad Sci USA. 1998;95:5590–5594. doi: 10.1073/pnas.95.10.5590. [DOI] [PMC free article] [PubMed] [Google Scholar]
- 34.Mazzocchi G, Malendowicz LK, Markowska A, Albertin G, Nussdorfer GG. Role of adrenal renin-angiotensin system in the control of aldosterone secretion in sodium-restricted rats. Am J Physiol Endocrinol Metab. 2000;278:E1027–E1030. doi: 10.1152/ajpendo.2000.278.6.E1027. [DOI] [PubMed] [Google Scholar]
- 35.Moe OW, Ujiie K, Star RA, Miller RT, Widell J, Alpern RJ, Henrich WL. Renin expression in renal proximal tubule. J Clin Invest. 1993;91:774–779. doi: 10.1172/JCI116296. [DOI] [PMC free article] [PubMed] [Google Scholar]
- 36.Murphy TJ, Alexander RW, Griendling KK, Runge MS, Bernstein KE. Isolation of a cDNA encoding the vascular type-1 angiotensin II receptor. Nature. 1991;351:233–236. doi: 10.1038/351233a0. [DOI] [PubMed] [Google Scholar]
- 37.Navar LG, Harrison-Bernard LM, Nishiyama A, Kobori H. Regulation of intrarenal angiotensin II in hypertension. Hypertension. 2002;39:316–322. doi: 10.1161/hy0202.103821. [DOI] [PMC free article] [PubMed] [Google Scholar]
- 38.Ozawa Y, Kobori H, Suzaki Y, Navar LG. Sustained renal interstitial macrophage infiltration following chronic angiotensin II infusions. Am J Physiol Renal Physiol. 2007;292:F330–F339. doi: 10.1152/ajprenal.00059.2006. [DOI] [PMC free article] [PubMed] [Google Scholar]
- 39.Prieto-Carrasquero MC, Kobori H, Ozawa Y, Gutierrez A, Seth D, Navar LG. AT1 receptor-mediated enhancement of collecting duct renin in angiotensin II-dependent hypertensive rats. Am J Physiol Renal Physiol. 2005;289:F632–F637. doi: 10.1152/ajprenal.00462.2004. [DOI] [PMC free article] [PubMed] [Google Scholar]
- 40.Sachetelli S, Liu Q, Zhang SL, Liu F, Hsieh TJ, Brezniceanu ML, Guo DF, Filep JG, Ingelfinger JR, Sigmund CD, Hamet P, Chan JS. RAS blockade decreases blood pressure and proteinuria in transgenic mice overexpressing rat angiotensinogen gene in the kidney. Kidney Int. 2006;69:1016–1023. doi: 10.1038/sj.ki.5000210. [DOI] [PubMed] [Google Scholar]
- 41.Schunkert H, Ingelfinger JR, Jacob H, Jackson B, Bouyounes B, Dzau VJ. Reciprocal feedback regulation of kidney angiotensinogen and renin mRNA expressions by angiotensin II. Am J Physiol Endocrinol Metab. 1992;263:E863–E869. doi: 10.1152/ajpendo.1992.263.5.E863. [DOI] [PubMed] [Google Scholar]
- 42.Sigmund CD, Jones CA, Kane CM, Wu C, Lang JA, Gross KW. Regulated tissue- and cell-specific expression of the human renin gene in transgenic mice. Circ Res. 1992;70:1070–1079. doi: 10.1161/01.res.70.5.1070. [DOI] [PubMed] [Google Scholar]
- 43.Tamura K, Umemura S, Nyui N, Hibi K, Ishigami T, Kihara M, Toya Y, Ishii M. Activation of angiotensinogen gene in cardiac myocytes by angiotensin II and mechanical stretch. Am J Physiol Regul Integr Comp Physiol. 1998;275:R1–R9. doi: 10.1152/ajpregu.1998.275.1.R1. [DOI] [PubMed] [Google Scholar]
Associated Data
This section collects any data citations, data availability statements, or supplementary materials included in this article.