Abstract
Structural transitions of RNA between alternate conformations with similar stabilities are associated with important aspects of cellular function. Few techniques presently exist that are capable of monitoring such transitions and thereby provide insight into RNA dynamics and function at atomic resolution. Riboswitches are found in the 5′-UTR of mRNA and control gene expression through structural transitions after ligand recognition. A time-resolved NMR strategy was established in conjunction with laser-triggered release of the ligand from a photocaged derivative in situ to monitor the hypoxanthine-induced folding of the guanine-sensing riboswitch aptamer domain of the Bacillus subtilis xpt-pbuX operon at atomic resolution. Combining selective isotope labeling of the RNA with NMR filter techniques resulted in significant spectral resolution and allowed kinetic analysis of the buildup rates for individual nucleotides in real time. Three distinct kinetic steps associated with the ligand-induced folding were delineated. After initial complex encounter the ligand-binding pocket is formed and results in subsequent stabilization of a remote long-range loop–loop interaction. Incorporation of NMR data into experimentally restrained molecular dynamics simulations provided insight into the RNA structural ensembles involved during the conformational transition.
Keywords: spectroscopy, riboswitches, dynamics, purine, caged compound
Structural transitions of proteins and RNA constitute an important aspect of cellular function and information transfer. In proteins, the kinetics of these structural transitions, mainly from an unfolded ensemble to a single unique folded state, can be investigated by hydrogen exchange experiments monitored by NMR spectroscopy (1). Such studies have profoundly influenced our understanding of protein-folding pathways. In hydrogen exchange experiments, labile hydrogen atoms become protected against exchange with the bulk solvent during folding. This acquired exchange protection indicates formation of a persistent structure at atomic resolution. Incorporation of structural information derived from exchange experiments into molecular dynamics (MD) simulations (2), including data from methods exhibiting time and atomic resolution together with φ-value analysis (3) derived from mutational work, has provided detailed structural information of intermediates populated during folding.
RNA molecules can adopt a variety of secondary and tertiary conformations (4, 5). In general, the energetic difference between alternate RNA conformations is very small, and the equilibrium distribution is strongly affected through the binding of proteins (6), ions (7), or small metabolites (8–10), or by structural modifications (11). Alternate RNA structures are stabilized by different Watson–Crick base-pairing interactions (12). To date, RNA folding has been investigated by using x-ray footprinting (13), oligonucleotide hybridization, and classical biochemical methods in conjunction with mutational data (14). Although hydrogen exchange rates can be used as reporters of RNA ground-state dynamics and stability (15–17), RNA hydrogen exchange experiments conducted in a pulse–chase manner fail in most cases because of the high intrinsic exchange rates observed even in folded RNA structures.
Here, we report on ligand-induced conformational changes of an RNA at atomic resolution by using real-time NMR methods. We investigated the hypoxanthine-induced folding of the guanine-sensing riboswitch aptamer domain (GSRapt) of the Bacillus subtilis xpt-pbuX operon (18). Riboswitch RNAs have emerged as an important example of macromolecular structural transitions that lead to transcriptional or translational regulation of protein expression induced through the specific binding of a metabolite (reviewed in refs. 19 and 20). Riboswitches are located in the 5′-untranslated region (5′-UTR) of bacterial mRNA and consist of a highly specific metabolite receptor region (aptamer domain) coupled to a 3′-downstream sequence (expression platform). Gene expression is thought to be modulated in response to conformational differences between the ligand-bound and ligand-free conformations of the aptamer domain (21). Crystal structures of the ligand-bound aptamer domains belonging to the class of purine riboswitches (guanine- and adenine-sensing riboswitches) have revealed the presence of complex tertiary structures (22, 23). The heterocyclic ligand in these RNA–ligand complexes is almost completely embedded within the RNA through interactions between the RNA and almost all of the ligand functional groups (24). The guanine-sensing riboswitch binds the ligands guanine (Kd ≈ 5 nM) and hypoxanthine (Kd ≈ 50 nM) (18) with high affinity and specificity. The mode of molecular recognition for both ligands is the same (22, 23). To date, kinetic and thermodynamic studies concerning the ligand-induced structural rearrangement within the aptamer domain of the adenine-sensing riboswitch have revealed a folding event that operates on a slow time course over a period of seconds in the presence of Mg2+ ions (25–27).
We successfully trapped the ligand-free conformation of the riboswitch RNA through the use of a caged ligand. The application of photolabile “caged” compounds, which allows for the fast release of initially blocked functional groups and subsequent detection of the reaction time course, has been used in real-time NMR studies to investigate protein (28, 29) and RNA folding (30). Laser-induced deprotection within the NMR tube by direct coupling of laser optics (28, 30) allows for in situ photochemical release of ligand, thereby resulting in fast initiation and subsequent NMR spectroscopic detection of binding events with residue-specific resolution. After ligand release, three distinct kinetic steps associated with ligand-induced folding of GSRapt could be delineated. Incorporation of time-resolved NMR data into experimentally restrained MD simulations provided insight into the conformational behavior of the RNA structural ensembles involved in each step.
Results
Two-Step Specific Binding of Ligand to GSRapt.
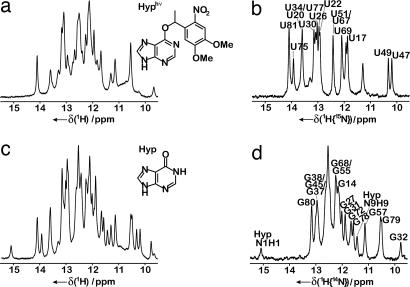
To prevent binding of the small molecule metabolite to GSRapt-RNA, the ligand hypoxanthine was caged [O6-[4,5-dimethoxy-(2-nitrophenyl)ethyl]-hypoxanthine (DMNPE-hypoxanthine)]. (Here, we used the ligand hypoxanthine and its photocaged derivative instead of guanine for solubility reasons.) The photolabile protecting group blocks the Watson–Crick site of the purine ligand known to be essential for ligand recognition and binding to the RNA. Based on the imino proton assignment of GSRapt (31), the 1H-NMR spectrum of the RNA in the presence of DMNPE-hypoxanthine before photolysis indicated that formation of the RNA–ligand complex is completely suppressed. In contrast, in the time series of NMR spectra recorded after laser irradiation, imino proton signals appeared with increasing intensity representing the ligand-bound state after folding of the RNA, whereas signals corresponding to the ligand-free state decreased (Fig. 1 a and c; SI Fig. 6).
Fig. 1.
Imino proton spectra of GSRapt. (a) Unlabeled RNA before laser pulse. (Inset) Chemical structure of DMNPE-hypoxanthine (Hyphυ). (b) [15N]uridine-labeled RNA, uridine residues as a result of 1H{15N}-detection after laser pulse with annotated NMR resonance assignment (31) of resolved residues. (c) Unlabeled RNA after laser pulse. (Inset) Chemical chemical structure of hypoxanthine (Hyp). (d) [15N]uridine-labeled RNA, guanosine residues as a result of 1H{14N}-detection after laser pulse with annotated NMR resonance assignment (31) of resolved residues.
The GSRapt-RNA comprises 73 nucleotides and is at the upper size limit for NMR analysis (32). To obtain site-resolved information by one-dimensional real-time NMR methods, selective isotope labeling of the RNA in combination with NMR filter experiments (33) was used. In addition, the signal-to-noise ratio is optimized by selective excitation of imino spin magnetization under Ernst-angle conditions (34). Alternate 14N/15N-labeling of the imino sites of guanosine or uridine nucleotides of the selectively ([15N]uridine) labeled RNA allowed editing of NMR resonances according to nucleotide type (Fig. 1) (see SI Fig. 7 and SI Text). Thus, the time constants reflecting the kinetics of the ligand-induced conformational changes for a large fraction of individual nucleotides could be analyzed.
In general, NMR detects imino proton signals only if they are protected from exchange with solvent because of the formation of hydrogen bonds. Inaccessibility due to hydrophobic or steric exclusion is rare for RNA. Analysis of the water exchange rates for the imino proton signals of the free RNA and the RNA–ligand complex showed identical values for residues located within persistent secondary structure. Therefore, the kinetics induced by ligand binding exclusively reflect structural changes between ligand-free and ligand-bound conformations (see SI Fig. 8 and SI Text for experimental details).
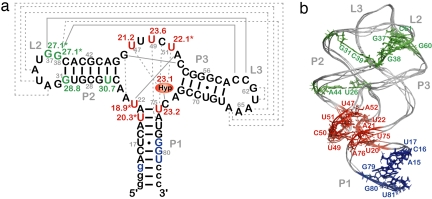
The site-specific half-lives [t1/2 (s)] for individual signal intensities fell into two different time regimes. Analysis of the kinetic data associated with the ligand-bound RNA structure (22) showed that the observed rates can be related to residues that cluster around two distinct structural elements in the riboswitch RNA (Fig. 2). A faster time course with t1/2 in the range 18.9–23.6 s is observed for residues that are directly involved in formation of the ligand-binding pocket (Figs. 2 and 3; SI Fig. 9). These include nucleotides U51, U47, and U22 with t1/2 values of 22.1 ± 1.4 s, 21.2 ± 1.9 s, and 18.9 ± 1.3 s, respectively, that form direct hydrogen bonds with the ligand. In addition, the binding pocket also comprises several base triples flanking the base quadruple formed by hypoxanthine with residues involved in direct hydrogen bonds. The imino proton signals U75, U20, and U49 of the two base triples situated below (base triple A21 U75·C50 and base triple U20
 A76·U49) showed t1/2 values of 23.1 ± 2.7 s, 20.3 ± 2.1 s, and 23.5 ± 1.9 s, respectively. Above the ligand-including base quadruple, a water-mediated base triple is formed (U22
 A52·A73) and another base triple with residues A23·G46
 C53 completes the binding pocket. The NMR resonances of residues U20, U22, and U51 were not resolved from those of residues U34, U77, and U67, respectively. However, faster kinetics of nucleotides in the core region dominated the kinetic behavior of signals U34, U77, or U67 that are all part of the loops or helices of the RNA. As for the ligand hypoxanthine, the half-life measured for the N9-bound proton signal H9 was 23.1 ± 3.9 s, whereas that of the N1-bound proton signal H1 could not be determined because of an insufficient signal-to-noise ratio. Hence, the ligand revealed kinetics similar to the RNA signals of the core segment involved in its recognition.
Fig. 2.
Secondary (a) and tertiary (b) structure of GSRapt with kinetic results. Red, half-life values [t1/2 (s)] in the time range 18.9–23.6 s; green, half-life values in the time range 27.1–30.7 s; blue, signals that remain unaffected during the structural transition; asterisk, overlaid signal (for further information, see text); Hyp, hypoxanthine; labeling of helices P1, P2, and P3 and loop regions L2 and L3, according to Breaker et al. (18); gray solid lines, Watson–Crick base-pairing interactions; gray dashed lines, noncanonical base-pairing interactions [for construct details, see supporting information (SI) Fig. 5].
Fig. 3.
Representation of individual signals during time course of reaction. (a–c) Normalized integrals of imino proton signals: (a) red, core region signal U51/U67; (b) green, loop region signal G37/G38/G45; (c) blue, signal U81 that is part of helix P1 as a function of time with monoexponential fit (for signals U51/U67 and G37/G38/G45) and linear fit (for signal U81) (solid line); (d) stack plot of a series of 1H{15N}-NMR spectra as a function of time (imino proton subsection, 12.2–13.4 ppm).
In contrast, a slower process in the time range of 27.1–30.7 s was observed for nucleotides in helices P2 and P3 and in the loop–loop region (L2 and L3) of the RNA (see SI Fig. 9). The loop–loop interaction is characterized by two base quadruples formed by residues in L2 and L3, respectively (G38 C60 and A33·A66, and G37
 C61 and U34·A65) (22, 23). Analysis of time-resolved NMR data for G38 and G37 (overlapped signal of G37/G38/G45, but all residues being located in the loop or helical region) revealed a t1/2 value of 27.1 ± 2.3 s, and U34 could not be analyzed because of signal overlap. In addition, residue G31, which forms part of the loop L2 closing base pair, and nucleotide U26, which forms part of helix P2, showed slow half-lives with t1/2 values of 28.8 ± 4.8 s and 30.6 ± 3.0 s, respectively.
For a number of RNA imino proton resonances, no chemical shift changes in the ligand-free and ligand-bound forms were observed. This related to residues G79, G80, U81, and G14 of the lower part of helix P1, suggesting that the structure surrounding this helix remains constant during the ligand-induced structural transitions (Fig. 3c).
A Low-Affinity Ligand-Binding Event Precedes the Folding Toward the Ligand-Bound Structure.
Given the slow time scale associated with specific ligand binding to the riboswitch RNA, we considered whether low-affinity binding events preceded specific binding and subsequent folding toward the ligand-bound structure. To this end, useful information can be obtained from the analysis of NMR line widths. The line widths of the nonexchangeable 13C-bound proton signals H2 and H8 of the (isotope-labeled) ligand were recorded for hypoxanthine free in solution and hypoxanthine tightly bound to the GSRapt in the RNA–ligand complex. In addition, the line widths of the same hydrogens were determined for hypoxanthine in the presence of the adenine-sensing riboswitch aptamer domain (ASRapt) of B. subtilis pbuE-mRNA. The ASRapt is similar to GSRapt, both in sequence and tertiary structure (19, 31). However, ASRapt contains a U residue at position 74, but the same position is occupied by a C residue in GSRapt. This single mutation is thought to account for the recognition of adenine by ASRapt through formation of an intermolecular Watson–Crick base pair. ASRapt, however, showed significantly reduced affinity for the purine base hypoxanthine (Kd > 300 μM) (35).
The line width of free hypoxanthine was found to be 7.5 ± 1.0 Hz and increased to 31.5 ± 0.6 Hz in the presence of GSRapt, as expected for a tight RNA–ligand complex in slow exchange. Remarkably, in the presence of ASRapt, no chemical shift changes were found, but line broadening was observed for the hypoxanthine proton signals. The observed line width was between the values monitored for the free ligand and for hypoxanthine complexed with GSRapt (Table 1). The line width of 11.5 ± 0.5 Hz for hypoxanthine in the presence of ASRapt indicates low-affinity binding, consistent with millisecond off-rates due to exchange between the ligand-free and ligand-bound forms that is fast on the NMR time scale (Fig. 4).
Table 1.
Summary of line width values obtained for 13C,15N-labeled ligands in the presence of various RNA constructs
| RNA | Secondary structure | Ligand (13C,15N-labeled) | Mg2+, mM | Characteristics | Δσ, Hz | Line width ligand, Hz |
|---|---|---|---|---|---|---|
| No RNA | Hypoxanthine | 0.11 | 7.5 ± 1.0 | |||
| GSRapt |  |
Hypoxanthine | Specific hypoxanthine binding | 0.13 | 31.5 ± 0.6 | |
| GSRapt | 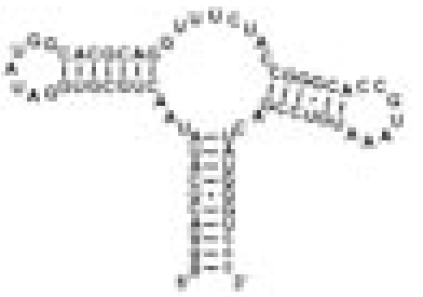 |
Hypoxanthine | 5 | Specific hypoxanthine binding | 0.12 | 30.5 ± 0.4 |
| ASRapt | 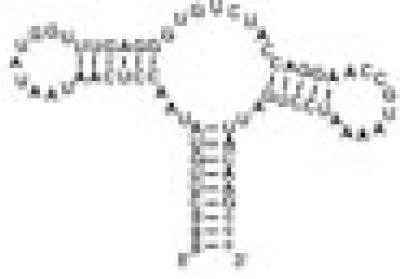 |
Hypoxanthine | No binding of hypoxanthine | 0.06 | 11.5 ± 0.5 | |
| Helix P2&P3 RNA | 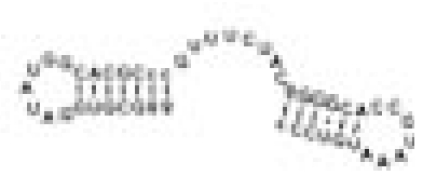 |
Hypoxanthine | No binding of hypoxanthine | 0.20 | 9.6 ± 1.3 | |
| No RNA | Adenine | 0.16 | 7.8 ± 0.1 | |||
| ASRapt | 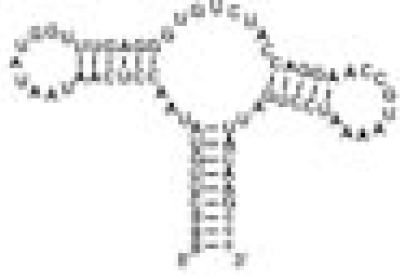 |
Adenine | 5 | Specific adenine binding | 0.04 | 27.8 ± 0.4 |
| GSRapt | 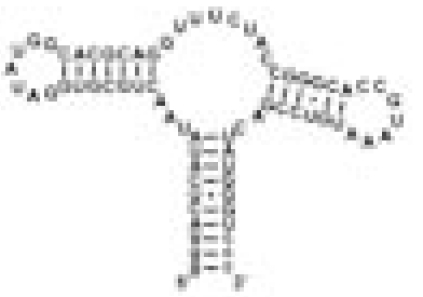 |
Adenine | No binding of adenine | 0.03 | 12.1 ± 0.1 | |
| Helix P2&P3 RNA | 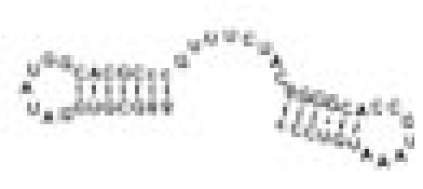 |
Adenine | No binding of adenine | 0.07 | 10.3 ± 0.6 |
The RNA constructs include the guanine riboswitch aptamer domain (GSRapt), the adenine riboswitch aptamer domain (ASRapt), and an RNA construct (helix P2&P3 RNA), which consists of the structural elements helices P2 and P3 and loops L2 and L3 but lacks the ligand binding site of the purine riboswitches (see SI Fig. 5 for details) (Δσ, deviation of individual DSS reference signal from mean DSS line width value; line width ligand, mean line width value of two signals H2 and H8 of the respective ligand).
Fig. 4.
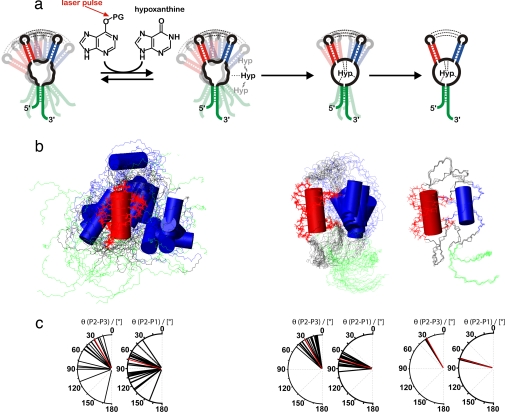
Structural interpretation of the conformational transition. (a) Schematic illustration of the proposed folding model of GSRapt-RNA on ligand binding based on the experimentally restrained torsion angle MD simulations. The first step is low-affinity binding, the second step is the ligand-binding process, and the third step is helical tightening. (b) Overlaid structures of the three states simulated according to our NMR data, aligned on helix P2 (red). Helices P3 and P1 are blue and green, respectively. (Left) The free form of GSRapt, where only the loop–loop interaction and the canonical form of the three helices are restrained. (Center) The transition state-like form where the core is folded toward the native conformation. (Right) The native structure. (c) Distribution of helix–helix projection angles [°] between helices P2/P3 and P2/P1 as seen in the crystal structure (22) (red) and in the structural ensembles depicted in Fig. 4b (black).
The same experiments with the purine base adenine showed an identical line-broadening effect for the ligand signals in the presence of the GSRapt. In contrast, the line widths of both ligands, hypoxanthine and adenine, in the presence of an RNA construct that lacks the binding site but exhibits the structural elements helices P2 and P3, and loop regions L2 and L3 were only 9.6 ± 1.3 Hz and 10.3 ± 0.6 Hz, respectively (Table 1). Thus, the assumption of a low-affinity interaction with the ligand binding site in the purine riboswitch RNAs is confirmed and a general transient binding to random RNA can be neglected.
Translation of Kinetic Rates into Structural Information.
We previously showed that in the free form of the riboswitch RNA helices P1, P2, and P3 are preformed and adopt a canonical A-form helix conformation. The core region of GSRapt is, in essence, unstructured in the absence of ligand. In contrast, the loop–loop interactions between L2 and L3 (Fig. 2) are present in the ligand-free state (31). However, small chemical shift changes of the nucleotides that form the loops indicate variations in the vicinity of this structural element on ligand binding. Our kinetic results here indicate that on ligand binding, the GSRapt folds in a three-state process, in which fast low-affinity binding precedes productive binding of the ligand to the core region of the aptamer domain, followed by a slower process that involves tightening of the tertiary structure involving nucleotides in helices P2 and P3 and the loop–loop regions L2 and L3.
To translate the kinetic rates into structural information, we used our experimental NMR data as restraints in MD simulations akin to strategies used in the protein folding field. We calculated three different structural ensembles in restrained MD simulations based on the clustering of kinetic rates around distinct regions of the aptamer domain (Fig. 2). If an NMR imino proton signal identified by its native chemical shift could be detected, it is reasonable to assume that persistent native hydrogen bonding has been formed. Therefore, the restrained MD simulations starting from a completely randomized RNA chain incorporated native hydrogen-bonding patterns (Fig. 4) when detectable. For the ensemble of structures representing the free form of the RNA, residues identified by NMR to be involved in tertiary interactions were restrained (see SI Fig. 9 and SI Table 2) and regarded as being similar to the interactions determined from the x-ray structure of the ligand-bound complex (22). For the second ensemble, additional restraints were included that represent the native distances for residues that showed faster folding kinetics (nucleotides U22, U47, U49, U51, and all residues that are in close proximity to hypoxanthine in the folded form). In generating the third ensemble, all residues were restrained to adopt their native conformation consistent with the NMR data and the results of the kinetic experiments. An ensemble exhibiting the native structure of the RNA–ligand complex was thus obtained.
The experimentally restrained molecular dynamics revealed that, during ligand-induced folding, the relative orientation of the helices becomes defined in a two-stage process. The loop–loop interaction in the free form of the RNA is not sufficient to stabilize the entire fold. Therefore, the free form of GSRapt needs to be described as a broad structural ensemble with undetermined relative orientation of the helices resulting in a wide conformational distribution. Although the base-pairing interaction in the loop–loop region is preformed in the ligand-free state, these interactions are not sufficient to completely lock the position of the helices in a defined orientation, because nucleotides in L2 and L3 that do not contribute to direct contacts between the loops allow for sampling of a wide conformational space. This observation is consistent with increased line widths of imino proton signals in the ligand-free form of the RNA compared with the ligand-bound form (36). The MD simulations suggest that the mean interhelical angle between helix P2 and helix P3 is close to 30.1°, derived from the x-ray structure of the RNA–ligand complex, but fluctuates between 15° and 166° (Fig. 4c). Binding of the ligand to the core region of the RNA tightens the complex and decreases fluctuation of the interhelical angle. However, fluctuations of the relative orientation of the structural elements were observed (helix-helix angles between 10° and 50°). The final compact conformation, similar to the one displayed by the x-ray structure, is formed in the slowest folding step when all residues, including those exhibiting a slow folding rate, are restrained to their native conformation.
Discussion
Here, we show that time-resolved NMR spectroscopy can be used to characterize the folding of a sizable RNA molecule. Use of time-resolved NMR data in combination with MD simulations can provide an atomic model of RNA conformational transitions as demonstrated here for the ligand-induced RNA folding of the aptamer domain of a guanine-sensing riboswitch.
In our approach, the reaction was initiated by exposure of a photolabile caged ligand to light. We used a similar approach to induce refolding in RNA model systems of smaller size in refs. 30 and 37. Furthermore, other cofactors such as metal ions could also be used in a caged form to trigger structural transitions in biomolecular systems (38). Light-induced initiation of structural transition events has the advantage of providing experimentally reproducible and precisely controlled conditions, such that multiple experiments can be coadded as done in refs. 28 and 29 and here. However, the optical density places an upper limit on the concentration of sample that can be used. Currently, we use 0.25 mM caged hypoxanthine with a laser irradiation of 1.5 s, gaining an optimized deprotection yield of 80%. The experimental conditions described here result in the fast release of ligand in adequate concentration, providing a suitable signal-to-noise ratio to observe RNA–ligand complex formation in a time-resolved manner. All NMR data obtained postrelease indicate that the final ligand-bound state is consistent with structural data of the RNA–ligand complex (22).
To resolve signals associated with individual nucleotides, application of an RNA isotope-labeling scheme in combination with use of an appropriate NMR methodology was essential in allowing us to resolve 30 of 35 imino proton signals of this sizable RNA–ligand complex. Because of limitations in the signal-to-noise ratio and because some signals are unaffected by ligand binding, we were able to analyze the kinetic rates for 11 of these signals. The observed time constants, in general, are in agreement with the time constants derived from fluorescence techniques (25, 26). The site- and time-resolved NMR methodology presented here can delineate the global folding behavior of the RNA molecule as a sequential model, detailing the different aspects of structure formation involved (Fig. 4). Generating such a model using other NMR techniques, such as those employing relaxation dispersion measurements (39), is unfeasible given the slow time scale of the conformational transition.
We also investigated the initial encounter complex of the ligand and the riboswitch RNA by using the aptamer domain of the adenine-sensing riboswitch (ASRapt) as a model, to which hypoxanthine binds with low affinity. The chemical shift values for hypoxanthine in the presence of ASRapt are identical to the ones found for the free ligand. In addition, the imino proton spectrum of ASRapt shows no changes compared with the one of the ligand-free conformation of the RNA. Hence, the NMR data support the reported lack of specificity of the adenine-sensing riboswitch for the ligand hypoxanthine. However, the NMR resonances of hypoxanthine in this complex are broadened consistent with a model in which hypoxanthine weakly interacts with the RNA target. Additional experiments with an RNA construct that lacks the part of the ligand binding region known to be crucial for specific recognition of the ligand (denoted as helix P2&P3 RNA, secondary structure depicted in SI Fig. 5) confirm the assumption of a weak and transient interaction of the ligand with the nucleotides present in the core region of the ligand-free state of the purine riboswitch RNAs. However, ligand binding and the subsequent structural rearrangement is productive exclusively in the case of the specific ligand.
With respect to RNA folding, we describe here a general method to translate kinetic information into a structural description of the folding process. The appearance of an imino proton signal in the NMR spectrum shows that (i) the specific nucleotide acquires exchange protection, and (ii) it is locked into its native hydrogen-bonding interaction. This hydrogen-bonding interaction is often long-range in nature, and has been exploited here to use the kinetic information as a structural restraint in a restrained MD simulation.
After an initial low-affinity complex encounter, a two-step specific binding of the ligand to GSRapt could be resolved. In a faster process, the ligand binding pocket is formed that results in local stabilization of the three-way junction that anchors the two helical stems. Based on the MD simulations, this local stabilization in turn facilitates subsequent long-range stabilization of the loop-loop interactions. The emerging picture is consistent with a kinetic folding mechanism in which formation of the ligand binding core is presumably enthalpically driven, enabling the final folding step, which relies on tightening of the helix-helix orientation. Our NMR data provide a hypothesis that can be tested with additional experimental data such as the data concerning the folding characteristics of mutant riboswitch RNAs.
Materials and Methods
RNA Preparation.
RNA constructs of GSRapt of the B. subtilis xpt-pbuX operon and the ASRapt of B. subtilis pbuE-mRNA (for details, see SI Fig. 5) were synthesized by in vitro transcription and purified as described by Noeske et al. (36). The unlabeled helix P2&P3 RNA construct was purchased from Dharmacon (Boulder, CO). Unlabeled rNTPs and 15N-labeled rNTPs were purchased from Sigma–Aldrich (Munich, Germany) and Silantes (Munich, Germany), respectively. To use RNA for NMR studies, the RNA was exchanged into NMR buffer (25 mM potassium phosphate, pH ≈ 6.2/50 mM potassium chloride).
Time-Resolved NMR Experiments.
The NMR experiments were performed on an AV800MHz spectrometer (Bruker, Rheinstetten, Germany) with a 5-mm z-axis gradient TXI-HCN cryogenic probe at 283 K. The NMR data were analyzed by using the software TOPSPIN 1.3, felix2000 (Accelrys, San Diego, CA) and SigmaPlot 9.0. All NMR spectra were recorded in H2O/D2O (9:1) by using standard pulse sequences with WATERGATE water suppression (40) or jump-return-echo pulse sequences (41). Light-induced reaction initiation was achieved by using a laser installation (28, 30) with direct coupling of a quartz fiber from a CW argon ion laser (Spectra-Physics, Darmstadt, Germany) into the NMR tube equipped with a quartz tip insert. Kinetic experiments were arranged as follows. The first 128 data points (eight scans, each point with an interval of 2.1 s) were recorded in the dark. The release of hypoxanthine was then induced by a laser irradiation of 1.5 s (350 nm, 4 W) followed by another 128 data points. After processing by Fourier transformation in F3, including exponential multiplication with a line-broadening factor of 20 Hz, phase correction, and baseline correction in F3, three to five spectra, which were recorded under identical conditions with 256 1D spectra, respectively, were summed to improve the signal-to-noise ratio of the kinetic studies (for further details, see SI Table 3 and SI Text).
Determination of Line Widths.
NMR experiments were performed on a Bruker DRX600MHz spectrometer with a 5-mm z-axis gradient TXI-HCN probe. 1H,13C-HSQC spectra with 13C- and 15N-decoupling during acquisition were recorded in H2O/D2O (9:1) at 283 K with 2,2-dimethyl-2-silapentane-5-sulfonate as an internal standard. In all experiments, a ligand-to-RNA ratio of 1:5 was used. The line widths of signals H2 and H8 of the ligand were extracted from the appropriately zero-filled 2D spectra and analyzed by deconvolution using TOPSPIN 1.3.
MD Simulation.
To simulate the free state of GSRapt, we considered that helices P1, P2, and P3 are present and adopt a regular A-form helix based on the NMR data. Pseudodistance restraints for C–C distances up to 8 Å were used as input. Additionally, the same kind of restraints were used for the two base quadruples of the loop–loop interaction obtained from the crystal structure. The backbone torsions were loosely constrained (±60°) to values found for the deposited structural data. An ensemble of 100 structures was calculated with a simulated annealing protocol and the 20 lowest energy structures were analyzed. The protocol consisted of the following simulation steps: TAD-MD (torsion angle dynamics-molecular dynamics) with (i) a high-temperature phase starting at Tmax = 20,000, with 4,000 steps and time steps of 0.01 ps; (ii) a first slow cool annealing stage starting at Tmax = 20,000 with 20,000 steps of 0.01 ps; (iii) a second slow cool annealing stage starting from Tmax = 2,000 with 3,000 steps of 0.005 ps; and (iv) a subsequent minimization of eight cycles each with 1,000 minimization steps. A completely randomized RNA chain was used as the starting structure. Calculations were performed with CNX2005 from Accelrys (San Diego, CA). (Restraints are summarized in SI Table 2.)
Supplementary Material
Acknowledgments
We thank Elke Stirnal and Dr. Christian Richter for excellent technical assistance. This work was supported by the Deutsche Forschungsgemeinschaft (SFB 579: “RNA–ligand-Interaction”), a Studienstiftung des Deutschen Volkes predoctoral fellowship (to B.F.), the Fonds der Chemischen Industrie predoctoral fellowship (to J.N.), and general support to H.S., and the state of Hesse [Center for Biomolecular Magnetic Resonance (BMRZ)].
Abbreviations
- DMNPE-hypoxanthine
O6-[4,5-dimethoxy-(2-nitrophenyl)ethyl]-hypoxanthine
- MD
molecular dynamics
- ASRapt
adenine-sensing riboswitch aptamer domain
- GSRapt
guanine-sensing riboswitch aptamer domain.
Footnotes
The authors declare no conflict of interest.
This article is a PNAS Direct Submission.
This article contains supporting information online at www.pnas.org/cgi/content/full/0703182104/DC1.
References
- 1.Radford SE, Dobson CM, Evans PA. Nature. 1992;358:302–307. doi: 10.1038/358302a0. [DOI] [PubMed] [Google Scholar]
- 2.Vendruscolo M, Paci E, Dobson CM, Karplus M. Nature. 2001;409:641–645. doi: 10.1038/35054591. [DOI] [PubMed] [Google Scholar]
- 3.Salvatella X, Dobson CM, Fersht AR, Vendruscolo M. Proc Natl Acad Sci USA. 2005;102:12389–12394. doi: 10.1073/pnas.0408226102. [DOI] [PMC free article] [PubMed] [Google Scholar]
- 4.Wyatt JR, Puglisi JD, Tinoco I., Jr BioEssays. 1989;11:100–106. doi: 10.1002/bies.950110406. [DOI] [PubMed] [Google Scholar]
- 5.Schroeder R, Barta A, Semrad K. Nat Rev Mol Cell Biol. 2004;5:908–919. doi: 10.1038/nrm1497. [DOI] [PubMed] [Google Scholar]
- 6.Williamson JR. Nat Struct Biol. 2000;7:834–837. doi: 10.1038/79575. [DOI] [PubMed] [Google Scholar]
- 7.Draper DE, Grilley D, Soto AM. Annu Rev Biophys Biomol Struct. 2005;34:221–243. doi: 10.1146/annurev.biophys.34.040204.144511. [DOI] [PubMed] [Google Scholar]
- 8.Miranda-Rios J, Navarro M, Soberon M. Proc Natl Acad Sci USA. 2001;98:9736–9741. doi: 10.1073/pnas.161168098. [DOI] [PMC free article] [PubMed] [Google Scholar]
- 9.Winkler W, Nahvi A, Breaker RR. Nature. 2002;419:952–956. doi: 10.1038/nature01145. [DOI] [PubMed] [Google Scholar]
- 10.Epshtein V, Mironov AS, Nudler E. Proc Natl Acad Sci USA. 2003;100:5052–5056. doi: 10.1073/pnas.0531307100. [DOI] [PMC free article] [PubMed] [Google Scholar]
- 11.Helm M. Nucleic Acids Res. 2006;34:721–733. doi: 10.1093/nar/gkj471. [DOI] [PMC free article] [PubMed] [Google Scholar]
- 12.Lodmell JS, Dahlberg AE. Science. 1997;277:1262–1267. doi: 10.1126/science.277.5330.1262. [DOI] [PubMed] [Google Scholar]
- 13.Sclavi B, Woodson S, Sullivan M, Chance MR, Brenowitz M. J Mol Biol. 1997;266:144–159. doi: 10.1006/jmbi.1996.0775. [DOI] [PubMed] [Google Scholar]
- 14.Treiber DK, Rook MS, Zarrinkar PP, Williamson JR. Science. 1998;279:1943–1946. doi: 10.1126/science.279.5358.1943. [DOI] [PubMed] [Google Scholar]
- 15.Gueron M, Kochoyan M, Leroy JL. Nature. 1987;328:89–92. doi: 10.1038/328089a0. [DOI] [PubMed] [Google Scholar]
- 16.Hud NV, Schultze P, Sklenar V, Feigon J. J Mol Biol. 1999;285:233–243. doi: 10.1006/jmbi.1998.2327. [DOI] [PubMed] [Google Scholar]
- 17.Pardi A, Tinoco I., Jr Biochemistry. 1982;21:4686–4693. doi: 10.1021/bi00262a026. [DOI] [PubMed] [Google Scholar]
- 18.Mandal M, Boese B, Barrick JE, Winkler WC, Breaker RR. Cell. 2003;113:577–586. doi: 10.1016/s0092-8674(03)00391-x. [DOI] [PubMed] [Google Scholar]
- 19.Mandal M, Breaker RR. Nat Rev Mol Cell Biol. 2004;5:451–463. doi: 10.1038/nrm1403. [DOI] [PubMed] [Google Scholar]
- 20.Winkler WC, Breaker RR. Annu Rev Microbiol. 2005;59:487–517. doi: 10.1146/annurev.micro.59.030804.121336. [DOI] [PubMed] [Google Scholar]
- 21.Nudler E, Mironov AS. Trends Biochem Sci. 2004;29:11–17. doi: 10.1016/j.tibs.2003.11.004. [DOI] [PubMed] [Google Scholar]
- 22.Batey RT, Gilbert SD, Montange RK. Nature. 2004;432:411–415. doi: 10.1038/nature03037. [DOI] [PubMed] [Google Scholar]
- 23.Serganov A, Yuan YR, Pikovskaya O, Polonskaia A, Malinina L, Phan AT, Hobartner C, Micura R, Breaker RR, Patel DJ. Chem Biol. 2004;11:1729–1741. doi: 10.1016/j.chembiol.2004.11.018. [DOI] [PMC free article] [PubMed] [Google Scholar]
- 24.Schwalbe H, Buck J, Fürtig B, Noeske J, Wöhnert J. Angew Chem Int Ed Engl. 2007;46:1212–1219. doi: 10.1002/anie.200604163. [DOI] [PubMed] [Google Scholar]
- 25.Gilbert SD, Stoddard CD, Wise SJ, Batey RT. J Mol Biol. 2006;359:754–768. doi: 10.1016/j.jmb.2006.04.003. [DOI] [PubMed] [Google Scholar]
- 26.Wickiser JK, Cheah MT, Breaker RR, Crothers DM. Biochemistry. 2005;44:13404–13414. doi: 10.1021/bi051008u. [DOI] [PubMed] [Google Scholar]
- 27.Lemay JF, Penedo JC, Tremblay R, Lilley DM, Lafontaine DA. Chem Biol. 2006;13:857–868. doi: 10.1016/j.chembiol.2006.06.010. [DOI] [PubMed] [Google Scholar]
- 28.Kühn T, Schwalbe H. J Am Chem Soc. 2000;122:6169–6174. [Google Scholar]
- 29.Wirmer J, Kühn T, Schwalbe H. Angew Chem. 2001;113:4378–4381. doi: 10.1002/1521-3773(20011119)40:22<4248::AID-ANIE4248>3.0.CO;2-I. [DOI] [PubMed] [Google Scholar]
- 30.Wenter P, Fürtig B, Hainard A, Schwalbe H, Pitsch S. Angew Chem Int Ed Engl. 2005;44:2600–2603. doi: 10.1002/anie.200462724. [DOI] [PubMed] [Google Scholar]
- 31.Noeske J, Buck J, Fürtig B, Nasiri HR, Schwalbe H, Wöhnert J. Nucleic Acids Res. 2007;35:572–583. doi: 10.1093/nar/gkl1094. [DOI] [PMC free article] [PubMed] [Google Scholar]
- 32.Fürtig B, Richter C, Wöhnert J, Schwalbe H. ChemBioChem. 2003;4:936–962. doi: 10.1002/cbic.200300700. [DOI] [PubMed] [Google Scholar]
- 33.Otting G, Wüthrich K. J Magn Reson. 1989;85:586–594. [Google Scholar]
- 34.Ernst RR, Bodenhausen G, Wokaun A. Principles of Nuclear Magnetic Resonance in One and Two Dimensions. New York: Oxford Univ Press; 1994. [Google Scholar]
- 35.Mandal M, Breaker RR. Nat Struct Mol Biol. 2004;11:29–35. doi: 10.1038/nsmb710. [DOI] [PubMed] [Google Scholar]
- 36.Noeske J, Richter C, Grundl MA, Nasiri HR, Schwalbe H, Wöhnert J. Proc Natl Acad Sci USA. 2005;102:1372–1377. doi: 10.1073/pnas.0406347102. [DOI] [PMC free article] [PubMed] [Google Scholar]
- 37.Wenter P, Fürtig B, Hainard A, Schwalbe H, Pitsch S. ChemBioChem. 2006;7:417–420. doi: 10.1002/cbic.200500468. [DOI] [PubMed] [Google Scholar]
- 38.Fürtig B, Buck J, Manoharan V, Bermel W, Jäschke A, Wenter P, Pitsch S, Schwalbe H. Biopolymers. 2007;86:360–383. doi: 10.1002/bip.20761. [DOI] [PubMed] [Google Scholar]
- 39.Korzhnev DM, Salvatella X, Vendruscolo M, Di Nardo AA, Davidson AR, Dobson CM, Kay LE. Nature. 2004;430:586–590. doi: 10.1038/nature02655. [DOI] [PubMed] [Google Scholar]
- 40.Liu M, Mao X, Ye C, Huang H, Nicholson JK, Lindon JC. J Magn Reson. 1998;132:125–129. doi: 10.1006/jmre.1997.1246. [DOI] [PubMed] [Google Scholar]
- 41.Sklenar V, Bax A. J Magn Reson. 1987;75:378–383. [Google Scholar]
Associated Data
This section collects any data citations, data availability statements, or supplementary materials included in this article.


