

Abstract
Hypocretin (Hcrt, also known as orexin) is a hypothalamic neuropeptide linked to narcolepsy, a disorder diagnosed by the appearance of rapid eye-movement sleep (REMS)-state characteristics during waking. Major targets of Hcrt-containing fibers include the locus coeruleus and the raphe nucleus, areas with important roles in regulation of mood and sleep. A relationship between REMS and mood is suggested by studies demonstrating that REMS-deprivation (REMSD) ameliorates depressive symptoms in humans. Additional support is found in animal studies where antidepressants and REMSD have similar effects on monoamiergic systems thought to be involved in major depression. Recently, we have reported that Wistar-Kyoto (WKY) rats, an animal model of depression, have reduced number and size of hypothalamic cells expressing Hcrt-immunoractivity compared to the parent, Wistar (WIS) strain, suggesting the possibility that the depressive-like attributes of the WKY rat may be determined by this relative reduction in Hcrt cells [Allard, J.S., Tizabi, Y., Shaffery, J.P., Trouth, C.O., Manaye, K., 2004. Stereological analysis of the hypothalamic hypocretin/orexin neurons in an animal model of depression. Neuropeptides 38, 311–315]. In this study, we sought to test the hypothesis that REMSD would result in a greater increase in the number and/or size of hypothalamic, Hcrt-immunoreactive (Hcrt-ir) neurons in WKY, compared to WIS rats. The effect of REMSD, using the multiple-small-platforms-over-water (SPRD) method, on size and number of Hcrt-ir cells were compared within and across strains of rats that experienced multiple-large-platforms-over-water (LPC) as well as to those in a normal, home-cage-control (CC) setting. In accord with previous findings, the number of Hcrt-ir cells was larger in all three WIS groups compared to the respective WKY groups. REMSD produced a 20% increase (p < 0.02) in the number of hypothalamic Hcrt-ir neurons in WKY rats compared to cage control WKY (WKY-CC) animals. However, an unexpected higher increase in number of Hcrt-ir cells was also observed in the WKY-LPC group compared to both WKY-CC (31%, p < 0.001) and WKY-SPRD (20%, p < 0.002) rats. A similar, smaller, but non-significant, pattern of change was noted in WIS-LPC group. Overall the data indicate a differential response to environmental manipulations where WKY rats appear to be more reactive than WIS rats. Moreover, the findings do not support direct antidepressant-like activity for REMSD on hypothalamic Hcrt neurons in WKY rats.
Keywords: Hypocretin, Orexin, Depression, Rapid eye movement, Sleep deprivation, Stereology, WKY rats
1. Introduction
Diminished numbers of hypocretin (Hcrt, also known as orexin) producing cells and reduced cerebrospinal fluid levels of Hcrt have been linked to the pathophysiology of narcolepsy (Nishino et al., 2000b; Taheri et al., 2002; Thannickal et al., 2000), a disorder of rapid eye-movement sleep (REMS) regulation (John et al., 2004). A role for Hcrt in sleep pathology (Grivel et al., 2005; Mignot, 2001; Nishino et al., 2000b; Nishino et al., 2000a; Taheri et al., 2002; Yoshida et al., 2001) and REMS regulation (Bourgin et al., 2000; Nunez et al., 2006) is supported by a number of studies, including that of Espana et al. who found that infusions of hypocretin into the lateral ventricles elicited a short latency increase in indices of waking, as well as decreases in slow-wave sleep (SWS) and REMS (Espana et al., 2001).
Neurons containing Hcrt are localized mainly in the lateral, posterior, and, perifornical nuclei of the hypothalamus (de Lecea et al., 1998; Peyron et al., 1998; Sakurai et al., 1998). Recent studies implicate Hcrt in memory and learning (Smith and Pang, 2005) as well as reward-seeking (Harris et al., 2005) [for reviews also see (Burdakov and Alexopoulos, 2005; de Lecea and Sutcliffe, 2005; Sutcliffe and de Lecea, 2000)]. In addition, Hcrt-projections are found in brain areas that participate in energy homeostasis, food intake, temperature regulation, motor control, as well as sleep and wakefulness (Daté et al., 1999; Fung et al., 2001; Nambu et al., 1999; Peyron et al., 1998; Prober et al., 2006; van den Pol, 1999). Particularly dense innervations from hypocretinergic cells are found in areas involved in the regulation of the rapid eye movement sleep (REMS)/non-REMS ultradian rhythm (Kilduff and Peyron, 2000; Sutcliffe and de Lecea, 2000). Hcrt neurons are more active in wake than sleep, but the highest levels of activity are associated with exploratory behavior (Lee et al., 2005; Mileykovskiy et al., 2005). Previous studies have demonstrated increases in Hcrt expression and neuronal activity after forced activity, total sleep deprivation and after several days of REMS-deprivation (Estabrooke et al., 2001; Grivel et al., 2005; Martins et al., 2004; Modirrousta et al., 2005; Pedrazzoli et al., 2004; Yoshida et al., 2001). Moreover, Hcrt has been reported to have excitatory effects on many of the sleep-related areas including the locus coeruleus (LC) (Bourgin et al., 2000; Hagan et al., 1999; Horvath et al., 1999) and the dorsal raphe nucleus (DRN) (Brown et al., 2002; Liu et al., 2002). These two nuclei are heavily innervated by Hcrt fibers, and are not only implicated in REM sleep regulation, but are also areas linked to major depression (Anand and Charney, 2000; Coppen, 1967; Graeff, 1993; Harro and Oreland, 2001; Kahn et al., 1988). Recent evidence has implicated Hcrt in the hypothalamic response to stress (Ida et al., 2000; Kuru et al., 2000; Winsky-Sommerer et al., 2004), itself, a significant factor in precipitating depression (Duman, 2004; Leonard, 2001; Plotsky et al., 1998; Shaffery et al., 2003). Another study in rats suggested that increased Hcrt tone during REMS-deprivation may contribute to the positive effects of REMS-suppression on depressive symptoms (Pedrazzoli et al., 2004). Together with the data that circadian variation of Hcrt in cerebrospinal fluid (CSF) of depressed patients is significantly dampened (Salomon et al., 2003), these findings suggest a role for Hcrt in mood regulation.
Sleep laboratories have consistently demonstrated that there are alterations in sleep continuity and sleep architecture in patients suffering from major depressive disorder (Benca, 2005; Riemann et al., 2001). For example, the sleep-wake cycle of depressed patients is often characterized by a shortened latency to the first REM sleep episode and an increase in REMS amount and frequency during the first part of the night (Kupfer et al., 1992). Moreover, REMS-deprivation (REMSD) appears to have at least short-term therapeutic-value in depressive disorders (Vogel et al., 1990; Vogel et al., 1975; Vogel et al., 1980) [for reviews see, (Wirz-Justice and Van den Hoofdakker, 1999; Wu and Bunney, 1990)]. Additional support is found in data from animals where sleep deprivation (Gardner et al., 1997) and in particular REMSD (Basheer et al., 1998; Maudhuit et al., 1996; Mogilnicka et al., 1986; Pedrazzoli and Benedito, 2004) has been shown to have anitidepressant-like effects on several neurotransmitter systems involved in major depression. We have recently reported that Wistar-Kyoto (WKY) rats, a putative animal model of depression, exhibited fewer hypothalamic cells expressing immunoreactivity for Hcrt compared to the parent strain of Wistar (WIS) rats and suggested that the reduced number of Hcrt cells in WKY rats might underlie some of the depressive-like behavioral attributes of this model (Allard et al., 2004). In accord with WKY rats being a suitable model of depression these rats exhibit shortened REMS latencies and increased REMS amounts (Paré, 1989; Paré, 2000). These animals, however, do not otherwise exhibit narcoleptic characteristics. In this study, we sought to test the hypothesis that REMSD would result in a greater increase in the number and/or size of hypothalamic, Hcrt-immunoreactive (Hcrt-ir) neurons in WKY compared to WIS rats.
2. Materials and methods
2.1. Subjects
Male inbred WIS (8–9 weeks old) rats and age-matched male WKY rats were purchased from Harlan Labs (Indianapolis, IN). The animals were allowed a one-week acclimatization period after arrival at the animal facility, prior to experimentation. All protocols were approved by the local Institutional Animal Care and Use Committee.
2.1.1. REM sleep deprivation by multiple platform method
Eighteen rats from each of the WKY and WIS strains were randomly assigned (n = 6 per group) to one of three groups: (1) small-platforms-over-water, REMS deprived (SPRD), (2) large platform control (LPC), and (3) cage control (CC). Thirty six rats were used, although one WKY-CC brain was not available for immunohistochemistry studies.
Rats were REMS-deprived for seven days using the multiple-small-platforms-over-water method (Mendelson et al., 1974; Vogel, 1975). SPRD- and LPC-rats were kept in aquaria (37.9 L) fitted with platforms made from inverted flowerpots that were glued to the bottom of the aquarium and topped with a circular plastic platform. Three small platforms (6.5 cm diameter) were placed in the aquaria that were used for SPRD. Two larger platforms (13.5 cm diameter) were place in the aquaria used for the LPC groups. During the experiment, the aquaria were filled with water up to a level 2 cm below the platforms.
The multiple small platform method of REMS suppression was chosen because effects of platform deprivation are known to be specific for REMS reduction during long-term experiments, such as the one employed here (Mendelson et al., 1974; Vogel, 1975). Additionally, multiple platforms are thought to be less stressful compared to a single platform. While all forms of REMSD may be stressful, the multiple platforms reduce the overall levels compared to single platform designs (Coenen and Van Luijtelaar, 1985; Mendelson et al., 1974). In addition, on several measures, across several species, the stress levels of small and large platform animals are repeatedly reported to be similar (Coenen and Van Luijtelaar, 1985; Kovalzon and Tsibulsky, 1984; Shaffery et al., 1998). The multiple platform technique allows the animals to easily move among the platforms, reducing the potential for immobility-related stress that can be associated with using a single platform (Mendelson et al., 1974; Suchecki et al., 1998; Vogel, 1975).
In the SPRD condition, the three platforms were spaced such that the rats could freely and easily move between platforms, but were not able to lie across any two platforms to adopt a posture suitable for maintaining balance at REMS onset. However, due to the small size of the platform, and the muscle atonia that ensues coincident with REMS onset, the rat must actively prevent itself from coming into contact with the water surrounding the pedestal by awakening itself; and thereby, effectively eliminating all REMS. Daily 1-h observations of the animals during the period immediately after cleaning the aquaria demonstrated that the small, 6.5 cm diameter platform allowed a 180–280 g rat just enough room to remain balanced provided that it maintained muscle tone.
Large platform control (LPC) animals were maintained under similar conditions with the exception that their aquaria were fitted with two platforms that were each large enough to allow essentially undisturbed amounts of all stages of sleep and waking. A final group of age-matched cage control (CC) animals were housed individually in standard, dry cages in the animal housing facilities.
In an effort to further reduce potential environmental stressors associated with the aquaria-REMSD housing conditions, water heaters maintained a water temperature of 31 ± 1 °C, to help prevent hypothermia. Aquaria were cleaned on a daily basis, during which time; rats were placed in standard, dry holding cages and maintained in the wake state.
In all conditions, room temperature was maintained at 22 ± 1 °C, and a 12-h light–dark cycle (lights on at 7:00 am) was enforced. All rats had continuous free access to food and water, however, intake of food and water was not measured. Inasmuch as platform deprivation techniques affect body weight (Hipolide et al., 2006; Rechtschaffen et al., 1983; Youngblood et al., 1999), all animals were weighed on the first and last day of the seven-day experiment. The change in body weight of individual animals over the seven day experiment was expressed as a ratio of the difference from individual final weights in grams minus the weight at the start divided by the starting weight. Weight gain was assessed as a rough indication of the overall health status of the animal.
2.1.2. Perfusion, fixation and sectioning
Immediately following the seventh day of deprivation, rats were deeply anesthetized with sodium pentobarbital (100 mg/kg), perfused transcardially with 0.9% saline followed by 4% paraformaldehyde in 0.1 M phosphate buffer (PB) solution (pH 7.4). The brains were removed, postfixed overnight in 4% paraformaldehyde and cryoprotected in 30% sucrose in 0.1 M PB solution for 3 days, at 4 °C. Serial cryostat (−23 °C) sections were cut in the coronal plane at an instrument setting of 40 μm thickness throughout the entire forebrain length. Tissue sections were placed into antifreeze buffer solution and stored at −20 °C until processed for immunostaining and stereological analysis.
2.1.3. Immunohistochemistry
Every fourth section through the entire rostral-caudal extent of the hypothalamus was processed for hypocretin-1 (Hcrt-1) expression, using diaminobenzidine (DAB) immunohistochemistry. Free floating sections were quenched in 0.3% hydrogen peroxide for 30 minutes at room temperature, washed in 0.3% triton X-100/PBS (3 × 10 min), and then incubated in 5% normal goat serum (NGS) in phosphate buffered saline (PBS). Sections were then incubated in polyclonal rabbit anti-Hcrt-1 primary antibody (1:2000 dilution, Oncogene Research Products, San Diego, CA) overnight for 16–24 h at 4 °C. The following day, sections were washed in 0.3% triton X-100/PBS (3 × 10 min) and exposed to goat anti-rabbit biotinylated IgG antibody (1:400 Vector Laboratories, Burlingame, CA) for 2 h. Following another rinse in 0.3% triton X-100/PBS, sections were incubated for 2 h in avidin-biotin complex. After rinsing in PBS, the sections were exposed to a 0.03% diaminobenzidine (DAB) solution in 0.1 M PB for 20 min. Sections were rinsed, mounted onto Plus slides (Fisher Scientific, Pittsburgh, PA) and allowed to air-dry overnight, then counterstained with methyl green (Vector Laboratories) for increased visualization of labeled neurons and fibers, dehydrated through a graded alcohol series, cleared in xylene and coverslipped with DPX mountant (Sigma–Aldrich).
2.1.4. Stereological analysis
In these experiments, design based stereology (Gundersen et al., 1988; Gundersen and Jensen, 1987) was used to estimate cell-volume and population counts of neurons in the hypothalamus. These studies follow our previously published methods for stereological estimation of cell numbers and sizes in WIS and WKY rats (Allard et al., 2004) and are briefly described here. Hcrt1-immunoreactive (Hcrt1-ir) cells were counted through the entire rostral-to-caudal length of the left hypothalamus for each animal on evenly spaced serial sections (n = 15–18 per animal), every fourth section, starting randomly between the first and fourth sections (as required by the fractionator method). Counting frames and sampling grid sizes were optimized to achieve a mean Gundersen coeffcient of error (CE) ≤ 0.05 (Gundersen and Jensen, 1987). A guard volume of 2.0 μm (depth) was used during cell counting to avoid introduction of errors due to sectioning artifacts, including uneven section surfaces and lost caps (Mouton et al., 2002).
Counting frames and sampling grid sizes were determined such that a minimum of 200 cells was counted in each brain area analyzed. Counting was accomplished using magnification from a 60X objective (1.4 numerical aperture). All data collection was carried out under double blind conditions using the Stereo Investigator software (MicroBrightfield, Inc., Colchester, VT). The system hardware consisted of: X–Y–Z motorized stage; Optronics color video camera interfaced to a Nikon E800 microscope; high-resolution video card; focus measurement encoder which provides .25 μm resolution of absolute microscope stage focus position; computer and monitor.
Hypothalamic areas with hypocretin immunopositive cells were outlined using a 4× objective, and neurons in the left hemisphere of each section were counted using a 60× oil-immersion objective lens (1.4 numerical aperture). The borders of the reference space were defined according to the stereotaxic rat brain atlas of Paxinos and Watson (Paxinos and Watson, 1986). Areas containing hypocretin neurons spanned approximately 1600–2000 μm rostrocaudally. Because hypocretin immunoreactivity was not confined to specific or readily definable hypothalamic nuclei, we quantified all hypothalamic regions containing hypocretin positive neurons in order to avoid arbitrary delineation (see for example, Allard et al., 2004). The specific application of the stereological procedure used to determine cell population counts in these experiments was the optical fractionator probe that systematically samples the region of interest to estimate total population numbers that are too large to count exhaustively (Long et al., 1998; Mouton et al., 2002).
In addition to the optical fractionator probe, the nucleator probe was used to estimate the mean volumes of cells. The nucleator probe is used within the context of the optical fractionator probe to identify the cells to be measured. By identifying where computer generated, randomly placed rays, emanating from the chosen point associated with each cell cross the visually identified soma boundaries of each cell, the nucleator probe estimates volumes of individual cells identified within the counting frames defined by the fractionator probe (Gundersen et al., 1988; Gundersen et al., 1999).
2.1.5. Statistics
Changes in body weight were analyzed with a two factor (strain by treatment), univariate ANOVA (SPSS14, SPSS, Inc.). Findings of significant main effects were followed by one-way ANOVA within and across strains. Post hoc, pairwise differences in change in body weight were tested using Bonferroni corrected t-tests. Group differences in stereologically estimated, total number and average size of hypothalamic Hcrt1-ir cells were assessed for each treatment group with a two-way, (strain by treatment) ANOVA. When between-strain differences were significant, this was followed by analysis of within strain differences with a one-way ANOVA to assess the effects of treatments on numbers and sizes of Hcrt1-ir cells within each strain of rats. Post hoc, pairwise differences were determined among all three treatment groups using Bonferroni corrected t-tests. Significance level was accepted at the p < 0.05 level.
3. Results
Body weight changes
Average final body weight, after the seven-day experiment, as a percentage of the individual average initial body weight is given in Fig. 1. Univariate ANOVA showed significant main effcts for strain (F1,30 = 13.47, p = 0.001) and treatment (F2,30 = 42.21, p < 0.0001) but the interaction was not quite significant (F2,30 = 3.18, p = 0.056). One-way ANOVAs revealed significant differences between treatment groups within each strain of rat (WIS, F2,15 = 8.96, p = 0.003; WKY, F2,15 = 52.41, p < 0.0001). The significant main effect of strain in this analysis indicated that overall the WKY rats gained less weight than the WIS animals (Fig. 1). At just 93% of their initial body weight, the WKY-SPRD rats gained significantly less weight than the WIS-SPRD rats, which increased to 107% of their starting weight (Bonferroni corrected t-test, p < 0.004). Weight gain in the WKY-CC (124%) group was not significantly greater than that in the WIS-CC group (120%), nor was there a weight gain difference between the WIS- and WKY-LPC groups (116% and 113%, respectively).
Fig. 1.

Mean (±SEM) values for body weight changes after 7 days (n = 6 in each treatment group). Final body weight is expressed as a percentage of the individual weights at the start of the experiment. SPRD, small platform rapid eye movement sleep deprived, LPC, large platform control, CC, dry cage control, WKY, Wistar-Kyoto, WIS, Wistar. Bracketed lines connect significantly different pairs within strains (Bonferroni corrected t-tests). (a) p = 0.002, (b) p = 0.0001.
Within the WKY strain, the SPRD group had the smallest weight compared to both the LPC and CC groups (Bonferroni corrected t-tests, p < 0.0001). The WKY-CC group and the WKY-LPC animals increased to 120% and 113% of their initial weight, respectively and the post hoc t-test trended (p = 0.076) towards a significant weight gain (see Fig. 1). The WKY-SPRD group was the only group to show weight loss at the end of the experiment, maintaining just 93% of their initial body weight.
The WIS rats showed significant differences in weight gain between the SPRD group and the CC group (Bonferroni corrected t-test, p = 0.002). The SPRD animals increased their body weight only to an average of 107% of their initial weight compared to 124% in the CCs. The LPC animals increased their weight to 116% of their starting weight, but this was not statistically different from either the CC or the SPRD rats in this strain.
Stereological estimates of Hcrt1-ir cells in hypothalamus
The estimated total number of Hcrt1-ir cells for each treatment group is shown in Fig. 2. Sample pictures of Hcrt-ir neurons in WKY rats are provided in Fig. 3. (It is important to note that the data was collected across whole sets of slides, 15–18 per animal). A fixed factor (strain by treatment), univariate-ANOVA was highly significant (F6,29 = 565.4, p < 0.0001). Differences existed among all three treatment groups of WKY rats (F2,14 = 28.5, p < 0.0001). WKY-SPRD and WKY-LPC rats showed increases of 20% and 31%, respectively, in Hcrt1-ir cells compared to WKY-CC rats (Bonferroni corrected t-tests, p < 0.002, p < 0.0001, respectively). The 11% increase in WKY-LPC compared to WKY-SPRD was also significant (Bonferroni corrected t-test, p < 0.02). The ANOVA on the WIS groups trended towards showing significant differences between the groups (F2,15 = 3.3, p = 0.064). Most of the variance between the WIS treatment groups rats was accounted for by the 19% increase in the number of Hcrt1-ir cells in the LPC rats compared to CCs, but this difference did not reach significance (Bonferroni corrected t-test, p = 0.074, see Fig. 2). Finally, analysis with independent t-tests demonstrated pair-wise strain differences between treatment groups on numbers of Hcrt1-ir cells (WKY-CC vs WIS-CC, p < 0.005; WKY-LPC vs WIS-LPC, p < 0.0001; WKY-SPRD vs WIS-SPRD, p < 0.01). On average across all groups, WKY rats had 23% fewer Hcrt1-ir neurons than WIS rats.
Fig. 2.
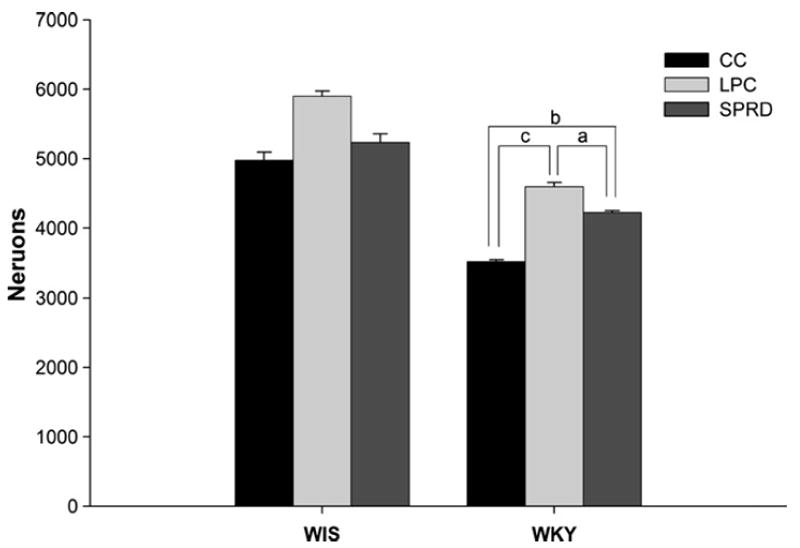
Mean (±SEM) values for average number of Hcrt1-ir neurons in the left hypothalamus of each strain of rats (n = 6 except for WKY-CC where n = 5, see text). Group-naming conventions follow those in Fig. 1. Bracketed lines connect significantly different pairs within strains (Bonferroni corrected t-tests). (a) p = 0.02, (b) p = 0.002, (c) p = 0.001. Pairs of like-treatment groups are significantly different across the two strains of rats (WIS-CC vs WKY-CC, p < 0.005, WIS-LPC vs WKY-LPC, p < 0.0001, WIS-SPRD vs WKY-SPRD, p < 0.01).
Fig. 3.

Coronal sections showing distribution of hypocretin-1 immunoreactive neurons in the hypothalamus. Frames A–C are sections taken from similar levels of the lateral hypothalamus, taken from WKY rats in the three different treatments (A) control, (B) large platform control, (C) REM sleep deprived. Note that the cumulative differences noted between groups derives from data collected across whole set of slides (15–18 per animal). LH, later hypothalamus; f, perifornical nucleus; 3V, third ventricle; opt, optic tract. Scale bar in C applies to all.
The nucleator probe demonstrated that SPRD treatment effects on cell number were not reflected in concomitant cell size changes, as can be seen in Fig. 4. Accordingly, there were no significant main effects for either strain (WKY vs WIS) or treatment group (SPRD, LPC, or CC) with regard to Hcrt1-ir cell sizes.
Fig. 4.

Mean (±SEM) values for volume of Hcrt1-ir neurons in hypothalamus. There were no systematic differences in cell sizes between any of the groups. Group naming conventions follow those in Fig. 1.
4. Discussion
Results of this study, while confirming the differences in hypothalamic Hcrt-ir neuron numbers between WIS and WKY rats (Allard et al., 2004), also indicate that the multiple-pedestal protocol of REM sleep suppression increases the total number of these cells in WKY rats. An unexpected finding was the greater increase (relative to the WKY-SPRD rats) in Hcrt1-ir neurons observed in the WKY-LPC group. A similar, but not statistically significant, increase was also seen in the parent strain, WIS-LPC group. The multiple-pedestal environment increased the total number of hypothalamic cells expressing Hcrt1-ir in both the large and small platform conditions. Inasmuch as the WKY-SPRD group showed a significant reduction in Hcrt1-immunoreactive cells compared to the WKY-LPC animals, it seems reasonable to suggest that one effect of the multiple small pedestals, beyond the simple reduction in REMS, is that it somehow insulated the WKY rats from the effects induced by the large platforms because the number of Hcrt1-ir cells was significantly smaller in the SPRD group compared to the LPC animals. Furthermore, the finding that changes in Hcrt1-ir cell-numbers were higher in the WKY rats overall compared to the WIS groups indicates a greater reactivity to the pedestal conditions by the WKY rats. This finding accords with previous studies that suggested a greater degree of reactivity to environmental effects in WKY compared to WIS rats (Rittenhouse et al., 2002). Although, compared to CC rats, cell numbers in the SPRD animals were increased, a direct antidepressant-like effect of REMSD on hypothalamic Hcrt neuron numbers and depression would have been expected to result in selective increases in Hcrt neurons in the REMS deprived WKY (WKY-SPRD) rats, an effect which was not observed. Thus, we conclude that the data do not support a direct antidepressant-like effect of REMSD on hypothalamic Hcrt neurons in WKY rats.
The exact reasons the LPC animals were more reactive to the control conditions of the larger platforms remains undetermined. To the best of our knowledge, however, this is the first study to investigate the cytoarchitectural effects of REMS deprivation on hypothalamic, Hcrt1 neurons. The findings further underline the importance of appropriate control groups (e.g. LPC) in sleep deprivation studies using the rat model. The increase in Hcrt1-ir cells in the WKY rats is in accordance with the hyperexcitability noted in these rats and suggests an increase in excitability of Hcrt1 cells in this strain. Interestingly, in a human study conducted by Salomon and coworkers, an absolute change in CSF Hcrt levels was not observed in depressed individuals. However, compared to normals, depressed patients exhibited significant reductions in the circadian amplitudes of Hcrt1-expression (Salomon et al., 2003).
The relatively lower numbers of Hcrt1-ir cells in the WKY rats may be associated with the increased amounts of and shortened latencies to REM sleep that are reported for these animals (Dugovic et al., 2000). Hyper-reactivity of the Hcrt system in the WKY rats may also contribute to the increased fragmentation of REMS that has been reported in this strain of rats (Dugovic et al., 2000). Although ameliorative effects of REMS-deprivation on depressive symptoms has been suggested in both human (Vogel et al., 1980) and animal studies (Maudhuit et al., 1996; Pedrazzoli et al., 2004; Vogel et al., 1990), the underlying mechanisms appear not to be directly linked to the Hcrt system. However, increases in Hcrt activity could initiate downstream increases in glutamatergic, and, especially monoaminergic neurotransmission (Kilduff and Peyron, 2000; Mignot, 2001), which are thought to be responsible for the positive effects associated with this treatment (Vogel et al., 1975). Since depression and sleep disturbances are common co-morbid conditions (Benca, 2005; Riemann et al., 2001), it is possible that Hcrt changes observed in such studies are primarily reflecting the sleep-rather than the mood-effects.
Both strains of rats had qualitatively similar reactions to the multiple-platform conditions, in terms of reduced weight gain. In agreement with other REMS-deprivation studies (Koban and Stewart, 2006; Kushida et al., 1989), weight gain was differentially affected by the platform treatments in both strains. Moreover, weight changes observed here are in line with previous REMS-deprivation studies demonstrating weight loss or lower weight gain in the small platform animals (Bergmann et al., 1989; Hipolide et al., 2006; Kushida et al., 1989). It appears that despite ad libitum food and water, both REMS-deprived and platform/tank control animals can actually have an increased food intake despite a decrease in body weight (Koban and Stewart, 2006; Kushida et al., 1989).
Although we did not measure the sleep-wake cycle of these rats, others have reported effective deprivation of REMS by the small platform (SPRD) while the large platforms (LPC) allow essentially undisturbed amounts of all stages of sleep. For example, Adrien’s group reports that small pedestal deprivation caused a non-significant 7% reduction in SWS in rats (Adrien and Dugovic, 1984). More relevant to the present report, another study comparing effects of multiple small platforms on sleep architecture in rats showed an initial 20% reduction in SWS in the first 24 h that rapidly reduced to 10% (i.e., 90% of baseline SWS amounts) on subsequent days (Van Luijtelaar and Coenen, 1985). More recently, Tufik’s group, using the multiple platform modification of pedestal REMS deprivation indicated a nearly equal loss of SWS (reduced to about 75% of baseline) in both large and small multiple pedestal conditions (Machado et al., 2004). Interestingly, these authors reported that SWS loss was less severe in animals housed with a single platform. Nevertheless, in that study SWS failed to rebound and the authors argue caution in interpreting their data to indicate a physiological deficit in SWS after this treatment.
In contrast to our previous study, where a significant 15% decrease in size of Hcrt1-ir cells in WKY compared to WIS rats was reported (Allard et al., 2004), no significant difference was observed between the two groups in the present experiment. This discrepancy might be due, in part, to the differences in the age of the rats used in the two studies. The present study used 8–9 week-old rats as opposed to the 11–12 week-old rats used previously. Since differences in Hcrt cell size may only become observable after some developmental milestone, ontogenetic study of Hcrt1-ir neuronal development would be of particular interest in this regard.
In summary, prolonged, seven-day REMSD in a rat model of depression affected both weight gain and the number of cells expressing Hcrt1-ir in the hypothalamus with WKY rats showing a greater reactivity than the WIS rats on the latter measure. The results do not, however, support a direct antidepressant-like effect of REMSD on hypothalamic Hcrt neurons in this animal model of depression. Additional studies are required to determine the role of Hcrt neurons in depression.
Acknowledgments
This study was supported by NIH/NIGMS, 2S06GM08016-36, NIH/NINDS, NS-31720 (JPS) NIH MHIRT, 9T MD 001582-08 and NINDS, U54 NS039407-06.
References
- Adrien J, Dugovic C. Presence of a paradoxical sleep (PS) factor in the cerebrospinal fluid of PS-deprived rats. Eur J Pharmacol. 1984;100:223–226. doi: 10.1016/0014-2999(84)90227-9. [DOI] [PubMed] [Google Scholar]
- Allard JS, Tizabi Y, Shaffery JP, Trouth CO, Manaye K. Stereological analysis of the hypothalamic hypocretin/orexin neurons in an animal model of depression. Neuropeptides. 2004;38:311–315. doi: 10.1016/j.npep.2004.06.004. [DOI] [PubMed] [Google Scholar]
- Anand A, Charney DS. Norepinephrine dysfunction in depression. J Clin Psychiatry. 2000;61(Suppl 10):16–24. [PubMed] [Google Scholar]
- Basheer R, Magner M, McCarley RW, Shiromani PJ. REM sleep deprivation increases the levels of tyrosine hydroxylase and norepinephrine transporter mRNA in the locus coeruleus. Brain Res Mol Brain Res. 1998;57:235–240. doi: 10.1016/s0169-328x(98)00088-6. [DOI] [PubMed] [Google Scholar]
- Benca RM. Mood disorders. In: Kryger MH, Roth T, Dement WC, editors. Principles and Practice of Sleep Medicine. Elsevier/Saunders; Philadelphia PA: 2005. pp. 1311–1326. [Google Scholar]
- Bergmann BM, Everson CA, Kushida CA, Fang VS, Leitch CA, Schoeller DA, Refetoff S, Rechtschaffen A. Sleep deprivation in the rat: V. Energy use and mediation. Sleep. 1989;12:31–41. doi: 10.1093/sleep/12.1.31. [DOI] [PubMed] [Google Scholar]
- Bourgin P, Huitron-Resendiz S, Spier AD, Fabre V, Morte B, Criado JR, Sutcliffe JG, Henriksen SJ, de Lecea L. Hypocretin-1 modulates rapid eye movement sleep through activation of locus coeruleus neurons. J Neurosci. 2000;20:7760–7765. doi: 10.1523/JNEUROSCI.20-20-07760.2000. [DOI] [PMC free article] [PubMed] [Google Scholar]
- Brown RE, Sergeeva OA, Eriksson KS, Haas HL. Convergent excitation of dorsal raphe serotonin neurons by multiple arousal systems (orexin/hypocretin, histamine and noradrenaline) J Neurosci. 2002;22:8850–8859. doi: 10.1523/JNEUROSCI.22-20-08850.2002. [DOI] [PMC free article] [PubMed] [Google Scholar]
- Burdakov D, Alexopoulos H. Metabolic state signalling through central hypocretin/orexin neurons. J Cell Mol Med. 2005;9:795–803. doi: 10.1111/j.1582-4934.2005.tb00380.x. [DOI] [PMC free article] [PubMed] [Google Scholar]
- Coenen AM, Van Luijtelaar EL. Stress induced by three procedures of deprivation of paradoxical sleep. Physiol Behav. 1985;35:501–504. doi: 10.1016/0031-9384(85)90130-1. [DOI] [PubMed] [Google Scholar]
- Coppen A. The biochemistry of affective disorders. Brit J Psychiatry. 1967;113:1237–1264. doi: 10.1192/bjp.113.504.1237. [DOI] [PubMed] [Google Scholar]
- Daté Y, Ueta Y, Yamashita H, Yamaguchi H, Matsukura S, Kangawa K, Sakurai T, Yanagisawa M, Nakazato M. Orexins, orexigenic hypothalamic peptides, interact with autonomic, neuroendocrine and neuroregulatory systems. Proc Natl Acad Sci USA. 1999;96:748–753. doi: 10.1073/pnas.96.2.748. [DOI] [PMC free article] [PubMed] [Google Scholar]
- de Lecea L, Sutcliffe JG. The hypocretins and sleep. FEBS J. 2005;272:5675–5688. doi: 10.1111/j.1742-4658.2005.04981.x. [DOI] [PubMed] [Google Scholar]
- de Lecea L, Kilduff TS, Peyron C, Gao X, Foye PE, Danielson PE, Fukuhara C, Battenberg EL, Gautvik VT, Bartlett FS, Frankel WN, van den Pol AN, Bloom FE, Gautvik KM, Sutcliffe JG. The hypocretins: hypothalamus-specific peptides with neuroexcitatory activity. Proc Natl Acad Sci USA. 1998;95:322–327. doi: 10.1073/pnas.95.1.322. [DOI] [PMC free article] [PubMed] [Google Scholar]
- Dugovic C, Solberg LC, Redei E, Van RO, Turek FW. Sleep in the Wistar-Kyoto rat, a putative genetic animal model for depression. Neuroreport. 2000;11:627–631. doi: 10.1097/00001756-200002280-00038. [DOI] [PubMed] [Google Scholar]
- Duman RS. Depression: a case of neuronal life and death? Biol Psychiatry. 2004;56:140–145. doi: 10.1016/j.biopsych.2004.02.033. [DOI] [PubMed] [Google Scholar]
- Espana RA, Baldo BA, Kelley AE, Berridge CW. Wake-promoting and sleep-suppressing actions of hypocretin (orexin): basal forebrain sites of action. Neuroscience. 2001;106:699–715. doi: 10.1016/s0306-4522(01)00319-0. [DOI] [PubMed] [Google Scholar]
- Estabrooke IV, McCarthy MT, Ko E, Chou TC, Chemelli RM, Yanagisawa M, Saper CB, Scammell TE. Fos expression in orexin neurons varies with behavioral state. J Neurosci. 2001;21:1656–1662. doi: 10.1523/JNEUROSCI.21-05-01656.2001. [DOI] [PMC free article] [PubMed] [Google Scholar]
- Fung SJ, Yamuy J, Sampogna S, Morales FR, Chase MH. Hypocretin (orexin) input to trigeminal and hypoglossal motoneurons in the cat: a double-labeling immunohistochemical study. Brain Res. 2001;903:257–262. doi: 10.1016/s0006-8993(01)02318-6. [DOI] [PubMed] [Google Scholar]
- Gardner JP, Fornal CA, Jacobs BL. Effects of sleep deprivation on serotonergic neuronal activity in the dorsal raphe nucleus of the freely moving cat. Neuropsychopharmacol. 1997;17:72–81. doi: 10.1016/S0893-133X(97)00025-0. [DOI] [PubMed] [Google Scholar]
- Graeff FG. Role of 5-HT in defensive behavior and anxiety. Rev Neurosci. 1993;4:181–211. doi: 10.1515/revneuro.1993.4.2.181. [DOI] [PubMed] [Google Scholar]
- Grivel J, Cvetkovic V, Bayer L, Machard D, Tobler I, Muhlethaler M, Serafin M. The wake-promoting hypocretin/orexin neurons change their response to noradrenaline after sleep deprivation. J Neurosci. 2005;25:4127–4130. doi: 10.1523/JNEUROSCI.0666-05.2005. [DOI] [PMC free article] [PubMed] [Google Scholar]
- Gundersen HJ, Jensen EB. The effciency of systematic sampling in stereology and its prediction. J Microsc. 1987;147(Part 3):229–263. doi: 10.1111/j.1365-2818.1987.tb02837.x. [DOI] [PubMed] [Google Scholar]
- Gundersen HJ, Bagger P, Bendtsen TF, Evans SM, Korbo L, Marcussen N, Moller A, Nielsen K, Nyengaard JR, Pakkenberg B. The new stereological tools: disector, fractionator, nucleator and point sampled intercepts and their use in pathological research and diagnosis. APMIS. 1988;96:857–881. doi: 10.1111/j.1699-0463.1988.tb00954.x. [DOI] [PubMed] [Google Scholar]
- Gundersen HJ, Jensen EB, Kieu K, Nielsen J. The effciency of systematic sampling in stereology-reconsidered. J Microsc. 1999;193:199–211. doi: 10.1046/j.1365-2818.1999.00457.x. [DOI] [PubMed] [Google Scholar]
- Hagan JJ, Leslie RA, Patel S, Evans ML, Wattam TA, Holmes S, Benham CD, Taylor SG, Routledge C, Hemmati P, Munton RP, Ashmeade TE, Shah AS, Hatcher JP, Hatcher PD, Jones DNC, Smith MI, Piper DC, Hunter AJ, Porter RA, Upton N. Orexin A activates locus coeruleus cell firing and increases arousal in the rat. Proc Natl Acad Sci. 1999;96:10911–10916. doi: 10.1073/pnas.96.19.10911. [DOI] [PMC free article] [PubMed] [Google Scholar]
- Harris GC, Wimmer M, Aston-Jones G. A role for lateral hypothalamic orexin neurons in reward seeking. Nature. 2005;437:556–559. doi: 10.1038/nature04071. [DOI] [PubMed] [Google Scholar]
- Harro J, Oreland L. Depression as a spreading adjustment disorder of monoaminergic neurons: a case for primary implication of the locus coeruleus. Brain Res Brain Res Rev. 2001;38:79–128. doi: 10.1016/s0165-0173(01)00082-0. [DOI] [PubMed] [Google Scholar]
- Hipolide DC, Suchecki D, Pinto AP, Chiconelli Faria E, Tufik S, Luz J. Paradoxical sleep deprivation and sleep recovery: effects on the hypothalamic-pituitary-adrenal axis activity, energy balance and body composition of rats. J Neuroendocrinol. 2006;18:231–238. doi: 10.1111/j.1365-2826.2006.01412.x. [DOI] [PubMed] [Google Scholar]
- Horvath TL, Diano S, van den Pol AN. Synaptic interaction between hypocretin (orexin) and neuropeptide Y cells in the rodent and primate hypothalamus: a novel circuit implicated in metabolic and endocrine regulations. J Neurosci. 1999;19:1072–1087. doi: 10.1523/JNEUROSCI.19-03-01072.1999. [DOI] [PMC free article] [PubMed] [Google Scholar]
- Ida T, Nakahara K, Murakami T, Hanada R, Nakazato M, Murakami N. Possible involvement of orexin in the stress reaction in rats. Biochem Biophys Res Commun. 2000;270:318–323. doi: 10.1006/bbrc.2000.2412. [DOI] [PubMed] [Google Scholar]
- John J, Wu MF, Boehmer LN, Siegel JM. Cataplexyactive neurons in the hypothalamus: implications for the role of histamine in sleep and waking behavior. Neuron. 2004;42:619–634. doi: 10.1016/s0896-6273(04)00247-8. [DOI] [PMC free article] [PubMed] [Google Scholar]
- Kahn RS, van Praag HM, Wetzler S, Asnis GM, Barr G. Serotonin and anxiety revisited. Biol Psychiatry. 1988;23:189–208. doi: 10.1016/0006-3223(88)90091-1. [DOI] [PubMed] [Google Scholar]
- Kilduff TS, Peyron C. The hypocretin/orexin ligand-receptor system: implications for sleep and sleep disorders. Trends Neurosci. 2000;23:359–365. doi: 10.1016/s0166-2236(00)01594-0. [DOI] [PubMed] [Google Scholar]
- Koban M, Stewart CV. Effects of age on recovery of body weight following REM sleep deprivation of rats. Physiol Behav. 2006;87:1–6. doi: 10.1016/j.physbeh.2005.09.006. [DOI] [PubMed] [Google Scholar]
- Kovalzon VM, Tsibulsky VL. REM-sleep deprivation, stress and emotional behvior in rats. Behav Brain Res. 1984;14:235–245. doi: 10.1016/0166-4328(84)90191-8. [DOI] [PubMed] [Google Scholar]
- Kupfer DJ, Buysse DJ, Reynolds CF., III Scientific advances in the diagnosis and treatment of sleep disorders. Clin Neuropharmacol. 1992;15(Suppl 1 Part A):334A–335A. doi: 10.1097/00002826-199201001-00173. [DOI] [PubMed] [Google Scholar]
- Kuru M, Ueta Y, Serino R, Nakazato M, Yamamoto Y, Shibuya I, Yamashita H. Centrally administered orexin/hypocretin activates HPA axis in rats. Neuroreport. 2000;11:1977–1980. doi: 10.1097/00001756-200006260-00034. [DOI] [PubMed] [Google Scholar]
- Kushida CA, Bergman BM, Rechtschaffen A. Sleep deprivation in the rat: IV. Paradoxical sleep deprivation. Sleep. 1989;12:22–30. doi: 10.1093/sleep/12.1.22. [DOI] [PubMed] [Google Scholar]
- Lee MG, Hassani OK, Jones BE. Discharge of identified orexin/hypocretin neurons across the sleep-waking cycle. J Neurosci. 2005;25:6716–6720. doi: 10.1523/JNEUROSCI.1887-05.2005. [DOI] [PMC free article] [PubMed] [Google Scholar]
- Leonard BE. Stress, norepinephrine and depression. J Psychiatry Neurosci. 2001;26(Suppl):S11–S16. [PMC free article] [PubMed] [Google Scholar]
- Liu RJ, van den Pol AN, Aghajanian GK. Hypocretins (orexins) regulate serotonin neurons in the dorsal raphe nucleus by excitatory direct and inhibitory indirect actions. J Neurosci. 2002;22:9453–9464. doi: 10.1523/JNEUROSCI.22-21-09453.2002. [DOI] [PMC free article] [PubMed] [Google Scholar]
- Long JM, Kalehua AN, Muth NJ, Hengemihle JM, Jucker M, Calhoun ME, Ingram DK, Mouton PR. Stereological estimation of total microglia number in mouse hippocampus. J Neurosci Meth. 1998;84:101–108. doi: 10.1016/s0165-0270(98)00100-9. [DOI] [PubMed] [Google Scholar]
- Machado RB, Hipolide DC, edito-Silva AA, Tufik S. Sleep deprivation induced by the modified multiple platform technique: quantification of sleep loss and recovery. Brain Res. 2004;1004:45–51. doi: 10.1016/j.brainres.2004.01.019. [DOI] [PubMed] [Google Scholar]
- Martins PJ, D’Almeida V, Pedrazzoli M, Lin L, Mignot E, Tufik S. Increased hypocretin-1 (orexin-a) levels in cerebrospinal fluid of rats after short-term forced activity. Regul Peptides. 2004;117:155–158. doi: 10.1016/j.regpep.2003.10.003. [DOI] [PubMed] [Google Scholar]
- Maudhuit C, Jolas T, Chastanet M, Hamon M, Adrien J. Reduced inhibitory potency of serotonin reuptake blockers on central serotoninergic neurons in rats selectively deprived of rapid eye movement sleep. Biol Psychiatry. 1996;40:1000–1007. doi: 10.1016/0006-3223(95)00583-8. [DOI] [PubMed] [Google Scholar]
- Mendelson WB, Guthrie RD, Frederick G, Wyatt RJ. The flower pot technique of rapid eye movement (REM) sleep deprivation. Pharmacol Biochem Behav. 1974;2:553–556. doi: 10.1016/0091-3057(74)90018-5. [DOI] [PubMed] [Google Scholar]
- Mignot E. A commentary on the neurobiology of the hypocretin/orexin system. Neuropsychopharmacol. 2001;25:S5–S13. doi: 10.1016/S0893-133X(01)00316-5. [DOI] [PubMed] [Google Scholar]
- Mileykovskiy BY, Kiyashchenko LI, Siegel JM. Behavioral correlates of activity in identified hypocretin/orexin neurons. Neuron. 2005;46:787–798. doi: 10.1016/j.neuron.2005.04.035. [DOI] [PMC free article] [PubMed] [Google Scholar]
- Modirrousta M, Mainville L, Jones BE. Orexin and MCH neurons express c-Fos differently after sleep deprivation vs recovery and bear different adrenergic receptors. Eur J Neurosci. 2005;21:2807–2816. doi: 10.1111/j.1460-9568.2005.04104.x. [DOI] [PubMed] [Google Scholar]
- Mogilnicka E, Przewlocka B, Van Luijtelaar EL, Klimek V, Coenen AM. Effects of REM sleep deprivation on central alpha 1- and beta-adrenoceptors in rat brain. Pharmacol Biochem Behav. 1986;25:329–332. doi: 10.1016/0091-3057(86)90004-3. [DOI] [PubMed] [Google Scholar]
- Mouton PR, Long JM, Lei DL, Howard V, Jucker M, Calhoun ME, Ingram DK. Age and gender effects on microglia and astrocyte numbers in brains of mice. Brain Res. 2002;956:30–35. doi: 10.1016/s0006-8993(02)03475-3. [DOI] [PubMed] [Google Scholar]
- Nambu T, Sakurai T, Mizukami K, Hosoya Y, Yanagisawa M, Goto K. Distribution of orexin neurons in the adult rat brain. Brain Res. 1999;827:243–260. doi: 10.1016/s0006-8993(99)01336-0. [DOI] [PubMed] [Google Scholar]
- Nishino S, Okura M, Mignot E. Narcolepsy: genetic predisposition and neuropharmacological mechanisms. Rev Article Sleep Med Rev. 2000a;4:57–99. doi: 10.1053/smrv.1999.0069. [DOI] [PubMed] [Google Scholar]
- Nishino S, Ripley B, Overeem S, Lammers GJ, Mignot E. Hypocretin (orexin) deficiency in human narcolepsy. Lancet. 2000b;355:39–40. doi: 10.1016/S0140-6736(99)05582-8. [DOI] [PubMed] [Google Scholar]
- Nunez A, Moreno-Balandran ME, Rodrigo-Angulo ML, Garzon M, De Andres I. Relationship between the perifornical hypothalamic area and oral pontine reticular nucleus in the rat. Possible implication of the hypocretinergic projection in the control of rapid eye movement sleep. Eur J Neurosci. 2006;24:2834–2842. doi: 10.1111/j.1460-9568.2006.05159.x. [DOI] [PubMed] [Google Scholar]
- Paré WP. “Behavioral despair” test predicts stress ulcer in WKY rats. Physiol Behav. 1989;46:483–487. doi: 10.1016/0031-9384(89)90025-5. [DOI] [PubMed] [Google Scholar]
- Paré WP. Investigatory behavior of a novel conspecific by Wistar Kyoto, Wistar and Sprague-Dawley rats. Brain Res Bull. 2000;53:759–765. doi: 10.1016/s0361-9230(00)00362-2. [DOI] [PubMed] [Google Scholar]
- Paxinos G, Watson C. The Rat Brain in Stereotaxic Coordinates. Academic Press; Sandiego: 1986. [Google Scholar]
- Pedrazzoli M, Benedito MA. Rapid eye movement sleep deprivation-induced down-regulation of beta-adrenergic receptors in the rat brainstem and hippocampus. Pharmacol Biochem Behav. 2004;79:31–36. doi: 10.1016/j.pbb.2004.06.001. [DOI] [PubMed] [Google Scholar]
- Pedrazzoli M, D’Almeida V, Martins PJ, Machado RB, Ling L, Nishino S, Tufik S, Mignot E. Increased hypocretin-1 levels in cerebrospinal fluid after REM sleep deprivation. Brain Res. 2004;995:1–6. doi: 10.1016/j.brainres.2003.09.032. [DOI] [PubMed] [Google Scholar]
- Peyron C, Wurts SW, Srere HK, Heller HC, Edgar DM, Kilduff TS. mRNA level of brain derived-neurotrophic factor (BDNF) increases in several brian regions after sleep deprivation. Soc Neurosci Abstr. 1998;24:1430. [Google Scholar]
- Plotsky PM, Owens MJ, Nemeroff CB. Psychoneuroendocrinology of depression. Hypothalamic-pituitary-adrenal axis. Psychiat Clin North Am. 1998;21:293–307. doi: 10.1016/s0193-953x(05)70006-x. [DOI] [PubMed] [Google Scholar]
- Prober DA, Rihel J, Onah AA, Sung RJ, Schier AF. Hypocretin/orexin overexpression induces an insomnia-like phenotype in Zebrafish. J Neurosci. 2006;26:13400–13410. doi: 10.1523/JNEUROSCI.4332-06.2006. [DOI] [PMC free article] [PubMed] [Google Scholar]
- Rechtschaffen A, Gilliland Ma, Bergman BM, Winter JB. Physiological correlates of prolonged sleep deprivation in rats. Science. 1983;221:182–184. doi: 10.1126/science.6857280. [DOI] [PubMed] [Google Scholar]
- Riemann D, Berger M, Voderholzer U. Sleep and depression-results from psychobiological studies: an overview. Biol Psychol. 2001;57:67–103. doi: 10.1016/s0301-0511(01)00090-4. [DOI] [PubMed] [Google Scholar]
- Rittenhouse PA, Lopez-Rubalcava C, Stanwood GD, Lucki I. Amplified behavioral and endocrine responses to forced swim stress in the Wistar-Kyoto rat. Psychoneuroendocrinol. 2002;27:303–318. doi: 10.1016/s0306-4530(01)00052-x. [DOI] [PubMed] [Google Scholar]
- Sakurai A, Shirahama S, Fujimori M, Katai M, Itakura Y, Kobayashi S, Amano J, Fukushima Y, Hashizume K. Novel MEN1 gene mutations in familial multiple endocrine neoplasia type 1. J Hum Genet. 1998;43:199–201. doi: 10.1007/s100380050070. [DOI] [PubMed] [Google Scholar]
- Salomon RM, Ripley B, Kennedy JS, Johnson B, Schmidt D, Zeitzer JM, Nishino S, Mignot E. Diurnal variation of cerebrospinal fluid hypocretin-1 (orexin-A) levels in control and depressed subjects. Biol Psychiatry. 2003;54:96–104. doi: 10.1016/s0006-3223(02)01740-7. [DOI] [PubMed] [Google Scholar]
- Shaffery JP, Oksenberg A, Marks GA, Speciale SG, Mihailoff G, Roffwarg HP. REM sleep deprivation in monocularly occluded kittens reduces the size of cells in LGN monocular segment. Sleep. 1998;21:837–845. doi: 10.1093/sleep/21.8.837. [DOI] [PubMed] [Google Scholar]
- Shaffery JP, Hoffmann R, Armitage R. The neurobiology of depression: perspectives from animal and human sleep studies. Neuroscientist. 2003;9:82–98. doi: 10.1177/1073858402239594. [DOI] [PubMed] [Google Scholar]
- Smith HR, Pang KC. Orexin-saporin lesions of the medial septum impair spatial memory. Neuroscience. 2005;132:261–271. doi: 10.1016/j.neuroscience.2004.12.037. [DOI] [PubMed] [Google Scholar]
- Suchecki D, Lobo LL, Hipolide DC, Tufik S. Increased ACTH and corticosterone secretion induced by different methods of paradoxical sleep deprivation. J Sleep Res. 1998;7:276–281. doi: 10.1046/j.1365-2869.1998.00122.x. [DOI] [PubMed] [Google Scholar]
- Sutcliffe JG, de Lecea L. The hypocretins: excitatory neuromodulatory peptides for multiple homeostatic systems, including sleep and feeding. J Neurosci Res. 2000;62:161–168. doi: 10.1002/1097-4547(20001015)62:2<161::AID-JNR1>3.0.CO;2-1. [DOI] [PubMed] [Google Scholar]
- Taheri S, Zeitzer JM, Mignot E. The role of hypocretins (orexins) in sleep regulation and narcolepsy. Annu Rev Neurosci. 2002;25:283–313. doi: 10.1146/annurev.neuro.25.112701.142826. [DOI] [PubMed] [Google Scholar]
- Thannickal TC, Moore RY, Nienhuis R, Ramanathan L, Gulyani S, Aldrich M, Cornford M, Siegel JM. Reduced number of hypocretin neurons in human narcolepsy. Neuron. 2000;27:469–474. doi: 10.1016/s0896-6273(00)00058-1. [DOI] [PMC free article] [PubMed] [Google Scholar]
- van den Pol AN. Hypothalamic hypocretin (orexin): robust innervation of the spinal cord. J Neurosci. 1999;19:3171–3182. doi: 10.1523/JNEUROSCI.19-08-03171.1999. [DOI] [PMC free article] [PubMed] [Google Scholar]
- Van Luijtelaar EL, Coenen AM. Paradoxical sleep deprivation and the immobility response in the rat: effects of desipramine and phentolamine. Sleep. 1985;8:49–55. doi: 10.1093/sleep/8.1.49. [DOI] [PubMed] [Google Scholar]
- Vogel GW. A review of REM sleep deprivations. Arch Gen Psychiatry. 1975;32:740–761. doi: 10.1001/archpsyc.1975.01760240077006. [DOI] [PubMed] [Google Scholar]
- Vogel GW, Thurmond A, Gibbons P, Sloan K, Walker M. REM sleep reduction effects on depression syndromes. Arch Gen Psychiatry. 1975;32:765–777. doi: 10.1001/archpsyc.1975.01760240093007. [DOI] [PubMed] [Google Scholar]
- Vogel GW, Vogel F, McAbee RS, Thurmond AJ. Improvement of depression by REM sleep deprivation. New findings and a theory. Arch Gen Psychiatry. 1980;37:247–253. doi: 10.1001/archpsyc.1980.01780160017001. [DOI] [PubMed] [Google Scholar]
- Vogel G, Neill D, Hagler M, Kors D. A new animal model of endogenous depression: a summary of present findings. Neurosci Biobehav Rev. 1990;14:85–91. doi: 10.1016/s0149-7634(05)80164-2. [DOI] [PubMed] [Google Scholar]
- Winsky-Sommerer R, Yamanaka A, Diano S, Borok E, Roberts AJ, Sakurai T, Kilduff TS, Horvath TL, de Lecea L. Interaction between the corticotropin-releasing factor system and hypocretins (orexins): a novel circuit mediating stress response. J Neurosci. 2004;24:11439–11448. doi: 10.1523/JNEUROSCI.3459-04.2004. [DOI] [PMC free article] [PubMed] [Google Scholar]
- Wirz-Justice A, Van den Hoofdakker RH. Sleep deprivation in depression: what do we know, where do we go? Biol Psychiatry. 1999;46:445–453. doi: 10.1016/s0006-3223(99)00125-0. [DOI] [PubMed] [Google Scholar]
- Wu JC, Bunney WE. The biological basis of an antidepressant response to sleep deprivation and relapse: review and hypothesis. Am J Psychiatry. 1990;147:14–21. doi: 10.1176/ajp.147.1.14. [DOI] [PubMed] [Google Scholar]
- Yoshida Y, Fujiki N, Nakajima T, Ripley B, Matsumura H, Yoneda H, Mignot E, Nishino S. Fluctuation of extracellular hypocretin-1 (orexin A) levels in the rat in relation to the light-dark cycle and sleep-wake activities. Eur J Neurosci. 2001;14:1075–1081. doi: 10.1046/j.0953-816x.2001.01725.x. [DOI] [PubMed] [Google Scholar]
- Youngblood BD, Smagin GN, Elkins PD, Ryan DH, Harris RB. The effects of paradoxical sleep deprivation and valine on spatial learning and brain 5-HT metabolism. Physiol Behav. 1999;67:643–649. doi: 10.1016/s0031-9384(99)00120-1. [DOI] [PubMed] [Google Scholar]