Abstract
Because of its protein-denaturing ability, urea has played a pivotal role in the experimental and conceptual understanding of protein folding and unfolding. The measure of urea's ability to force a protein to unfold is given by the m value, an experimental quantity giving the free energy change for unfolding per molar urea. With the aid of Tanford's transfer model [Tanford C (1964) J Am Chem Soc 86:2050–2059], we use newly obtained group transfer free energies (GTFEs) of protein side-chain and backbone units from water to 1 M urea to account for the m value of urea, and the method reveals the anatomy of protein denaturation in terms of residue-level free energy contributions of groups newly exposed on denaturation. The GTFEs were obtained by accounting for solubility and activity coefficient ratios accompanying the transfer of glycine from water to 1 M urea. Contrary to the opinions of some researchers, the GTFEs show that urea does not denature proteins through favorable interactions with nonpolar side chains; what drives urea-induced protein unfolding is the large favorable interaction of urea with the peptide backbone. Although the m value is said to be proportional to surface area newly exposed on denaturation, only ≈25% of the area favorably contributes to unfolding (because of newly exposed backbone units), with ≈75% modestly opposing urea-induced denaturation (originating from side-chain exposure). Use of the transfer model and newly determined GTFEs achieves the long-sought goal of predicting urea-dependent cooperative protein unfolding energetics at the level of individual amino acid residues.
Keywords: m value, transfer free energy, transfer model, activity coefficient, self-avoiding random coil
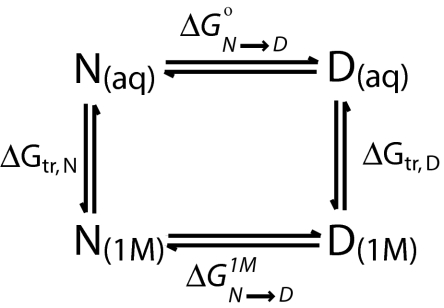
Understanding the energetics of protein–solute interactions is one of the most elusive goals of protein science, with urea-induced denaturation serving as a long-standing reminder of the inability to experimentally account for such fundamental interactions in a detailed manner. More than 40 years ago, Tanford set out to identify the sites and free energies of urea interaction with protein groups in enough detail to account for the energetics of urea-induced denaturation (1–3). In principle, the transfer model he developed provides a means of dissecting which groups (side chain and backbone) are involved in denaturation and how much they contribute to the free energy of denaturation by urea. For the transfer model (see Scheme 1) to be successful, two requirements must be met: (i) accurate transfer free energy changes for side-chain and backbone groups must be known, and (ii) the free energy of transfer of a native or denatured state of a protein from water to the urea solution must be equal to the sum of the transfer free energy contributions of its solvent-exposed parts. Of these two requirements, the ability to obtain accurate transfer free energies of side chains and backbone groups has been a particularly difficult impediment to quantifying the energetics of urea-induced denaturation. Here, we present results for the transfer free energy of glycine from water to 1 M urea that improve the evaluation of side-chain transfer free energies, and elevate the transfer model to the quantitative level originally sought by Tanford and colleagues.
Scheme 1.
The transfer model
The standard state transfer free energy of an amino acid (i) from water to urea (ΔGtr,i°) is given by Eq. 1, where ai,w and ai,urea represent the thermodynamic activities of amino acid i at its solubility limit in water and urea, respectively (1). Terms (γi,w/γi,urea) and (si,w/si,urea) represent the activity coefficient and concentration ratios in either mole fraction, molar, or molal units, each quantity being evaluated at the solubility limit of amino acid i.
 |
Historically, that part of the transfer free energy arising from concentration ratios was taken to represent the transfer free energy, with the contribution due to the activity coefficient ratio considered as small or negligible (1). Because the data on amino acid solubility in water and urea are reported without activity coefficients, the transfer free energies of amino acids presented previously must be regarded as apparent transfer free energies [ΔGtr,iapp = RT ln(si,w/si,urea)] (1, 4).
The transfer free energies of side-chain groups from water to 1 M urea are needed in application of the transfer model. Because the structure of glycine is a common part of the structure of all amino acids, Nozaki and Tanford suggested the side-chain or group transfer free energies (GTFEs) could be obtained by subtracting the apparent transfer free energy of glycine (ΔGtr,Glyapp) from the apparent transfer free energy of each amino acid i (1). Thus, the GTFEs reported by Nozaki and Tanford are also apparent side-chain transfer free energy changes, GTFEtr,iapp (1). Here we show that use of the original GTFEtr,iapp values with the transfer model does not result in quantitative results or predictive capability that would encourage use of the model. However, activity coefficient data are available for glycine in water and 1 M urea and can be combined with the glycine solubility ratio to give ΔGtr,Gly°. Subtraction of ΔGtr,Gly° from ΔGtr,iapp values of the amino acids results in side-chain group transfer quantities we call GTFE*tr,i. These quantities account for the activity coefficients of glycine and their use makes the transfer model highly predictive of thermodynamic quantities derived from urea-induced denaturation of proteins. This revitalization of the transfer model provides insight into the anatomy of energetic contributions of side chains and backbone to the cooperativity (m value) of urea-induced protein unfolding, placing the model on a firm foundation for further predictions of the thermodynamic properties of urea–protein interactions.
Considerable diversity of opinion exists concerning mechanisms of urea-induced denaturation of proteins. Some authors cite the favorable interaction of urea with nonpolar groups as the source of its denaturing action (1, 3, 5, 6), others claim that urea's favorable interaction with peptide backbone is responsible (7–9), and still others refer to its favorable interactions with both the backbone and nonpolar groups as the cause of denaturation (10–12). Given the major role urea has played in understanding the thermodynamics and kinetics of protein folding/unfolding, the inability to achieve consensus on how it denatures proteins is symptomatic of the limited and sometimes misleading experimental model compound data on urea interactions with protein groups. The long-standing conclusion that urea denatures proteins because of its favorable interaction with nonpolar side chains arises from the GTFEtr,iapp values of nonpolar groups reported by Nozaki and Tanford (1). When activity coefficients are used to correctly account for the transfer free energy of glycine, the interaction free energies between urea and nonpolar groups are not of a magnitude that justifies that long-standing conclusion. Our analysis using GTFE*tr,i values and the transfer model clearly shows that urea's favorable interaction with peptide backbone is the driving force for urea-induced denaturation, with nonpolar group–urea interactions playing little or no role in the process.
Results
Group Transfer Free Energies.
A special case of Eq. 1 applies if the solubility of amino acid i reaches a low enough limit in water and in urea solution that the activity coefficient of the amino acid takes a value of unity. Under this condition, the chemical activity of the amino acid becomes equal to its concentration and ΔGtr,iapp = ΔG°tr,i. Activity coefficients are difficult to measure, so to obviate the need for measurement, model compounds may be chosen for transfer free energy measurements that have solubility limits low enough that activity coefficients can be ignored. Evidence in support of reaching such limits occurs when the apparent transfer free energy of the chemical moiety of interest is found not to depend on the particular (highly insoluble) model compound containing the moiety. Such chemical-model-independent transfer free energies were established for the peptide backbone moiety, not only from water to 1 M urea, but also from water to an array of protecting osmolytes at 1 M concentration (13).
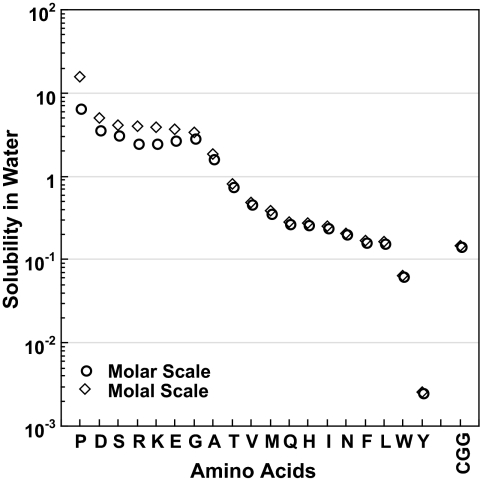
Traditionally, the compounds used as models of side-chain moieties have been the amino acids themselves, and not all of these meet the criterion of having low solubility limits. Fig. 1 provides the molar and molal water solubility limits of 19 amino acids ranked from the most (proline) to the least (tyrosine) soluble. As a point of reference, cyclic glycylglycine is a model compound for the peptide backbone moiety whose solubility limit is low enough that (γi,w/γi,urea) → 1. Given that molar and molal concentrations become identical in dilute solution, the difference between these two concentration scales provides a visual indication of the relative solubility limits of the amino acids as they become dilute enough for the two scales to coincide. Coincidence of molar and molal scales does not necessarily mean the compound meets the solubility limit where the activity coefficient is unity; it is used here merely as a visual indicator of the approach to dilute solution.
Fig. 1.
The solubility of amino acids in water in the molar (○) and molal (◇) concentration scales are ranked from greatest (proline) to least (tyrosine) according to molal solubility. The solubility of the peptide backbone model compound, cyclic glycylglycine (CGG), is included on the far right.
Although the solubility limits of amino acids to the right of threonine in Fig. 1 are indistinguishable in terms of their molar and molal concentrations, glycine, alanine, and amino acids to their left are sufficiently soluble to exhibit molal and molar concentration differences. For amino acids to the left of threonine, one might expect molal and molar activity coefficients unequal to one. Rafflenbeul et al. (14) have measured molal activity coefficients for glycine in urea and water, from which the authors obtained molar activity coefficients of glycine at its solubility limit in water (0.844) and in 1 M urea solution (0.904). This gives an activity coefficient ratio of 0.934 and a contribution of −40.3 cal·mol−1·M−1 to the transfer free energy of glycine, due to the activity coefficient ratio term (see Eq. 1). Note that the activity coefficient ratio is clearly closer to unity than the individual activity coefficients. In general, the activity coefficient ratio will converge to unity significantly before the individual activity coefficients reach unity.
As mentioned previously, the procedure to obtain the group transfer free energies of individual amino acid side chains is to subtract the transfer free energy of glycine from the transfer free energy of all other amino acids (see Eq. 2), where GTFEtr,i°,*,app is the transfer free energy of the side chain of amino acid i (1). GTFEtr,i°,*,app becomes GTFEtr,iapp if only terms 1 and 3 on the right side of Eq. 2 are considered important, GTFE*tr,i if only terms 1,3, and 4 are important, and GTFE°tr,i if all four terms are important. The first two terms on the right side of Eq. 2 comprise the standard state transfer free energy of amino acid i (ΔG°tr,i), and the two terms within the brackets represent the standard state glycine transfer free energy (ΔGtr,Gly°) (1).
 |
Because activity coefficient data for glycine in water and urea are available in the literature, we take the opportunity to report the contributions of both terms in the brackets of Eq. 2, which together give the standard state glycine transfer free energy, ΔGtr,Gly°. Combining ΔGtr,Glyapp° = 18.7 cal/mol reported from the glycine solubility data of Nozaki and Tanford (1), with the activity coefficient ratio contribution determined by Rafflenbeul et al. (14) (−40.3 cal·mol−1·M−1), gives ΔGtr,Gly° = −21.7 cal·mol−1·M−1. Thus, we subtract −21.7, whereas Nozaki and Tanford subtracted + 18.7 cal·mol−1·M−1 from each of the side-chain-containing amino acids. Including the glycine activity coefficient ratio term changes the side-chain GTFEs for water to urea transfer considerably from what has been used and cited since the 1960s.
Transfer Model.
The transfer model, shown in Scheme 1, compares the extent to which the native (N) and denatured (D) state equilibrium in 1 M urea (as given by ΔGN→D1M) differs from N(aq) ⇄ D(aq) in buffer solution (given by ΔG°N→D). The difference in free energy for the two reactions, ΔGN→D1M − ΔG°N→D, represents the m value, a quantity obtained experimentally that measures the efficacy of urea in denaturing a protein. The thermodynamic cycle results in the relationship ΔGN→D1M − ΔG°N→D = ΔGtr,D − ΔGtr,N, showing that the free energy difference of the perpendicular reactions, ΔGtr,D − ΔGtr,N, is also equal to the m value (15). A goal of the transfer model is to evaluate ΔGtr,N and ΔGtr,D individually and from their difference predict the experimental m value of the protein.
ΔGtr,D and ΔGtr,N represent the transfer free energies of denatured and native protein from buffer solution to 1 M urea, and with knowledge of GTFEs of side chains and peptide backbone, N and D transfer free energies can be evaluated as shown previously (15). Beginning with Protein Data Bank structural coordinates of the N state of a particular protein, the solvent-exposed surface of the protein native state is determined with a probe of radius 1.4 Å. The accessible surface area for each type of backbone and side-chain group is summed and normalized against the area of the group exposed to solvent in a Gly-Xaa-Gly peptide. This gives the number of such groups on the protein exposed to solvent (15). The numbers of each type of solvent-exposed group are multiplied by the corresponding GTFE for that particular type of group, and all contributions are summed to give ΔGtr,N.
Likewise for the D state, the evaluation of ΔGtr,D requires additivity of component groups as well as a model of the denatured state solvent accessibility. Creamer et al. (16, 17) considered models for two denatured state extremes, a random coil in a good solvent, representing a highly solvent-exposed expanded state, and a compact denatured state, representing a denatured state with a high degree of solvent inaccessibility. For these extreme models, the solvent accessibilities of groups and the products of their GTFEs and numbers exposed were used to calculate ΔGtr,D for the two extreme models. Schellman's (18) model for the denatured ensemble is half-way between the two extremes, and we have adopted that model for use in this work.
Predictions.
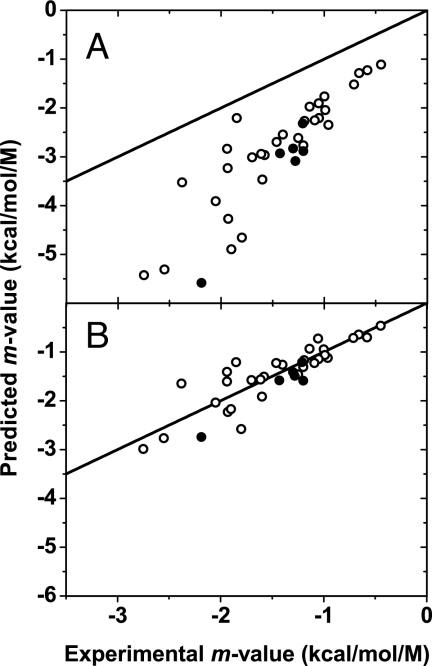
The effect of using the historical GTFEtr,iapp values to predict m values of urea-induced denaturation of monomeric proteins can be seen in Fig. 2A, with molecular weights of proteins increasing roughly from right to left in the figure. It is observed that the predicted m values of urea-induced denaturation do not at all agree with experimentally obtained m values, and the prediction becomes markedly worse as the size of the protein increases. For comparison, filled circles represent disulfide-containing proteins. By contrast, Fig. 2B shows the predicted m values for urea denaturation of the same proteins based on GTFE*tr,i values. The one-to-one correspondence between predicted and observed m values shows considerable improvement in prediction as a result of using GTFEs based on ΔGtr,Gly° instead of ΔGtr,Glyapp.
Fig. 2.
Predicted versus experimentally determined m values. The proteins represented are listed in the SI Appendix. Disulfide-containing proteins are represented as filled circles. The identity line is shown for comparison. Predicted m values were obtained by using GTFEtr,iapp values (A) and the corrected GTFE*tr,i values (B) as explained in the text.
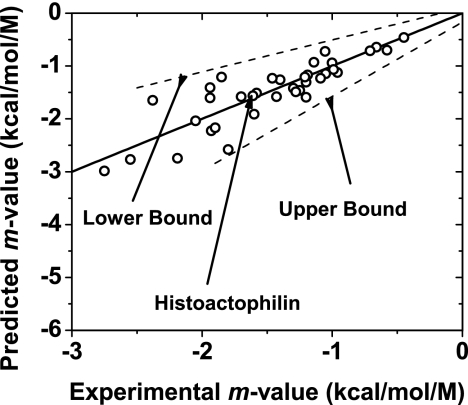
We consider that an important source of deviations from the identity line in Fig. 2B may be differences between the degree of residual structure in the actual denatured state ensembles of proteins displayed, in comparison with the model we used to represent the denatured state. To compare denatured state models, m values were predicted assuming that the D state is a random coil in a good solvent (upper-bound model) or a compact denatured state (lower-bound model). The results of linear fits of the two extreme models are shown in Fig. 3. Schellman's model for the denatured state, used here, results in one-to-one correspondence between predicted and observed m values and is clearly superior to the upper- and lower-bound denatured state models in predicting urea-induced protein denaturation m values.
Fig. 3.
Predicted m values based on GTFE*tr,i values versus experimentally determined m values. The dashed lines indicated give linear fits of the lower- and upper-bound calculated m values. The solid line is the identity line for predicted and experimental m values. The position of histoactophilin, the protein example used in Fig. 5, is shown for reference.
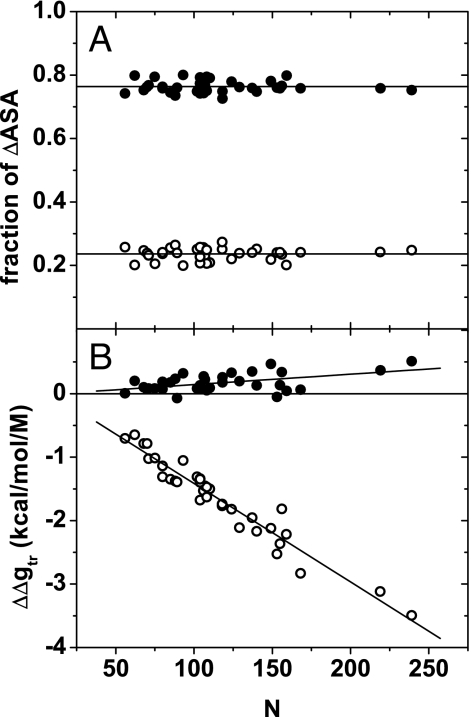
On protein unfolding, side-chain and peptide backbone units become newly exposed and it is the sum of transfer free energies from water to 1 M urea of these groups that gives the predicted m value. Fig. 4A shows that ≈75% of the newly exposed surface area on protein unfolding originates from side chains with ≈25% coming from peptide backbone. These percentages are rather constant with protein chain length. It may come as a surprise to learn that the groups that contribute most to newly exposed surface area do not contribute favorably to denaturation by urea. Fig. 4B shows that the favorable interaction of urea with peptide backbone is responsible for denaturation and that urea interaction with newly exposed side chains, in fact, opposes protein unfolding to a small degree.
Fig. 4.
Fractional surface areas and m value contributions of groups newly exposed on unfolding. (A) Fractions of ΔASA, in which ASA is solvent-accessible surface area, contributed by groups newly exposed on unfolding are shown as a function of protein size (number of residues). The lines represent the average value for side chains and backbones. (B) m value contributions of side chains and backbone units (ΔΔgtr) versus number of residues. The slopes of the fitted lines are (1.6 ± 0.5) × 10−3 for the side chains and (−15.5 ± 0.7) × 10−3 for the backbones. For both A and B, the values for the side chains are shown as filled circles and for the backbone as open circles.
The results shown in Fig. 4B stand in contrast to the position held by many experimentalists for >40 years, that urea denatures proteins because of the favorable interaction between urea and nonpolar side chains exposed on unfolding. That long-held view was based on GTFEtr,iapp values that overestimate the urea–side-chain transfer free energies by 40 cal·mol−1·M−1. With GTFE*tr,i values the nonpolar side chains are relatively unimportant factors in urea-induced denaturation. The supporting information (SI) Appendix provides a table of GTFE*tr,i and GTFEtr,iapp values for side chains and backbone, a listing of monomeric proteins with experimental m values used in the figures, and evaluation of the activity coefficients for glycine in water and 1 M urea on which the GTFE*tr,i results are based.
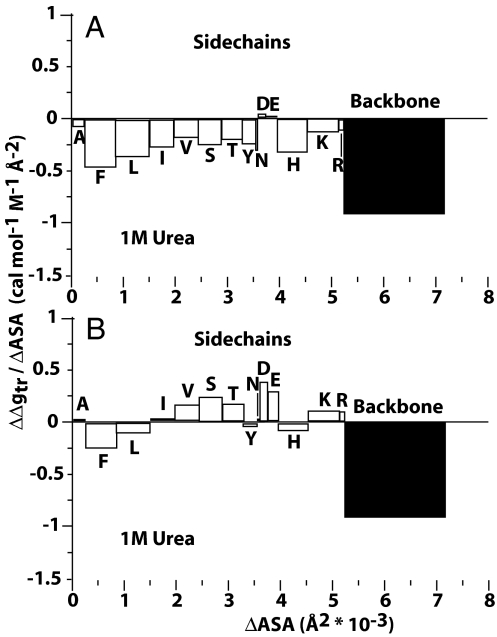
Because the transfer model gives detailed information on the groups that become newly exposed on urea-induced unfolding, it is possible to reveal the sources and amounts of free energy arising from solvent exposure of individual parts of the protein undergoing denaturation. Fig. 5 displays the free energy of groups newly exposed on urea-induced denaturation of histoactophilin. The abscissa gives the surface areas of the groups that become newly exposed on urea-induced denaturation. The ordinate is the free energy contribution per square ångström of the individual protein groups, with the corresponding areas representing the free energy contribution of that type group to the overall predicted m value. The algebraic sum of all free energy contributions in the panel equals the predicted m value for the protein.
Fig. 5.
Side-chain and backbone m value contributions (ΔΔgtr) divided by their respective contribution to ΔASA (cal·mol−1·M−1·Å−2) as a function of total surface area newly exposed on denaturation of histoactophilin. Open bars are for side chains, and black bars are for peptide backbone units. The contributions were calculated by using GTFEtr,iapp (A) and GTFE*tr,i (B).
Discussion
Transfer free energy measurements are sources of the concepts that urea denatures proteins through its favorable interactions with nonpolar groups and through its favorable interaction with peptide backbone (1, 3, 19). Recently, other techniques have been used to assess urea's interactions with protein groups in an attempt to account for its denaturing action. Molecular dynamics simulations of proteins in urea indicate that urea interacts with exposed polar groups by means of hydrogen bonding (20–22). The potential of mean force approach of O'Brien et al. (8) suggested that hydrophobic association is not significantly changed by urea and that urea's denaturing action is due to its direct interaction with the peptide backbone. And by using preferential interaction and parameterization methods, Record and coworkers (7, 23, 24) concluded that dominant interaction of urea is with the polar amide surface of proteins, and interactions with nonpolar and anionic side chains are an order of magnitude smaller. The results described here are in substantial agreement with these more recent conclusions.
In principle, the transfer model proposed by Tanford enables identification and dissection of the free energy contributions of those parts of the protein participating in the denaturant-induced transition. Such an understanding of protein–solvent interactions has been a goal in protein science since the 1930s (25). The model provides a framework for understanding denaturants and predicting protein stability, but only if several assumptions and conditions are met. Chief among these assumptions is that the free energy of protein transfer from water to denaturing solvent consists of a simple sum of the transfer free energies of solvent-exposed parts of the protein. Of course, even if additivity does hold, the model will only be as successful as the accuracy of the side-chain and backbone transfer free energies used, and the ability to evaluate solvent exposure of the native and denatured species. The inability of Tanford to obtain adequate side-chain and backbone transfer free energy values from water to urea solution and the lack of tools to evaluate solvent exposure of native and denatured protein resulted in protein stability predictions that failed at the time to compete with the success of the less enlightening denaturant binding and linear extrapolation models (3, 26).
Subsequent development of computational methods for evaluating the solvent exposure of native and denatured protein (16, 17, 27), and for evaluating the peptide backbone transfer free energies that exhibit additivity and are independent of the chemical model (13), improved chances for successfully applying the transfer model. Still, as seen in Fig. 2A, the model failed in prediction of the m values for urea-induced denaturation of proteins. Better evaluation of side-chain transfer free energies was lacking. In theory, the transfer free energies of the side chains can be obtained by subtracting the transfer free energy of glycine from the transfer free energy of each side-chain-containing amino acid (1). In practice, in the past, the activity coefficient ratio of glycine in 1 M urea and water was not accounted for, which resulted in reported side-chain transfer free energies some 40 cal·mol−1·M−1 more favorable than they actually are. Use of the corrected side-chain transfer free energies (GTFE*tr,i) in applying the transfer model results in one-to-one correspondence between predicted and experimental m values for a wide variety of monmeric proteins reversibly denatured by urea. This result, shown in Fig. 2B, provides strong evidence that the newly determined side-chain and backbone GTFEs are markedly improved over those used in the past, and that group additivity holds to a significant degree.
Although GTFE*tr,i values correctly account for the free energy of glycine transfer, the transfer free energies of the side-chain-containing amino acids remain apparent because of the unavailability of activity coefficients for side-chain-containing amino acids in water and urea. Why then should the GTFE*tr,i values result in as good agreement between predicted and experimental m values as shown? It is clear from the transfer model that the m value depends on contributions only from groups buried in the native state that become newly exposed on denaturation. Such groups are mostly hydrophobic, with solubilities significantly lower than that of glycine. As the solubility limit of a compound decreases, its activity coefficient converges toward unity, and the activity coefficient ratios converge to unity well before the individual activity coefficients do (28). Thus, it appears that the activity ratio terms (Eq. 2) for such residues tend to zero, and that GTFE*tr,i values adequately define the side-chain group transfer free energies of the newly exposed side chains. Still, improvements in the transfer model are possible with knowledge of amino acid activity coefficients in water and 1 M urea.
The proteins used in this study were drawn from those reported in studies by Myers et al. and Hong et al., along with some we added (7, 29–35). The m values depend on salt concentration and pH, so only those proteins are included that are monomeric, denature reversibly in the presence of urea at neutral pH and moderate salt, exhibit two-state behavior, and contain no cofactor or metal ion. It is evident that m values of some of the proteins deviate from the identity line in Fig. 2B. This deviation may be due to a variety of factors including deviation from two-state behavior, some degree of nonadditivity, inaccuracies in GTFE*tr,i values, inaccurate experimental m values, unaccounted m value dependence on salt, and a urea-denatured state that differs from the model used here. Although many potential factors could cause deviations or failure in agreement between predicted and experimental m values, the strong one-to-one agreement observed in Fig. 2B suggests that deviations from these sources are modest and random.
The denatured state model we have used (originally suggested by Schellman) has solvent-exposed surface area half-way between the upper- and lower-bound models of Creamer et al. (16–18). In Fig. 3, comparison of the results from use of the upper- and lower-bound models with results of Schellman's denatured state model shows that Schellman's model coincides so well with the identity line over the full set of data that it may be considered a consensus model for urea denaturation. What is lacking, however, is a dimensional and physical description of Schellman's denatured state model. In terms of surface area, Goldenberg (36) has recently shown that his self-avoiding random-coil denatured state model is itself half-way between the upper- and lower-bound models of Creamer et al. (16, 17), suggesting the physical description of a self-avoiding random coil for the thermodynamic denatured state model of Schellman (18).
Fig. 5 provides a graphical description of the predicted m value of histoactophilin, dissected into individual m value contributions of specific side-chain and backbone groups newly exposed on unfolding. Fig. 5A shows the individual m value contributions of newly exposed groups by using GTFEtr,iapp values, quantities uncorrected for the glycine activity coefficient ratio. Many of these quantities were reported in 1963 and later (1, 4). Fig. 5A provides such information for urea-induced denaturation of histoactophilin by using GTFEtr,iapp values. It is seen that newly exposed side chains and peptide backbone favorably interact with urea, giving the interpretation that both side chains and backbone are responsible for the ability of urea to denature proteins. When GTFE*tr,i values are used instead, the results (see Fig. 5B) change markedly and provide no evidence of collective favorable interaction between nonpolar groups and urea. Although not all nonpolar side chains are represented in histoactophilin, proteins with an array of buried nonpolar side chains show little or no net m value contributions from nonpolar groups. It is clear from the algebraic sum of side-chain contributions that, overall, side chains contribute unfavorably to denaturation and the favorable urea–backbone interaction exclusively drives urea-induced denaturation.
The GTFE*tr,i values markedly change interpretation and understanding of urea-induced denaturation of proteins in two ways. First, the reevaluated side-chain GTFEs no longer exhibit the highly favorable interactions between urea and nonpolar groups as concluded in the 1960s. Second, the dissection of the newly exposed groups on denaturation and their energy contributions to the m value provide detailed information on the origin of cooperative urea-induced unfolding of proteins. The groundbreaking work of Myers et al. (34) shows that experimental m values are proportional to the change in surface area on urea-induced protein unfolding. The transfer model puts a finer point on the observation by showing that newly exposed surface areas are not at all equal in the free energy they contribute toward protein unfolding. The peptide backbone contributes only ≈25% to the change in surface area on protein unfolding, but in terms of free energy it is entirely responsible for driving urea-induced unfolding of a protein. Importantly, newly exposed side chains contribute ≈75% of change in surface area on protein unfolding, but actually oppose denaturation by urea to a modest degree.
The original premise of Cohn, Edsall, and Tanford was that by knowing the transfer free energies of the individual parts of a protein and summing these contributions, one could predict thermodynamic behavior of proteins in the presence of different solvents/solutes (2, 25, 37). The result presented here shows that their original idea holds to a high degree.
Materials and Methods
Methods for determining the solubility ratios of amino acids and model compounds are well established, with the results of these ratios reported as transfer free energies from water to urea solutions (1, 4, 28, 38). As mentioned previously, because activity coefficient contributions to the transfer free energy of amino acid or model compounds were considered to be small or insignificant and were ignored (1), the transfer free energies based on solubility ratios alone must be considered apparent transfer free energies. Historically, side-chain GTFEs were obtained by subtraction of the apparent transfer free energy of glycine from that of each of the remaining amino acids to obtain the water-to-urea apparent GTFEs of each side chain, GTFEtr,iapp values.
Here, we use activity coefficient results from Rafflenbeul et al. (14) for glycine transfer from water to 1 M urea to obtain the standard state transfer free energy for glycine, ΔGtr,Gly°. Extraction of molar activity coefficients of glycine in water and 1 M urea requires use of multiple terms and fitting coefficients of a polynomial expression, the details of which are given in SI Appendix. Subtraction of ΔGtr,Gly° from the apparent transfer free energies of the remaining amino acids gives a new set of GTFEs, GTFE*tr,i values. In conjunction with the transfer model, GTFE*tr,i and GTFEtr,iapp values reported in SI Appendix were used to predict the m values for urea-induced denaturation of proteins presented in this report. Details of the predictions are given in the SI Appendix.
Rafflenbeul et al. (14) also provide data for extraction of the standard state transfer free energy of alanine from water to 1 M urea, ΔG°tr,Ala, by using the methods illustrated in the SI Appendix. The standard state GTFE for the methyl group, obtained by the subtraction, ΔG°tr,Ala − ΔGtr,Gly°, is presented in the GTFE*tr,i table in SI Appendix.
Supplementary Material
Acknowledgments
We thank Drs. George Rose, R. L. Baldwin, and Jörg Rösgen for reading and commenting on the manuscript. This work was supported by National Institutes of Health Grant GM49760.
Abbreviation
- GTFE
group transfer free energy.
Footnotes
The authors declare no conflict of interest.
This article is a PNAS Direct Submission.
This article contains supporting information online at www.pnas.org/cgi/content/full/0706251104/DC1.
References
- 1.Nozaki Y, Tanford C. J Biol Chem. 1963;238:4074–4081. [PubMed] [Google Scholar]
- 2.Tanford C. J Am Chem Soc. 1964;86:2050–2059. [Google Scholar]
- 3.Tanford C. Adv Protein Chem. 1970;24:1–95. [PubMed] [Google Scholar]
- 4.Wang A, Bolen DW. Biochemistry. 1997;36:9101–9108. doi: 10.1021/bi970247h. [DOI] [PubMed] [Google Scholar]
- 5.Kauzmann W. Adv Protein Chem. 1959;14:1–63. doi: 10.1016/s0065-3233(08)60608-7. [DOI] [PubMed] [Google Scholar]
- 6.Wetlaufer DB, Malik SK, Stoller L, Coffin RL. J Am Chem Soc. 1964;86:508–514. [Google Scholar]
- 7.Hong J, Capp MW, Saecker RM, Record MT., Jr Biochemistry. 2005;44:16896–16911. doi: 10.1021/bi0515218. [DOI] [PMC free article] [PubMed] [Google Scholar]
- 8.O'Brien EP, Dima RI, Brooks B, Thirumalai D. J Am Chem Soc. 2007;129:7346–7353. doi: 10.1021/ja069232+. [DOI] [PubMed] [Google Scholar]
- 9.Robinson DR, Jencks WP. J Am Chem Soc. 1965;87:2470–2479. doi: 10.1021/ja01089a029. [DOI] [PubMed] [Google Scholar]
- 10.Abeles RH, Frey PA, Jencks WP. Biochemistry. Boston: Jones and Bartlett; 1992. [Google Scholar]
- 11.Creighton TE. Proteins: Structures and Molecular Properties. New York: Freeman; 1993. [Google Scholar]
- 12.Fersht A. Structure and Mechanism in Protein Science. New York: Freeman; 1998. [Google Scholar]
- 13.Auton M, Bolen DW. Biochemistry. 2004;43:1329–1342. doi: 10.1021/bi035908r. [DOI] [PubMed] [Google Scholar]
- 14.Rafflenbeul L, Pang W-M, Schönert H, Haberle K. Z Naturforsch. 1973;28:533–554. [PubMed] [Google Scholar]
- 15.Auton M, Bolen DW. Proc Natl Acad Sci USA. 2005;102:15065–15068. doi: 10.1073/pnas.0507053102. [DOI] [PMC free article] [PubMed] [Google Scholar]
- 16.Creamer TP, Srinivasan R, Rose GD. Biochemistry. 1995;34:16245–16250. doi: 10.1021/bi00050a003. [DOI] [PubMed] [Google Scholar]
- 17.Creamer TP, Srinivasan R, Rose GD. Biochemistry. 1997;36:2832–2835. doi: 10.1021/bi962819o. [DOI] [PubMed] [Google Scholar]
- 18.Schellman JA. Biophys J. 2003;85:108–125. doi: 10.1016/S0006-3495(03)74459-2. [DOI] [PMC free article] [PubMed] [Google Scholar]
- 19.Robinson DR, Jencks WP. J Am Chem Soc. 1965;87:2462–2470. doi: 10.1021/ja01089a028. [DOI] [PubMed] [Google Scholar]
- 20.Bennion BJ, Daggett V. Proc Natl Acad Sci USA. 2003;100:5142–5147. doi: 10.1073/pnas.0930122100. [DOI] [PMC free article] [PubMed] [Google Scholar]
- 21.Caflisch A, Karplus M. Structure (London) 1999;7:477–488. doi: 10.1016/s0969-2126(99)80064-1. [DOI] [PubMed] [Google Scholar]
- 22.Tirado-Rives J, Orozco M, Jorgensen WL. Biochemistry. 1997;36:7313–7329. doi: 10.1021/bi970096i. [DOI] [PubMed] [Google Scholar]
- 23.Courtenay ES, Capp MW, Record MT., Jr Protein Sci. 2001;10:2485–2497. doi: 10.1110/ps.ps.20801. [DOI] [PMC free article] [PubMed] [Google Scholar]
- 24.Courtenay ES, Capp MW, Saecker RM, Record MT., Jr Proteins Suppl. 2000;4:72–85. doi: 10.1002/1097-0134(2000)41:4+<72::aid-prot70>3.0.co;2-7. [DOI] [PubMed] [Google Scholar]
- 25.Cohn EJ, McMeekin TL, Edsall JT, Weare JH. J Am Chem Soc. 1934;56:2270–2282. [Google Scholar]
- 26.Pace CN. CRC Crit Rev Biochem. 1975;3:1–43. doi: 10.3109/10409237509102551. [DOI] [PubMed] [Google Scholar]
- 27.Lee B, Richards FM. J Mol Biol. 1971;55:379–400. doi: 10.1016/0022-2836(71)90324-x. [DOI] [PubMed] [Google Scholar]
- 28.Auton M, Bolen DW. Methods Enzymol. doi: 10.1016/S0076-6879(07)28023-1. in press. [DOI] [PubMed] [Google Scholar]
- 29.Auton M, Cruz MA, Moake J. J Mol Biol. 2007;366:986–1000. doi: 10.1016/j.jmb.2006.10.067. [DOI] [PubMed] [Google Scholar]
- 30.Baskakov IV, Bolen DW. Protein Sci. 1999;8:1314–1319. doi: 10.1110/ps.8.6.1314. [DOI] [PMC free article] [PubMed] [Google Scholar]
- 31.Holthauzen LM, Bolen DW. Protein Sci. 2007;16:293–298. doi: 10.1110/ps.062610407. [DOI] [PMC free article] [PubMed] [Google Scholar]
- 32.Langdon GM, Jimenez MA, Genzor CG, Maldonado S, Sancho J, Rico M. Proteins. 2001;43:476–488. doi: 10.1002/prot.1059. [DOI] [PubMed] [Google Scholar]
- 33.Mello CC, Barrick D. Protein Sci. 2003;12:1522–1529. doi: 10.1110/ps.0372903. [DOI] [PMC free article] [PubMed] [Google Scholar]
- 34.Myers JK, Pace CN, Scholtz JM. Protein Sci. 1995;4:2138–2148. doi: 10.1002/pro.5560041020. [DOI] [PMC free article] [PubMed] [Google Scholar]
- 35.Wildes D, Anderson LM, Sabogal A, Marqusee S. Protein Sci. 2006;15:1769–1779. doi: 10.1110/ps.062136006. [DOI] [PMC free article] [PubMed] [Google Scholar]
- 36.Goldenberg DP. J Mol Biol. 2003;326:1615–1633. doi: 10.1016/s0022-2836(03)00033-0. [DOI] [PubMed] [Google Scholar]
- 37.Cohn EJ, Edsall JT. Proteins, Amino Acids, and Peptides as Ions and Dipolar Ions. New York: Reinhold; 1943. [Google Scholar]
- 38.Bolen DW. In: Methods in Molecular Biology. Murphy KP, editor. Totowa, NJ: Humana; 2001. pp. 17–36. [Google Scholar]
Associated Data
This section collects any data citations, data availability statements, or supplementary materials included in this article.


