Abstract
Aims
To develop a population pharmacokinetic/pharmacodynamic (PK/PD) model of the hypothalamic–pituitary–gonadal (HPG) axis describing the changes in luteinizing hormone (LH) and testosterone concentrations following treatment with the gonadotropin-releasing hormone (GnRH) agonist triptorelin and the GnRH receptor blocker degarelix.
Methods
Fifty-eight healthy subjects received single subcutaneous or intramuscular injections of 3.75 mg of triptorelin and 170 prostate cancer patients received multiple subcutaneous doses of degarelix of between 120 and 320 mg. All subjects were pooled for the population PK/PD data analysis. A systematic population PK/PD model-building framework using stochastic differential equations was applied to the data to identify nonlinear dynamic dependencies and to deconvolve the functional feedback interactions of the HPG axis.
Results
In our final PK/PD model of the HPG axis, the half-life of LH was estimated to be 1.3 h and that of testosterone 7.69 h, which corresponds well with literature values. The estimated potency of LH with respect to testosterone secretion was 5.18 IU l−1, with a maximal stimulation of 77.5 times basal testosterone production. The estimated maximal triptorelin stimulation of the basal LH pool release was 1330 times above basal concentrations, with a potency of 0.047 ng ml−1. The LH pool release was decreased by a maximum of 94.2% by degarelix with an estimated potency of 1.49 ng ml−1.
Conclusions
Our model of the HPG axis was able to account for the different dynamic responses observed after administration of both GnRH agonists and GnRH receptor blockers, suggesting that the model adequately characterizes the underlying physiology of the endocrine system.
Keywords: population PK/PD modelling, hypothalamic–pituitary–gonadal axis, systematic PK/PD model building framework, NONMEM, GnRH agonist triptorelin, GnRH receptor blocker degarelix
Introduction
Prostate cancer is second only to lung cancer as a leading cause of cancer mortality and morbidity among men in the industrialized world [1, 2]. A widely recognized feature of prostate cancer is its high sensitivity to androgen deprivation. This may be achieved in several ways, for example by bilateral orchiectomy, by administration of oestrogens, or by administration of gonadotropin-releasing hormone (GnRH) analogues. The aim of prostate cancer treatment is to suppress and maintain the serum testosterone concentration to castrate levels, i.e. < 0.5 ng ml−1.
The potency of GnRH and its analogues as stimulators or inhibitors of pituitary gonadotropin secretion has made them highly useful in the therapy of sex hormone-dependent tumours. Prostate cancer patients have for many years been treated with GnRH agonists [3], because the use of GnRH receptor blockers has been limited by their short duration of action and their histamine-mediated side-effects [4]. The pharmacodynamic profiles after treatment with GnRH agonists and GnRH receptor blockers are very different. The former have the disadvantage of producing an initial flare-up effect in luteinizing hormone (LH) secretion, causing a testosterone surge [5], whereas the latter block the pituitary GnRH receptors, resulting in immediate medical castration [4, 6, 7].
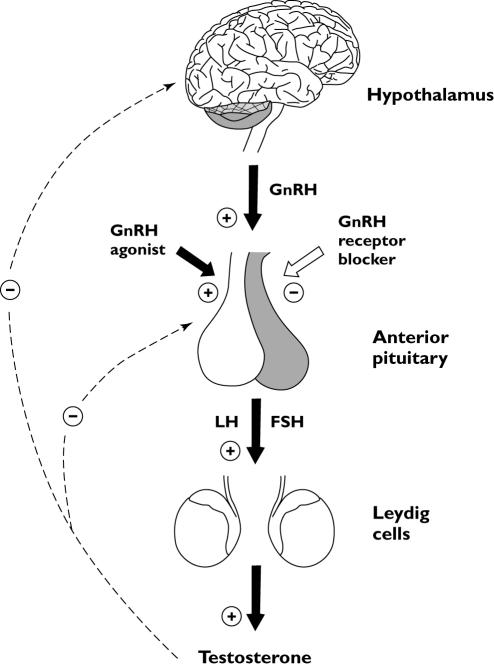
The complex regulatory behaviour of the hypothalamic–pituitary–gonadal (HPG) axis (see Figure 1) has been modelled by others [8–12]. Thus far, only a small number of pharmacokinetic/pharmacodynamic (PK/PD) models of the HPG axis after administration of GnRH analogues have linked the time course of drug concentration to its effect on LH and testosterone [13–15], and even fewer have incorporated the complex regulatory behaviour of the HPG axis [16]. No PK/PD model has described and predicted the response of LH and testosterone after treatment with both a GnRH agonist and a GnRH receptor blocker in one combined model. Attempting to model a highly nonlinear regulatory feedback system such as the HPG axis requires the use of advanced techniques. This paper describes a systematic population PK/PD model-building framework using stochastic differential equations (SDEs) to identify the nonlinear dynamic dependencies in the HPG axis [17, 18].
Figure 1.
Schematic representation of the male hypothalamic–pituitary–gonadal (HPG) axis. The solid black arrows represent stimulation and the white arrow illustrates inhibition by the gonadotropin-releasing hormone (GnRH) receptor blocker. The dotted lines represent the negative feedback control of the HPG axis
The main objective of the present analysis was to develop a population PK/PD model of the HPG axis, which enables the description and prediction of the effect on LH and testosterone following treatment with the GnRH agonist triptorelin [19, 20] and the GnRH receptor blocker degarelix [21–24]. Both classes of drug act on the same physiological system and, hence, the model of the HPG axis should be based on a mechanistic understanding of drug action and the underlying physiology of the endocrine system. The benefits of a combined PK/PD model of the HPG axis are that it facilitates predictions of new dosing regimens for all drugs acting on the same underlying physiological system, that it can be used to test hypotheses of mechanisms of drug action, and that it summarizes the current state of knowledge about the HPG axis.
Materials and methods
Study designs
The studies were performed in accordance with the Declaration of Helsinki and according to Good Clinical Practice (GCP). The appropriate independent ethics committee approved the protocols prior to the start of the study. Written informed consent was obtained from all subjects before participation. The triptorelin and degarelix study designs and demographic characteristics are summarized in Table 1 and Table 2.
Table 1.
Summary of triptorelin and degarelix studies used in the population PK/PD data analysis
| Study | Administration* | Dose† | Subjects | PK samples‡ | LH samples‡ | Te samples‡ |
|---|---|---|---|---|---|---|
| Triptorelin | Single dose | Total | 58 HS | 1152 (35) | 1330 (0) | 1300 (0) |
| s.c. | 3.75 mg | 30 HS | 584 (17) | 672 (0) | 659 (0) | |
| i.m. | 3.75 mg | 28 HS | 508 (18) | 658 (0) | 641 (0) | |
| Degarelix | Repeated dose | Total | 170 PC | 4404 (22) | 4826 (207) | 4827 (233) |
| s.c. (12) | 120@20 | 24 PC | 526 (3) | 592 (13) | 591 (34) | |
| s.c. (10) | 120@40 | 12 PC | 257 (1) | 277 (6) | 277 (14) | |
| s.c. (9) | 160@40 | 12 PC | 233 (0) | 249 (0) | 250 (3) | |
| s.c. (4) | 200@40 | 24 PC | 827 (6) | 900 (36) | 900 (64) | |
| s.c. (4) | 200@60 | 24 PC | 525 (0) | 580 (10) | 579 (8) | |
| s.c. (4) | 240@40 | 23 PC | 777 (4) | 828 (62) | 828 (58) | |
| s.c. (3) | 240@60 | 24 PC | 555 (1) | 607 (37) | 607 (12) | |
| s.c. (3) | 320@60 | 27 PC | 704 (7) | 793 (43) | 795 (30) |
Route of administration with average number of degarelix administrations at each dose level.
The notation ‘120@20’ represents a dose of 120 mg using a 20 mg ml−1dosing solution.
The numbers in parentheses are the number of samples below LLOQ. PK, Pharmacokinetic; LH, luteinizing hormone; Te, testosterone; HS, healthy subjects; PC, prostate cancer patients; s.c., subcutaneous administration; i.m., intramuscular administration.
Table 2.
Demographic characteristics of the subjects studied
| Characteristic | Triptorelin study | Degarelix study |
|---|---|---|
| Population | Healthy subjects | Prostate cancer patients |
| No. of subjects | 58 | 170 |
| Age (years) | 41 (20–74) | 73 (19–89) |
| Weight (kg) | 80 (60–111) | 78 (45–117) |
| Height (m) | 1.79 (1.67–1.97) | 1.73 (1.50–1.96) |
| BMI (kg m−2) | 25.1 (19.4–29.4) | 25.9 (17.4–40.9) |
Values are presented as median and range where appropriate. BMI, Body mass index.
Triptorelin study
The triptorelin study had a single-dose, unblinded, randomized, parallel-group design, with the aim of investigating the PK, PD and tolerability of Decapeptyl Depot® following single subcutaneous (s.c.) or intramuscular (i.m.) injections of 3.75 mg. A total of 58 healthy males were randomized into two treatment groups, with 30 subjects in the s.c. group and 28 in the i.m. group.
Blood samples were collected prior to dose administration and at 0.25, 1, 2, 3, 4, 8, 12 and 24 h and 2, 4, 7, 14, 21, 28, 35, 42, 49, 56 and 70 days post dose. A sample was also collected on days 84 and 98 and at 2-week intervals, if the testosterone concentration had not returned to within the physiological range.
Degarelix study
The degarelix study had an open-label, multicentre, parallel and sequential, ascending repeated-dose design with the aim of investigating the PK, PD and adverse effects of degarelix in prostate cancer patients.
A total of 170 patients received initial loading doses of between 120 and 320 mg in an injected solution of 20–60 mg ml−1. Patients were followed until the criterion for insufficient testosterone suppression (i.e. testosterone concentrations >0.5 ng ml−1) was met, before a maintenance dose identical to their loading dose was administered. Patients were withdrawn from the study if their testosterone concentration was >1.0 ng ml−1 2 weeks postdosing and afterwards, or if their testosterone concentration was between 0.5 and 1.0 ng ml−1 at two consecutive visits from 4 weeks postdosing and afterwards.
Blood samples were taken prior to drug administration and at 3 h and 1, 2, 3, 7, 14, 21, 28, 35, 42, 49 and 56 days post dose and once weekly until the withdrawal criterion was met.
Analytical methods
Triptorelin and degarelix plasma concentrations were measured according to Good Laboratory Practice (GLP), the methods being validated according to current guidelines for bioanalytical samples [25].
Degarelix was measured by automated protein precipitation using a TECAN robot through the addition of a mixture of ethanol and acetonitrile to the plasma samples (using ethylenediaminetetraacetic acid as the anticoagulant), which were then analysed by liquid chromatography with tandem mass spectrometric detection (LC-MS/MS). A Zorbax Eclipse XDB-C18 reversed-phase column (2.1 × 50 mm, 5 µm) and a mobile phase of ammonium formate and acetonitrile were used. Mass spectrometry was performed using an API 4000 using TurboIonSpray with multiple reaction monitoring in the positive ion mode [21]. The lower limit of quantification (LLOQ) of degarelix was 0.5 ng ml−1 and the intra- and interassay precisions [expressed as coefficients of variation (CV)] were ≤7.5% and ≤14.1%, respectively. The accuracy was within ±3%. Triptorelin was measured using a radioimmunoassay described in detail elsewhere [26, 27]. The LLOQ of triptorelin was 0.01 ng ml−1 and the intra- and interassay precisions were ≤8.2% and ≤7.5%, respectively. The accuracy was within ±11%.
The LH assay was measured using Microparticle Enzyme Immunoassay (MEIA) technology (Abbott Laboratories, Abbott Park, IL, USA). The LLOQ of LH was 0.1 IU l−1 and the intra- and interassay precisions were ≤5.7% and ≤5.3%, respectively. The accuracy was within ±11%. Total serum testosterone concentrations were measured according to GLP by LC-MS/MS after solid-phase extraction. The LLOQ of the assay was 0.05 ng ml−1 and the intra- and interassay precision were ≤15.8% and ≤14.1%, respectively. The accuracy was within ±8%. Further details of the LH and testosterone assays are given elsewhere [28–30].
Data analysis
Nonlinear mixed-effects modelling was performed using NONMEM version V and VI beta [31]. The first-order conditional estimation (FOCE) method was used throughout the PK/PD model building using the subroutine ADVAN5 (general linear kinetics) for the PK analysis and the subroutine ADVAN8 (general nonlinear kinetics with stiff equations) for the PD analysis. Three significant digits were requested for the final PK and PD parameter estimates. The tolerance of the differential equation solver used in the PD analysis was set to 10 due to the high degree of nonlinearity in the model.
The PK/PD data analysis was performed sequentially. The PK model was first fitted to the data, and the individual predicted plasma concentrations were subsequently used as input using linear interpolation between sampling times for the simultaneous PD modelling of LH and testosterone.
Two methods were used to manage drug and hormone concentrations below the LLOQ in the estimation of model parameters because of the different concentration–time profiles. The first time a drug concentration measurement was below the LLOQ, it remained so for the remainder of the study, whereas the LH and testosterone measurements fluctuated around the LLOQ throughout the study. Thus, plasma triptorelin and degarelix concentration measurements below the LLOQ were omitted (method M1 in [32]), whereas LH and testosterones below the LLOQ were set at LLOQ/2 (method M5 in [32]).
Residual variability
To obtain homogeneity of the intraindividual (residual) error variance for the PK/PD data analysis, an additive residual error model corresponding to a constant coefficient of variation (CV) model on the untransformed scale was used.
Interindividual variability
The interindividual variability (IIV) model was assumed to follow a log-normal distribution using an exponential model.
Model discrimination
Model selection was based on physiological understanding of the HPG axis and graphical analysis using basic goodness-of-fit (GOF) plots of, for example, individual and population predictions vs. time, observed concentrations and weighted residuals. The difference in the objective function value (OFV) produced by NONMEM was used to discriminate between hierarchical (nested) models using the likelihood ratio test (LRT).
Pharmacokinetic models
Triptorelin
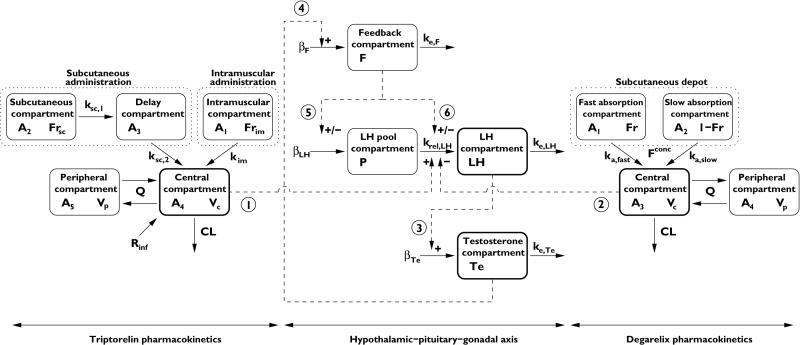
A combined zero- and first-order absorption model was applied to describe the release profile of depot-formulated triptorelin. A fraction of the dose is rapidly released from the injected microparticles in an initial burst within the first 24 h, modelled as an apparent zero-order input rate Rinf with estimation of the duration of infusion τ. Subsequently, triptorelin is released slowly from the depot with differences in the absorption profile between s.c and i.m. administration. S.c. administered triptorelin is believed to be absorbed into the lymph before it enters the systemic circulation, modelled using a s.c. site of injection and absorption delay compartment. I.m. administered triptorelin does not show the same delay in absorption and was adequately modelled by first-order absorption. The disposition of triptorelin was described by a two-compartment model (Figure 2).
Figure 2.
Schematic illustration of the PK/PD model of the hypothalamic–pituitary–gonadal axis following treatment with the gonadotropin-releasing hormone (GnRH) agonist triptorelin and the GnRH receptor blocker degarelix. Compartments with thick black lines are those where data are available. Interactions are symbolized by dashed lines, where ‘+/–’ indicates a positive or negative interaction, respectively. The dotted lines represent a drug depot. The model parameters and numbered interactions are explained in the text
Degarelix
Degarelix is released from the self-forming SC depot in two phases, namely a rapid release immediately after dosing accounting for the high initial plasma concentrations, and a prolonged slow-release phase that determines plasma concentrations in the maintenance phase [21, 33]. A two-compartment disposition model with two first-order absorption components was used to describe the concentration-time profiles of SC administered degarelix [34] (Figure 2).
Pharmacodynamic modelling framework
The differential equations governing the hormonal system of the HPG axis are derived from the principles of mass balance for LH and testosterone. The rate of change of hormone i is equal to the rate of secretion minus the rate of elimination, i.e.
| (1) |
where Xi is concentration of hormone i, ri symbolizes the total hormone secretion rate and ke,i is the first-order elimination rate constant. The volume of distribution of a given hormone was assumed to be constant over time and hence the secretion rates were estimated as a function of volume of distribution.
The total hormone secretion rate ri is assumed to consist of a constant basal rate of secretion βi and a nonbasal secretion Hi regulated by the feedback signals from the HPG axis. Thus,
| (2) |
where the nonbasal secretion Hi(·) is estimated as the relative change to the basal secretion rate βi. The nonbasal secretion Hi(·) depends on a feedback interaction from one or more hormones in the system through nonlinear functions.
Deconvolution of feedback interactions
In order to capture the in vivo dynamics of the HPG axis following exposure to a GnRH agonist or a GnRH receptor blocker, several different feedback hormone interactions should be accounted for. The complex multivariate closed-loop system of LH and testosterone consists of several feedback interactions and cannot be modelled sequentially due to the interdependence of the two hormones. Therefore, a systematic population PK/PD model-building framework using SDEs was applied to identify the complex nonlinear dynamic dependencies of the HPG axis and to deconvolve the functional relationships between the drug, LH and testosterone (Appendix A).
Results
The population parameter estimates from the final triptorelin and degarelix PK models are summarized in Table 3, together with the corresponding relative standard error (RSE) estimates. The model parameters were measured with good precision and all RSE estimates [expressed as CV(%)] were < 35%. The GOF plots of the final PK models are shown in Figures 4, 5 and 7.
Table 3.
Estimated population pharmacokinetic parameters for the gonadotropin-releasing hormone (GnRH) agonist triptorelin and the GnRH receptor blocker degarelix
| Population mean | IIV | ||||
|---|---|---|---|---|---|
| Parameter | Unit | Estimate | (RSE, %) | CV (%) | (RSE, %) |
| Triptorelin pharmacokinetic parameters | |||||
| t1/2,im | (days) | 17.0 | (7.72) | 15.5 | (34.6) |
| t1/2sc,1 | (days) | 11.3 | (9.78) | 34.0 | (21.3) |
| t1/2,sc,2 | (days) | 7.92 | (17.9) | 61.6 | (25.2) |
| CL/F | (l h−1) | 63.2 | (4.13) | 21.6 | (10.4) |
| Q/F | (l h−1) | 76.3 | (10.5) | – | – |
| Vc/F | (l) | 640 | (5.77) | 32.9 | (14.1) |
| Vp/F | (l) | 698 | (7.95) | – | – |
| Fr | (–) | 0.605 | (2.08) | 6.60* | (27.6) |
| t | (h) | 1.77 | (4.45) | – | – |
| Base | (ng ml−1) | 0.0107 | (5.02) | – | – |
| σprop | (%) | 27.8 | (4.78) | – | – |
| Degarelix pharmacokinetic parameters | |||||
| t1/2,fast | (days) | 1.98 | (6.17) | – | – |
| (days) | 53.3 | (9.47) | 43.9 | (7.30) | |
| (days) | 73.7 | (4.74) | 44.4 | (7.30) | |
| (days) | 95.4 | (7.60) | 44.6 | (7.30) | |
| CL | (L/ h) | 2.54 | (5.43) | 28.1 | (9.61) |
| Q | (L/ h) | 6.59 | (7.36) | – | – |
| Vc | (L) | 13.2 | (9.24) | 24.6 | (32.3) |
| Vp | (L) | 36.1 | (4.99) | – | – |
| Fr20 | (–) | 0.129 | (9.46) | 34.9* | (10.5) |
| Fr40 | (–) | 0.0573 | (6.30) | 37.8* | (10.5) |
| Fr60 | (–) | 0.0417 | (8.20) | 38.4* | (10.5) |
| F20 | (–) | 0.397 | (7.71) | 18.4* | (13.4) |
| F40 | (–) | 0.240 | (6.83) | 23.2* | (13.4) |
| F60 | (–) | 0.198 | (8.18) | 24.5* | (13.4) |
| σProp | (%) | 28.7 | (2.53) | – | – |
Approximate interindividual variability (IIV) for logit-transformed parameter, i.e. CV(θ) = (1 − θ)ωθ.
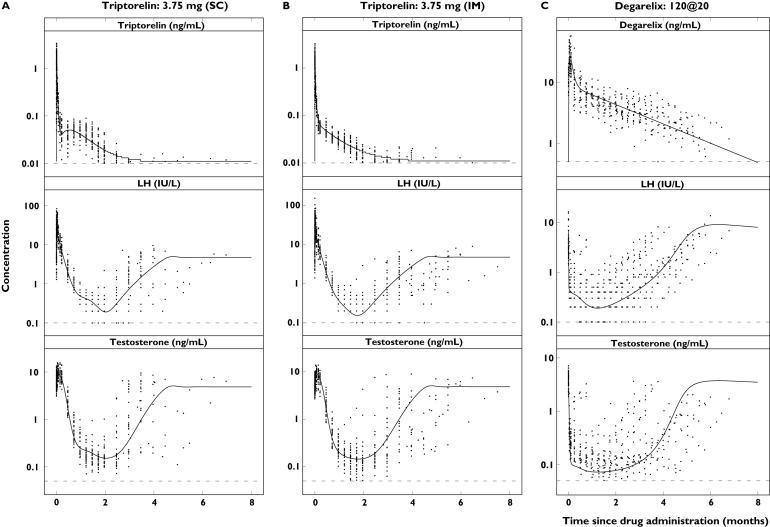
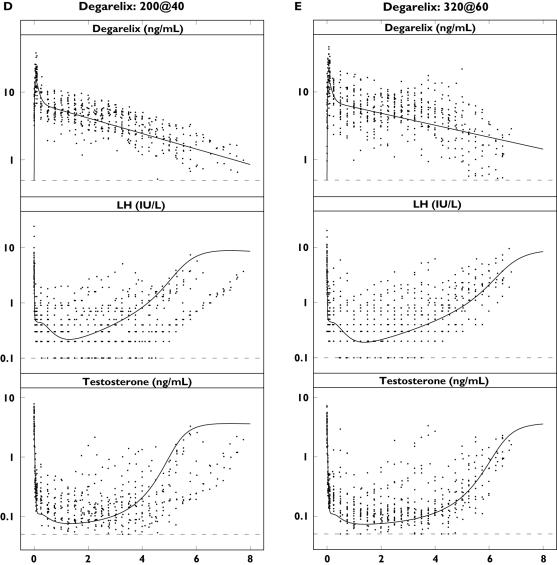
Figure 4.
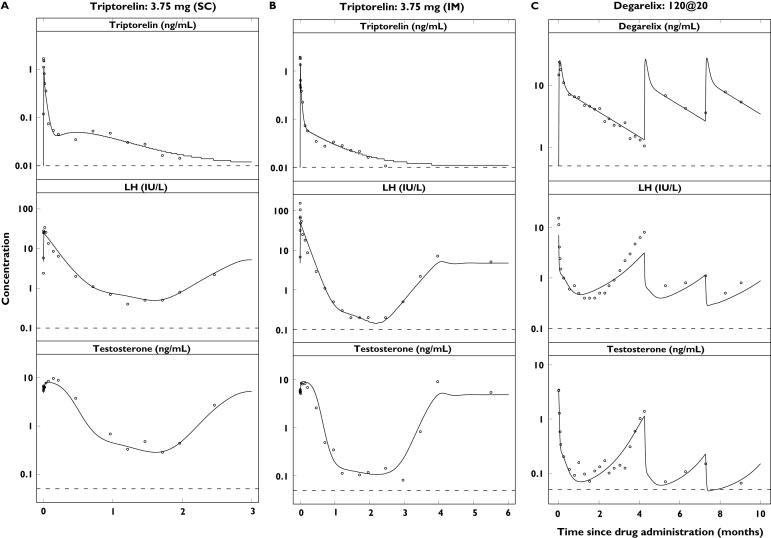
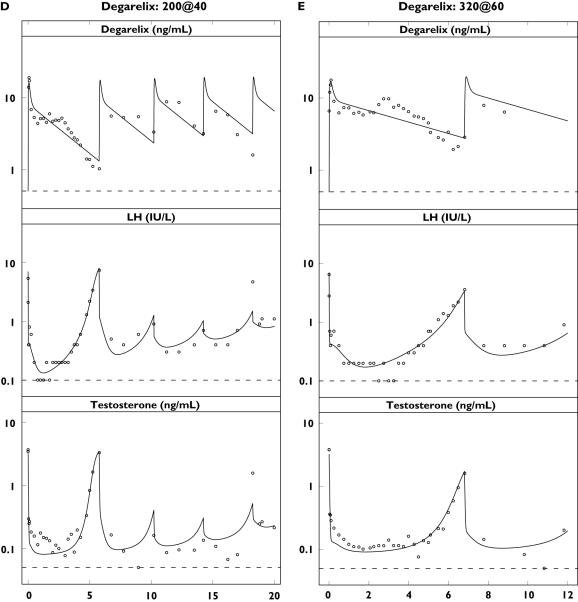
Single-dose concentration–time profiles of triptorelin or degarelix (top), luteinizing hormone (LH) (middle) and testosterone (bottom) in the different dose groups plotted on a semilogarithmic scale. Observations (·) and population predictions (–). The horizontal dashed lines represent the lower limit of quantification (LLOQ) of 0.01 ng ml−1 (triptorelin), 0.5 ng ml−1 (degarelix), 0.1 IU l−1 (LH) and 0.05 ng ml−1 (testosterone)
Figure 5.
Individual concentration–time profiles of the first subject from each dose group in the triptorelin study [3.75 mg subcutaneous (s.c.) and intramuscular (i.m.) administration] and degarelix study plotted on a semilogarithmic scale. Observations (·) and individual predictions (–). PK (top), luteinizing hormone (LH) (middle) and testosterone (bottom). The horizontal dashed lines represent the lower limit of quantification (LLOQ) of 0.01 ng ml−1 (triptorelin), 0.5 ng ml−1 (degarelix), 0.1 IU l−1 (LH) and 0.05 ng ml−1 (testosterone)
Figure 7.
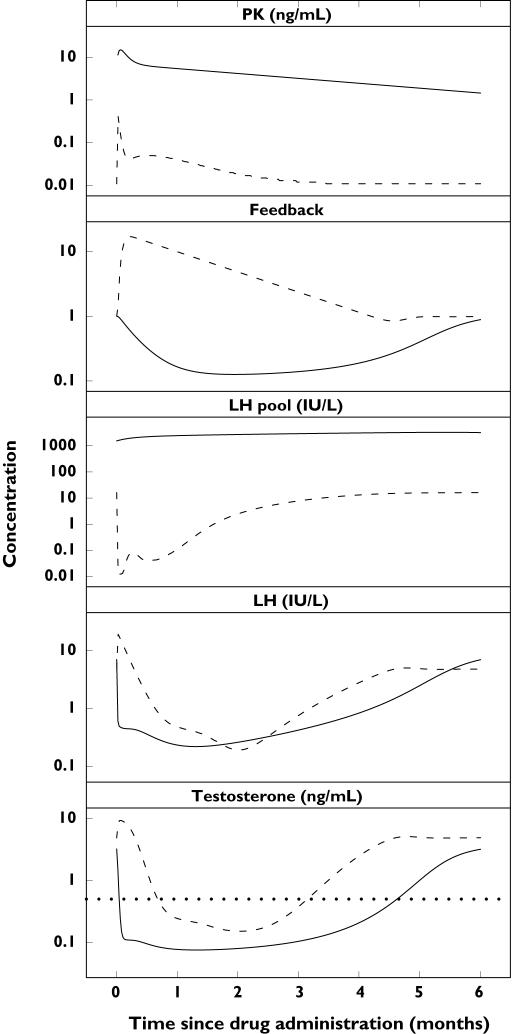
Dynamics of the hypothalamic–pituitary–gonadal axis compartments. Population-predicted drug, feedback, luteinizing hormone (LH) pool, LH and testosterone profiles after single subcutaneous administration of 3.75 mg of the gonadotropin-releasing hormone (GnRH) agonist triptorelin (dashed line) and 200 mg of the GnRH receptor blocker degarelix (solid line). The dotted line represents the castration concentration of 0.5 ng ml−1
Analysis of the PD included LH and testosterone concentration measurements following treatment with the GnRH agonist triptorelin and the GnRH receptor blocker degarelix. The PD models for the two treatments were developed in parallel and subsequently combined when the structural models were approximately the same.
Initial exploratory analysis suggested an expansion of the basic LH model described by Equation 1, with a pool compartment of readily releasable substance mimicking the physiology of peptide hormones. Newly synthesized ones such as LH are encapsulated into secretory granulas that accumulate within the cell. The granulas can either undergo secretory exocytosis by positive feedback from endogenous GnRH, or accumulate within the cell [9]. However, steroid hormones such as testosterone do not accumulate within the cell and the basic model described by Equation 1 was applied.
The final model of the HPG axis that best described LH and testosterone concentrations following treatment with triptorelin and degarelix is illustrated in Figure 2 and described by the following system of ordinary differential equations:
where F, P, LH and Te are the state variables for the feedback, LH pool, LH and testosterone compartments with initial conditions F0, P0, LH0 and Te0, respectively. The parameters β, krel and ke represent the basal secretion rate constant, release rate constant and elimination rate constant, respectively.
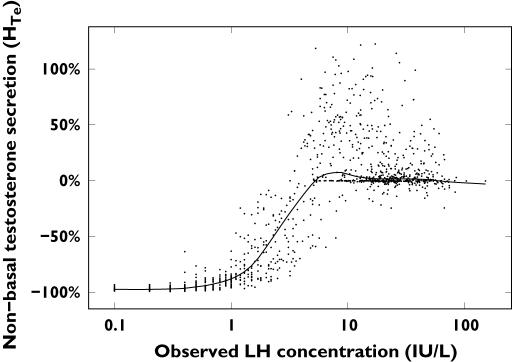
All the feedback interactions Hi(·) in Equations 4–7 were deconvolved using the SDE framework. For illustrative purposes, the estimated nonbasal testosterone secretion  is shown in Figure 3. The nonbasal testosterone secretion is stimulated by circulating LH concentrations, and could be described by a sigmoidal Emax model.
Figure 3.
Estimated changes in the testosterone secretion rate relative to basal testosterone secretion plotted against observed LH concentrations following treatment with the gonadotropin-releasing hormone agonist triptorelin. The regression line is superimposed on the data
Because the pituitary GnRH receptors are the rate-limiting step in the stimulation of LH synthesis and release, and no endogenous GnRH concentration measurements were available, it was not possible to separate these two components in the model. Therefore, the net effect of endogenous GnRH secretion and pituitary GnRH receptors on LH synthesis and release was modelled by an empirical feedback compartment, where the input is driven by the testosterone concentration.
LH synthesis and release was influenced by the feedback compartment and modelled differently during treatment with triptorelin and degarelix due to their different mechanisms of action. The pulsatile stimulation of LH synthesis and release was modelled as a negative and positive interaction from the feedback compartment during treatment with the GnRH agonist and GnRH receptor blocker, respectively. The nonpulsatile stimulation by triptorelin and inhibition by degarelix of the nonbasal LH pool release was modelled using the sigmoidal Emax approach.
Testosterone is also known to exert short-loop negative feedback on LH secretion via the pituitary. This interaction was considered to be less important and therefore not included in the model [34]. The feedback functions Hi(·) in Equations 4–7 were modelled using the equations
with cp,t and cp,d being the individual predicted plasma triptorelin and degarelix concentrations, respectively. By assuming steady-state conditions before drug administration, the basal rates of secretion βi and the initial conditions of the feedback and LH pool compartments (F0 and P0) can be specified by the expressions
 |
whereas the initial LH and testosterone concentrations (LH0 and Te0) were estimated as LHbase and Tebase, respectively.
The population PD parameter estimates and their associated RSE values for the final model of the HPG axis are reported in Table 4. The 30 parameters were estimated with good precision and were all significant at the 95% confidence level. IIV was estimated for the parameters krel,LH, EC50, IC50, δ, ke,F, Lmax and L50.
Table 4.
Simultaneous estimated population pharmacodynamic parameters following treatment with the gonadotropin-releasing hormone (GnRH) agonist triptorelin and the GnRH receptor blocker degarelix
| Population mean | IIV | ||||
|---|---|---|---|---|---|
| Parameter | Unit | Estimate | (RSE, %) | CV (%) | (RSE, %) |
| ke,LH* | (l h−1) | 0.0082 | (1.56) | – | – |
| ke,LH† | (l h−1) | 0.535 | (4.14) | – | – |
| krel,LH | (l h−1) | 0.00241 | (6.36) | 83.4 | (3.25) |
| Emax | (–) | 1330 | (8.58) | – | – |
| EC50 | (ng ml−1) | 0.047 | (5.53) | 32.7 | (13.4) |
| γ | (–) | 4.87 | (3.69) | – | – |
| Imax | (–) | 0.942 | (0.155) | – | – |
| IC50 | (ng ml−1) | 1.49 | (5.04) | 59.5 | (6.44) |
| δ | (–) | 1.97 | (3.45) | 38.9 | (6.73) |
| ke,F* | (l h−1) | 0.00107 | (8.26) | 59.1 | (4.69) |
| ke,F† | (l h−1) | 0.00497 | (4.87) | 59.1 | (4.69) |
| λ* | (–) | 8.26 | (3.65) | – | – |
| λ† | (–) | 0.56 | (1.00) | – | – |
| ke,Te | (l h−1) | 0.0901 | (2.72) | – | – |
| Lmax | (–) | 77.5 | (3.51) | 51.7 | (6.24) |
| L50 | (IU l−1) | 5.18 | (2.98) | 46.0 | (5.42) |
| κ | (–) | 1.9 | (0.836) | – | – |
| LHbase* | (IU l−1) | 4.76 | (1.80) | – | – |
| LHbase† | (IU l−1) | 6.98 | (1.34) | – | – |
| Tebase* | (ng ml−1) | 4.85 | (1.64) | – | – |
| Tebase† | (ng ml−1) | 3.21 | (1.47) | – | – |
| σLH | (%) | 41.9 | (1.00) | – | – |
| σTe | (%) | 49.4 | (0.983) | – | – |
Triptorelin study-specific parameter.
Degarelix study-specific parameter.
The five parameters ke,LH, ke,F, λ, LHbase and Tebase obtained from the separate triptorelin and degarelix PD models were found to be study specific with observed differences in the parameter estimates of up to 100-fold.
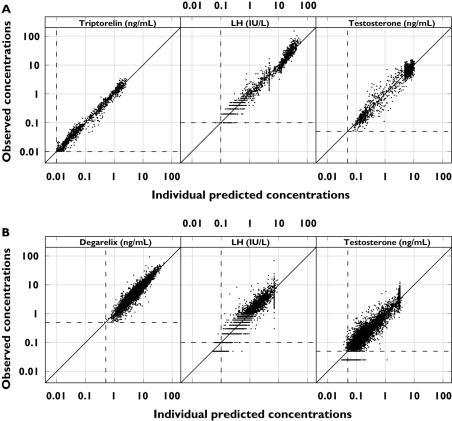
The observed concentration–time profiles of PK, LH and testosterone are shown in Figure 4 for the triptorelin and degarelix studies with the population predictions superimposed. For presentation purposes, only single-dose data are shown due to the individual dosing schedules. The model was able to capture the different rates of onset and offset of drug action observed for the representative subjects in the five dose groups (Figure 5). The different dynamic measurements of the HPG axis compartments (i.e. PK, empirical feedback, LH pool concentration, LH concentration and testosterone concentration) after triptorelin and degarelix administration are superimposed in Figure 6.
Figure 6.
Observed vs. individual predicted drug (left), luteinizing hormone (LH) (middle) and testosterone (right) concentrations plotted on a double-logarithmic scale after treatment with triptorelin (top) and degarelix (bottom). The dashed lines represent the lower limit of quantification (LLOQ) of 0.01 ng ml−1 (triptorelin), 0.5 ng ml−1 (degarelix), 0.1 IU l−1 (LH) and 0.05 ng ml−1 (testosterone). The solid lines are the lines of identity
The goodness-of-fit plots indicated agreement between the observed data and the model predictions (Figure 7). The model was validated externally, where the PK/PD responses from other clinical degarelix studies were accurately predicted (data not shown).
Discussion
The objective of the present analysis was to build a population PK/PD model of the HPG axis which mimicked the underlying physiology of the endocrine system by incorporating as many of its features (e.g. mechanistic understanding of drug action, feedback control mechanisms, etc.) into the model as the observed data would allow. The dynamics of the HPG axis is highly nonlinear, with feedback interactions in a multivariate closed-loop control system. Furthermore, the observed PD profiles after administration of triptorelin (a GnRH agonist) and degarelix (a GnRH receptor blocker) are very different from each other. However, the two drugs act on the same underlying physiological system. The combined model was based on our mechanistic understanding of the HPG axis and was able to account for the PD response of LH and testosterone following treatment with triptorelin and degarelix.
In the present analysis, we applied the SDE framework described by Tornoe et al. [35] as a tool for identification of the dynamic dependencies and for deconvolving the feedback interactions of the HPG axis. This approach is similar to the method described by Fattinger et al. [16] using flexible nonparametric functions (i.e. natural cubic splines). The main difference between the two methods is that the SDE framework can be used to deconvolve dynamic dependencies of unknown states, inputs and/or parameters, whereas the spline method cannot. However, the natural cubic spline approach is straightforward to use if the dependencies are known, and only the form of the functional interactions is to be deconvolved.
The main problem associated with modelling a bivariate closed-loop system such as the LH and testosterone systems is that a model misspecification in the LH submodel will distort that for testosterone, and vice versa. Model building is further complicated because the PD of LH and testosterone are interdependent, and therefore cannot be characterized separately. Initial attempts were made to develop the LH and testosterone submodels separately, conditional on the observed response of the other hormone, thereby avoiding the complex closed-loop feedbacks. This approach is not recommended, since the separately developed submodels were difficult to merge when abandoning the reliance on the observed responses. Furthermore, it was not appropriate to switch from the first-order conditional estimation (FOCE) method to the less accurate first-order (FO) estimation method in NONMEM during the model building, due to the high degree of nonlinearity in the system. As a consequence, extremely long run times (approximately 1–2 weeks per model) were experienced during the model-building process. We also encountered many numerical problems when fitting the population PK/PD model to the >12 000 PK/PD concentration measurements from the 228 subjects.
In our final PK/PD model of the HPG axis, triptorelin stimulation and degarelix inhibition of the nonbasal LH pool release were described using sigmoidal Emax models (interaction 1 and 2 in Figure 2). Circulating LH stimulates testosterone secretion through a sigmoidal Emax model (interaction 3 in Figure 2). The delayed testosterone feedback on LH was modelled through a compartment where testosterone stimulates the input (interaction 4 in Figure 2). Finally, the closed-loop control system of the HPG axis is closed by the feedback compartment stimulating LH synthesis and release, which was modelled as negative and positive interaction for treatment with the GnRH agonist and GnRH receptor blocker, respectively (interactions 5 and 6 in Figure 2).
ke,LH, ke,F, λ, LHbase and Tebase were estimated as study-specific parameters even though they are considered to be system specific. The need for LHbase and Tebase as study-specific parameters is justified by the differences in the mean observed baseline LH and testosterone concentrations in the two studies. These discrepancies may be explained by the different study populations in the triptorelin (healthy subjects) and degarelix (prostate cancer patients) studies. This observation corresponds well to previous findings by Keenan et al. [36], who reported a disruption in LH pulsing in ageing men.
The estimated LH half-life of 84.5 h after triptorelin treatment is not consistent with previously reported LH half-life values of 0.3 and 1.5 h (biexponential decay) [37], which is similar to the value of 1.30 h obtained after treatment with degarelix. The estimated testosterone elimination rate constant of 0.0901 h−1 corresponds to a half-life of 7.69 h, the latter being longer than the value of 2 h reported in the literature [38].
In summary, a framework for the systematic development of population PK/PD models was successfully applied to the HPG axis. The dynamic dependencies of the latter were identified, and the interactions between LH and testosterone were deconvolved using SDEs and substituted with appropriate parametric functions. The resulting population PK/PD model of the HPG axis was able to describe and predict the different PK/PD profiles of GnRH agonists and GnRH receptor blockers. Thus, the findings indicate that the model adequately describes the underlying physiology of the endocrine system.
Acknowledgments
This work was financially supported by Ferring Pharmaceuticals A/S and Centre for Information Technology, Denmark.
Appendix A
The aim of the systematic population PK/PD model-building framework based on stochastic differential equations (SDEs) is to improve the model iteratively by systematically pinpointing its deficiencies. Initially, a simple structure is formulated and systematically expanded with models of increasing complexity in a manner that is supported by the data. The iterative process is continued until the model is accepted for a given purpose. Thus, the time spent on developing population PK/PD models can be reduced dramatically for complex systems [18, 34, 39]. The iterative framework for systematic model development using SDEs is summarized in the algorithm below.
Step 1.Formulate an initial ODE model derived using a priori knowledge about the modelled system.
Step 2.Transform the ODE model into an SDE model with a diagonal diffusion term to be able to pinpoint model deficiencies.
Step 3.Estimate the SDE model parameters.
Step 4.Identify possible model misspecifications by examining the significance of the estimated diffusion terms as well as the one-step prediction errors. The iterative model development is terminated if the model is accepted for the intended purpose. If the model is rejected, continue with Steps 5–9.
Step 5.Extend the model with state equations for the pinpointed model deficiencies.
Step 6.Estimate extended model parameters and obtain updated Extended Kalman Filter (EKF) state estimates.
Step 7.Evaluate model and repeat Steps 5 and 6 using, for example, different parameterizations until satisfactory results are obtained.
Step 8.Track unexplained variations using the updated EKF state estimates from the extended model.
Step 9.Apply nonparametric modelling methods such as GAM to deconvolve functional relationship. Use the obtained information to reformulate the model and return to Step 2.
Definition of terms used in the model building
Ai, amount in compartment i (µg); β, basal hormone secretion rate (ng ml−1 h−1); base, triptorelin baseline (ng ml−1); CL, clearance (l h−1); cp, plasma drug concentration (ng ml−1); D(t), input from dose (µg h−1); Emax/Imax/Lmax, maximal effect [–]; EC50/IC50/L50, concentration producing half the maximal effect (ng ml−1); Fconc, bioavailability for dose concentration conc [–]; F, feedback [–]; Fr, fraction of dose [–]; γ/δ/κ, sigmoidicity factor [–]; H, nonbasal hormone secretion rate [–]; ka, first-order absorption rate constant (h−1); ke, first-order elimination rate constant (h−1); λ, exponential factor [–]; LH, luteinizing hormone concentration (IU l−1); LHbase, baseline LH concentration (IU l−1); Ω, interindividual variance [–]; P, LH pool concentration (IU l−1); Q, intercompartmental clearance (l h−1); r, total hormone secretion rate (ng ml−1 h−1); Rinf, apparent zero-order input rate (µg h−1); Σ, residual error variance [–]; σw, diffusion term [–]; τ, apparent duration of triptorelin infusion (h); t1/2, half-life (h); Te, testosterone concentration (ng ml−1); Tebase, baseline testosterone concentration (ng ml−1); V, volume (l); w, standard Wiener process (h−1/2).
References
- 1.Cook T, Sheridan WP. Development of GnRH antagonists for prostate cancer: new approaches to treatment. Oncologist. 2000;5:162–8. doi: 10.1634/theoncologist.5-2-162. [DOI] [PubMed] [Google Scholar]
- 2.Nelson WG, De Marzo AM, Isaacs WB. Prostate cancer. N Engl J Med. 2003;349:366–81. doi: 10.1056/NEJMra021562. [DOI] [PubMed] [Google Scholar]
- 3.De Sy WAWP, De Meyer JM, Casselman J, Desmet R, Renders G, Schelfhout W. Long term experience in the treatment of advanced prostatic cancer with decapeptyl, compared to orchiectomy. Acta Urol Belg. 1988;56:581–8. [PubMed] [Google Scholar]
- 4.Stricker HJ. Luteinizing hormone-releasing hormone antagonists in prostate cancer. Urology. 2001;58(2 Suppl. 1):24–7. doi: 10.1016/s0090-4295(01)01238-9. [DOI] [PubMed] [Google Scholar]
- 5.Klingmuller D, Schweikert HU. Gonadotropin-releasing hormone: physiological and endocrinological aspects. Recent Results Cancer Res. 1992;124:1–6. doi: 10.1007/978-88-470-2186-0_1. [DOI] [PubMed] [Google Scholar]
- 6.Huitema AD, Mathot RA, Tibben MM, Rodenhuis S, Beijnen JH. A mechanism-based pharmacokinetic model for the cytochrome P450 drug–drug interaction between cyclophosphamide and thioTEPA and the autoinduction of cyclophosphamide. J Pharmacokinet Pharmacodyn. 2001;28:211–30. doi: 10.1023/a:1011543508731. [DOI] [PubMed] [Google Scholar]
- 7.Weinbauer GF, Nieschlag E. LH-RH antagonists: state of the art and future perspectives. Recent Results Cancer Res. 1992;124:113–36. doi: 10.1007/978-88-470-2186-0_11. [DOI] [PubMed] [Google Scholar]
- 8.Gries JM, Munafo A, Porchet HC, Verotta D. Down-regulation models and modeling of testosterone production induced by recombinant human choriogonadotropin. J Pharmacol Exp Ther. 1999;289:371–7. [PubMed] [Google Scholar]
- 9.Keenan DM, Veldhuis JD. A biomathematical model of time-delayed feedback in the human male hypothalamic–pituitary–Leydig cell axis. Am J Physiol. 1998;275(1 Part 1):E157–E176. doi: 10.1152/ajpendo.1998.275.1.E157. [DOI] [PubMed] [Google Scholar]
- 10.Barton HA, Andersen ME. A model for pharmacokinetics and physiological feedback among hormones of the testicular–pituitary axis in adult male rats: a framework for evaluating effects of endocrine active compounds. Toxicol Sci. 1998;45:174–87. doi: 10.1006/toxs.1998.2538. [DOI] [PubMed] [Google Scholar]
- 11.Heinze K, Keener RW, Midgley AR., Jr A mathematical model of luteinizing hormone release from ovine pituitary cells in perifusion. Am J Physiol. 1998;275(6 Part 1):E1061–E1071. doi: 10.1152/ajpendo.1998.275.6.E1061. [DOI] [PubMed] [Google Scholar]
- 12.Liu BZ, Peng JH, Sun YC, Liu YW. A comprehensive dynamical model of pulsatile secretion of the hypothalamo–pituitary–gonadal axis in man. Comput Biol Med. 1997;27:507–13. doi: 10.1016/s0010-4825(97)00026-7. [DOI] [PubMed] [Google Scholar]
- 13.Pechstein B, Nagaraja NV, Hermann R, Romeis P, Locher M, Derendorf H. Pharmacokinetic–pharmacodynamic modeling of testosterone and luteinizing hormone suppression by cetrorelix in healthy volunteers. J Clin Pharmacol. 2000;40:266–74. doi: 10.1177/00912700022008937. [DOI] [PubMed] [Google Scholar]
- 14.Nagaraja NV, Pechstein B, Erb K, Klipping C, Hermann R, Locher M, Derendorf H. Pharmacokinetic/pharmacodynamic modeling of luteinizing hormone (LH) suppression and LH surge delay by cetrorelix after single and multiple doses in healthy premenopausal women. J Clin Pharmacol. 2003;43:243–51. doi: 10.1177/0091270003251377. [DOI] [PubMed] [Google Scholar]
- 15.Schwahn M, Nagaraja NV, Derendorf H. Population pharmacokinetic/pharmacodynamic modeling of cetrorelix, a novel LH-RH antagonist, and testosterone in rats and dogs. Pharm Res. 2000;17:328–35. doi: 10.1023/a:1007557207590. [DOI] [PubMed] [Google Scholar]
- 16.Fattinger KE, Verotta D, Porchet HC, Munafo A, Le Cotonnec JY, Sheiner LB. Modeling a bivariate control system: LH and testosterone response to the GnRH antagonist antide. Am J Physiol. 1996;271(4 Part 1):E775–E787. doi: 10.1152/ajpendo.1996.271.4.E775. [DOI] [PubMed] [Google Scholar]
- 17.Tornøe CW, Jacobsen JL, Pedersen O, Hansen T, Madsen H. Grey-box modelling of pharmacokinetic/pharmacodynamic systems. J Pharmacokinet Pharmacodyn. 2004;31:401–17. doi: 10.1007/s10928-004-8323-8. [DOI] [PubMed] [Google Scholar]
- 18.Kristensen NR, Madsen H, Ingwersen SH. Using stochastic differential equations for PK/PD model development. J Pharmacokinet Pharmacodyn. 2005;32:109–41. doi: 10.1007/s10928-005-2105-9. [DOI] [PubMed] [Google Scholar]
- 19.Barron JL, Millar RP, Searle D. Metabolic clearance and plasma half-disappearance time of D-TRP6 and exogenous luteinizing hormone-releasing hormone. J Clin Endocrinol Metab. 1982;54:1169–73. doi: 10.1210/jcem-54-6-1169. [DOI] [PubMed] [Google Scholar]
- 20.Klippel KF, Winkler CJ, Jocham D, Rubben H, Moser B, Gulati A. [Effectiveness and tolerance of 1 dosage forms (subcutaneous and intramuscular) of decapeptyl depot in patients with advanced prostate carcinoma] Urologe A. 1999;38:270–5. doi: 10.1007/s001200050280. [DOI] [PubMed] [Google Scholar]
- 21.Agersø H, Koechling W, Knutsson M, Hjortkjær R, Karlsson MO. The dosing solution influence on the pharmacokinetics of degarelix, a new GnRH antagonist, after s.c. administration to beagle dogs. Eur J Pharm Sci. 2003;20:335–40. doi: 10.1016/j.ejps.2003.08.001. [DOI] [PubMed] [Google Scholar]
- 22.Broqua P, Riviere PJ, Conn PM, Rivier JE, Aubert ML, Junien JL. Pharmacological profile of a new, potent, and long-acting gonadotropin-releasing hormone antagonist: degarelix. J Pharmacol Exp Ther. 2002;301:95–102. doi: 10.1124/jpet.301.1.95. [DOI] [PubMed] [Google Scholar]
- 23.de Pinieux G, Legrier ME, Poirson-Bichat F, Courty Y, Bras-Goncalves R, Dutrillaux AM, Nemati F, Oudard S, Lidereau R, Broqua P, Junien JL, Dutrillaux B, Poupon MF. Clinical and experimental progression of a new model of human prostate cancer and therapeutic approach. Am J Pathol. 2001;159:753–64. doi: 10.1016/S0002-9440(10)61746-4. [DOI] [PMC free article] [PubMed] [Google Scholar]
- 24.Jiang G, Stalewski J, Galyean R, Dykert J, Schteingart C, Broqua P, Aebi A, Aubert ML, Semple G, Robson P, Akinsanya K, Haigh R, Riviere P, Trojnar J, Junien JL, Rivier JE. GnRH antagonists: a new generation of long acting analogues incorporating p-ureido-phenylalanines at positions 5 and 6. J Med Chem. 2001;44:453–67. doi: 10.1021/jm0003900. [DOI] [PubMed] [Google Scholar]
- 25.Shah VP, Midha KK, Dighe S, McGilveray IJ, Skelly JP, Yacobi A, Layloff T, Viswanathan CT, Cook CE, McDowall RD. Analytical methods validation: bioavailability, bioequivalence and pharmacokinetic studies. Conference report. Eur J Drug Metab Pharmacokinet. 1991;16:249–55. doi: 10.1007/BF03189968. [DOI] [PubMed] [Google Scholar]
- 26.Ezan E, Drieu K, Chapelat M, Rougeot C, Dray F. Radioimmunoassay of [D-Trp6]-luteinizing hormone-releasing hormone: its application to animal pharmacokinetic studies after single injection and long-acting formulation administration. Regul Pept. 1986;14:155–67. doi: 10.1016/0167-0115(86)90216-8. [DOI] [PubMed] [Google Scholar]
- 27.Filicori M, Cognigni GE, Arnone R, Pocognoli P, Tabarelli C, Ciampaglia W, Taraborelli S, Casadio P. Subcutaneous administration of a depot gonadotropin-releasing hormone agonist induces profound reproductive axis suppression in women. Fertil Steril. 1998;69:443–9. doi: 10.1016/s0015-0282(97)00553-0. [DOI] [PubMed] [Google Scholar]
- 28.Beastall GH, Ferguson KM, O'Reilly DS, Seth J, Sheridan B. Assays for follicle stimulating hormone and luteinising hormone: guidelines for the provision of a clinical biochemistry service. Ann Clin Biochem. 1987;24:246–62. doi: 10.1177/000456328702400303. [DOI] [PubMed] [Google Scholar]
- 29.Clarke SD, Cook J, Imrie G, Noctor TAG. Determination of Suppressed Testosterone Levels in Human Serum by LC-MS/MS. [Cited 2006 October 27]. ASMS Annual Meeting 2001, Chicago, USA. Available at http://www.yorkbio.com.
- 30.Imrie GA, Noctor TAG, Lough JA. Method for the Determination of Clinically Suppressed Levels of Testosterone in Human Serum. [Cited 2006 October 27]. Bioanalytical Forum 2002, Guildford, UK. Available at http://www.yorkbio.com.
- 31.Beal SL, Sheiner LB. NONMEM User's Guides. San Francisco: NONMEM Project Group, University of California; 1994. [Google Scholar]
- 32.Beal SL. Ways to fit a PK model with some data below the quantification limit. J Pharmacokinet Pharmacodyn. 2001;28:481–504. doi: 10.1023/a:1012299115260. [DOI] [PubMed] [Google Scholar]
- 33.Tornøe CW, Agersø H, Nielsen HA, Madsen H, Jonsson EN. Population pharmacokinetic modeling of a subcutaneous depot for GnRH antagonist degarelix. Pharm Res. 2004;21:574–84. doi: 10.1023/b:pham.0000022403.60314.51. [DOI] [PubMed] [Google Scholar]
- 34.Tornøe CW, Overgaard RV, Agersø H, Nielsen HA, Madsen H, Jonsson EN. Stochastic differential equations in NONMEM (R). Implementation, application, and comparison with ordinary differential equations. Pharm Res. 2005;22:1247–58. doi: 10.1007/s11095-005-5269-5. [DOI] [PubMed] [Google Scholar]
- 35.Parker KL, Schimmer BP. Pituitary hormones and their hypothalamic releasing factors. In: Hardman JG, Limbird LE, Gilman AG, editors. Goodman and Gilman's the Pharmacological Basis of Therapeutics. London: McGraw-Hill; 2001. pp. 1541–63. [Google Scholar]
- 36.Keenan DM, Veldhuis JD. Disruption of the hypothalamic luteinizing hormone pulsing mechanism in aging men. Am J Physiol Regul Integr Comp Physiol. 2001;281:R1917–R1924. doi: 10.1152/ajpregu.2001.281.6.R1917. [DOI] [PubMed] [Google Scholar]
- 37.Thorner MO, Vance ML, Horvath E, Kovacs K. The anterior pituitary. In: Wilson JD, Foster DW, editors. Williams Textbook of Endocrinology. London: W.B. Saunders Co.; 1992. pp. 221–310. [Google Scholar]
- 38.Singh AB, Norris K, Modi N, Sinha-Hikim I, Shen R, Davidson T, Bhasin S. Pharmacokinetics of a transdermal testosterone system in men with end stage renal disease receiving maintenance hemodialysis and healthy hypogonadal men. J Clin Endocrinol Metab. 2001;86:2437–45. doi: 10.1210/jcem.86.6.7525. [DOI] [PubMed] [Google Scholar]
- 39.Tornøe CW. Population Pharmacokinetic/Pharmacodynamic Modelling of the Hypothalamic–Pituitary–Gonadal AxisInformatics and Mathematical Modelling. 2005. Kgs Lyngby: Technical University of Denmark.


