

Abstract
What is already known about this subject
Many studies have shown that genetic polymorphisms of the CYP2C9 gene contribute to some of the variability (around 20%) in warfarin dose requirements and therapeutic response to the drug.
It is also clear that this effect must be elicited through differences in the plasma (S)-warfarin concentration between individuals of different genotypes, although assessing the effects of any single genotype of CYP2C9 on the kinetics of (S)-warfarin has generally failed.
What this study adds
The study aims to simulate the impact of genetic polymorphism in CYP2C9 on both the pharmacokinetics (PK) and pharmacodynamics (PD) of (S)-warfarin using a mechanistic, population approach to modelling.
The outcomes with respect to the design of studies and their statistical power are compared against those of actual reported studies.
The exercise with warfarin is offered as an example of how prior information on the in vitro PK and PD of new drugs might be used in association with knowledge of relevant genetic polymorphisms and their frequencies to carry out virtual clinical studies as an aid to the design, optimization and powering of subsequent real clinical trials assessing the impact of specific genetic differences.
Aim
To assess the power of in vivo studies needed to discern the effect of genotype on pharmacokinetics (PK) and pharmacodynamics (PD) using CYP2C9 and (S)-warfarin as an example.
Methods
Information on the in vitro metabolism of (S)-warfarin and genetic variation in CYP2C9 was incorporated into a mechanistic population-based PK–PD model. The influence of study design on the ability to detect significant differences in PK (AUC0−12 h) and PD (AUEC0−12 h INR) between CYP2C9 genotypes was investigated.
Results
A study size of 90 (based on the natural abundance of genotypes and uniform dosage) was required to achieve 80% power to discriminate the PK of (S)-warfarin between wild type (*1/*1) and the combination of all other genotypes. About 250 subjects were needed to detect a difference in anticoagulant response. The power to detect differences between specific genotypes was much lower. Analysis of experimental comparisons of the PK or PD between wild-type and other individual genotypes indicated that only 21% of cases (20 of 95 comparisons within 11 PD and four PK–PD studies) reported statistically significant differences. This was similar to the percentage expected from our simulations (20%, χ2 test, P = 0.80). Simulations of studies enriched with specific genotypes indicated that only three and five subjects were required to detect differences in PK and PD between wild type and the *3/*3 genotype, respectively.
Conclusion
The utilization of prior information (including in vivo enzymology) in clinical trial simulations can guide the design of subsequent in vivo studies of the impact of genetic polymorphisms, and may help to avoid costly, inconclusive outcomes.
Keywords: clinical trial simulation, cytochrome P450, drug metabolism, in silico, modelling and simulation, pharmacogenetics
Introduction
(S)-warfarin, which is responsible for most of the anticoagulant activity of racemic warfarin [1], is metabolized by cytochrome P450 2C9 (CYP2C9) [2]. Two allelic variants of this enzyme (CYP2C9*2 and CYP2C9*3) exhibit significantly decreased catalytic activity compared with the wild-type form [3–7]. Accordingly, several studies have assessed the impact of these genetic variations on the pharmacokinetics (PK) of warfarin [8–11] and its pharmacodynamics (PD) with respect to therapeutic response and maintenance dose requirements [8–24]. Using (S)-warfarin as an example, we have developed a mechanistic, population PK–PD model, based on in vitro drug metabolism data and information on the frequency and activity of the different allelic forms of CYP2C9, to estimate the statistical power of in vivo studies needed to discern the effect of CYP2C9 genotype on PK and PD. This represents a paradigm for assessing the impact of genetic polymorphisms on the PK and PD of new drugs prior to costly population studies. As such, therefore, it is in keeping with the rationale for clinical trial simulation (CTS) as a ‘smarter’ way of designing actual clinical studies [25, 26]. The present study is a companion to a similar investigation of the impact of genetic polymorphism in CYP2D6 on the PK and PD of dextromethorphan [27].
Methods
Clearance simulation
The in vitro–in vivo extrapolation (IVIVE) of the clearance of (S)-warfarin in different CYP2C9 genotypes was achieved using a set of algorithms developed by Simcyp® Ltd (http://www.simcyp.com) Utilizing Monte Carlo simulation to establish virtual populations. Input requirements were the abundances of the different forms of CYP2C9 per mg of microsomal protein [28], milligrams of microsomal protein per gram of liver [29], liver volume [30] and their variances, together with data on the in vitro metabolism of (S)-warfarin by wild-type and variant enzymes (see below). Thus, estimates of whole liver intrinsic clearances were made, which were then transformed into whole organ clearances (CLH) using the ‘well-stirred’ model of hepatic drug clearance [31] (Figure 1). Individual renal clearances were simulated from an average value derived from observed urinary recovery and total clearance [32] considering the level of renal function expected for a given age and weight [33]. Hepatic and renal clearances were combined to derive net clearance. A full description of the methods employed for the IVIVE of individual clearance values is provided by Howgate et al.[34]. Specific parameters and modifications to the generic Simcyp® algorithm relevant to this study are indicated below.
Figure 1.

Schematic representation of the pharmacokinetic–pharmacodynamic model, indicating propagation of metabolic differences between CYP2C9 genotypes into (S)-warfarin clearance and its anticoagulant effect. CLuint, unbound intrinsic clearance; mppgl, milligrams of microsomal protein per gram of liver; WRF conc, plasma (S)-warfarin concentration; PC, prothrombin complex; Rsyn, rate of synthesis of PC; kd, rate constant of degradation of PC; PT, prothrombin time; INR, international normalized ratio
Genotype frequencies and activities
A meta-analysis of the enzyme kinetic values in the published literature (Table 1) was carried out to estimate the relative activity of each of the CYP2C9 alleles with respect to the in vitro metabolism of (S)-warfarin. A summary of the studies included in the meta-analysis is given in Table 1[3–7]. Mean values of the activity of each allelic form were weighted for study size. Percentage decreases in intrinsic clearance (CLuint) with respect to wild-type (*1/*1) enzyme were calculated assuming that the in vitro activities of heterologously expressed variant enzymes represented those in the respective homozygous genotype. Values of CLuint in heterozygousgenotypes were assumed to be the average of those for homozygotes.
Table 1.
Data used to calculate the relative activity of CYP2C9 in each of the genotypes
| Allele | No. of observations | Vmax (pmol min−1 pmol−1 P450) | Km (µm) | Vmax* (pmol min−1 pmol−1 P450) | Change in CLuint (%) | Reference |
|---|---|---|---|---|---|---|
| *1 | 2 | 0.22 | 18 | 0.585 | Yamazaki et al.[6] | |
| *1 | 3 | 0.1333 | 11.6 | 0.355 | Sullivan-Klose et al.[3] | |
| *1 | 3 | 0.282 | 1.86 | 0.750 | Takahashi et al.[4] | |
| *1 | 3 | 0.248 | 5.8 | 0.660 | Takanashi et al.[7] | |
| *1 | 3 | 0.28 | 2.6 | 0.745 | Takahashi et al.[5] | |
| *2 | 2 | 0.11 | 22 | 0.293 | ↓60.6 | Yamazaki et al.[6] |
| *2 | 3 | 0.1656 | 12.5 | 0.440 | ↑11.4 | Sullivan-Klose et al.[3] |
| *3 | 2 | 0.067 | 53 | 0.178 | ↓90.9 | Yamazaki et al.[6] |
| *3 | 3 | 0.181 | 92.3 | 0.481 | ↓83.9 | Sullivan-Klose et al.[3] |
| *3 | 3 | 0.111 | 21.6 | 0.295 | ↓87.7 | Takanashi et al.[7] |
| *3 | 3 | 0.067 | 10.4 | 0.178 | ↓94.1 | Takahashi et al.[5] |
All studies were carried out in microsomes from yeast expressing the relevant mutation of the enzyme.
Vmaxcorrected with an Inter-System Extrapolation Factor (ISEF) of 2.66 as described by Proctor et al. [49].
The frequencies of each of the six established, common CYP2C9 genotypes in Whites were taken from a review by Lee et al.[35] (Table 2). (S)-warfarin elimination was assumed to be mediated exclusively by CYP2C9 with a small contribution from renal clearance (0.0032 l h−1[32] in the average man). This information was entered into a classical PK/PD model with physiological elements related to the description of clearance.
Table 2.
Frequency and relative activity of each of the common CYP2C9 genotypes
| Genotype | Frequency (%) | Relative activity (%) |
|---|---|---|
| *1/*1 | 65.3 | 100 |
| *1/*2 | 20.4 | 85 |
| *1/*3 | 11.6 | 55 |
| *2/*2 | 0.9 | 70 |
| *2/*3 | 1.4 | 40 |
| *3/*3 | 0.4 | 10 |
PK/PD simulation
Pharmacokinetic model
Clearance values for each individual were converted to elimination rate constants (ki) for input into the PK model using equation 1.
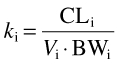 |
(1) |
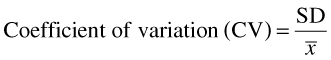
where CLi is the clearance of (S)-warfarin in the ith individual, calculated as described above, BW is body weight and Vi is the weight-normalized steady-state volume of distribution assigned to the ith individual. The latter values were determined from the reported mean and standard deviation [36] (Table 3) assuming a log normal distribution. For such a distribution, the geometric mean (GM; µ in log scale) and geometric standard deviation (GSD; σ in log scale) represent the central tendency and variation, respectively. As the reported data refer to the algebraic mean (x¯) and its standard deviation (SD), µ and σ were calculated as follows:
Table 3.
Pharmacokinetic and pharmacodynamic (prothrombin complex activity in the blood and prothrombin time) parameters for (S)-warfarin used in the simulations
| Parameter | Value* | |
|---|---|---|
| Pharmacokinetic | V (l kg−1) | 28.9 (5.5) |
| CLR (renal clearance) (l h−1) | 0.0032 | |
| fuB | 0.0113 | |
| tlag (h) | 0.8 (0.54) | |
| ka (h−1) | 3.15 (1.68) | |
| Pharmacodynamic | kd (h−1) | 0.054 (0.015) |
| Cu50 (mg l−1) | 0.0026 (0.0015) | |
| γ | 0.90 (0.23) | |
| a | 426 (8.0) | |
| b | 7.75 (0.10) |
| (2) |
| (3) |
where x¯ is the algebraic mean and
 |
(4) |
These values were entered into Mathcad (Mathsoft, Cambridge, MA, USA) as part of the ‘rlnorm’ function. This returns a vector of random numbers having a log normal distribution based on the mean and CV value. This procedure was followed for generating all other individual parameter values.
The fraction of the amount of drug reaching the liver escaping hepatic metabolism in each individual (FH,i) was determined from:
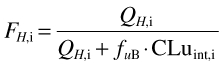 |
(5) |
where QH,i and CLuint,i are hepatic blood flow and the intrinsic metabolic clearance of (S)-warfarin in the ith individual, respectively (estimated using Simcyp® algorithms as described above) and fuB is the unbound fraction of drug in blood calculated from the fraction unbound in plasma (fu) divided by the blood to plasma concentration drug ratio (B/P). The value of fu (0.0062) was taken from the literature [36]. Since a value for B/P was not available, it was assumed to be 0.55, representing limited drug uptake into erythrocytes at an haematocrit of 45%.
Plasma concentrations of (S)-warfarin after oral administration of rac-warfarin were generated by entering values of the elimination rate constant (k10,i) and FH,i into a one-compartment model with first-order absorption and a lag time, adapted from Chan et al.[36] (Equation 1, Appendix) (Figure 1).
Pharmacodynamic model
Prothrombin complex activity in the blood (PCA) over time was simulated using an indirect response model in which PCA is the net effect of synthesis and degradation of the complex expressed as a percentage of maximum response [37] (Equation 2, Appendix) (Figure 1 and Table 3). The (S)-isomer of warfarin was assumed to be the active moiety inhibiting synthesis of the complex [1, 38, 39], although some reports have suggested a contribution to activity from the (R)-isomer [36]. PCA was converted to prothrombin time (PT) (Equation 3, Appendix) [36], which, in turn, was converted to International Normalized Ratio (INR) using an equation adapted from Adcock and Duff [40] (Equation 4, Appendix) (Figure 1).
Study design
Individual plasma (S)-warfarin concentration and response vs. time profiles following daily administration of oral warfarin were simulated with hourly sampling times over 24 h. A number of design elements were investigated as described below. As the majority of simulations were undertaken using ‘uniform dosage’ and ‘random recruitment’ (see below for definitions), this combination will be referred to as the ‘default condition’.
Warfarin dosage
Uniform dosage in each individual regardless of CYP2C9 genotype – Each individual in the virtual population received 3 mg of (S)-warfarin per day. This dose was chosen based on half of the weighted average dose of rac-warfarin calculated from Holford et al.[41]. The study design is equivalent to a prospective clinical trial where each individual receives the same dose, assuming the dose requirement for each CYP2C9 genotype is not known.
Genotype-related dosage – Several retrospective studies have indicated that the average dose of warfarin given to individuals with varying CYP2C9 genotypes is different (Table 4). The distribution of warfarin doses in 292 patients treated in two large general hospitals in Merseyside, England, was kindly provided by M. Pirmohammed (University of Liverpool). A random number generator operating on a description of these data by a Weibull function was used to assign a maintenance dose to each virtual individual. The probability of each CYP2C9 genotype within four different dose bands [low (0–3 mg), medium–low (3.1–4.5 mg), medium–high (4.6–6.4 mg) and high (6.6 + mg)] was adjusted according to a meta-analysis of the data shown in Table 4. Thus, the probabilities shown in Table 5 were used to assign the CYP2C9 genotype to any given individual at any given dose. This study design will be referred to as ‘genotype-related dosage’.
Table 4.
Data used in a meta-analysis to assign average doses in each CYP2C9 genotype when simulating ‘genotype-related dosing’
| Average dose in each genotype* | Percentage of subjects with each genotype | ||||||||||||
|---|---|---|---|---|---|---|---|---|---|---|---|---|---|
| Reference | n | * 1/* 1 | * 1/* 2 | * 1/* 3 | * 2/* 2 | * 2/* 3 | * 3/* 3 | * 1/* 1 | * 1/* 2 | * 1/* 3 | * 2/* 2 | * 2/* 3 | * 3/* 3 |
| Siguret et al. [23] | 126 | 3.1 (1.4) | 2.7 (1.3) | 2.9 (1.1) | – | 2.3 (1.8) | – | 63.5 | 15.9 | 14.3 | 1.6 | 4.8 | – |
| Kamali et al. [9] | 119 | 4.06 (1.72) | 3.63 (1.78) | 2.7 (1.36) | – | – | – | 62.2 | 25.2 | 12.6 | – | – | – |
| Aithal et al. [16] | 155 | 4.68 (2.1) | 3.7 (1.9) | 2.7 (1.3) | – | – | – | 65.2 | 20.6 | 14.2 | – | – | – |
| Taube et al. [19] | 561 | 5.01 (2.43) | 4.31 (1.94) | 3.97 (1.79) | 3.04 (1.29) | 4.09 (2.09) | – | 69.9 | 19.1 | 9.4 | 0.5 | 1.1 | – |
| Loebstein et al. [11] | 156 | 6.5 (3.2) | 5.2 (2.4) | 1.6 (0.6) | – | – | – | 69.2 | 17.9 | 12.8 | – | – | – |
| Higashi et al. [17] | 185 | 5.63 (2.56) | 4.88 (2.57) | 3.32 (0.94) | 4.07 (1.48) | 2.34 (0.35) | 1.6 (0.81) | 68.6 | 15.1 | 9.7 | 2.2 | 1.6 | 2.7 |
| Margaglioni et al.[18] | 180 | 6.7 (2.9) | 5.2 (2.2) | 3.8 (2.0) | – | – | – | 48.9 | 34.4 | 15.6 | – | 1.1 | – |
Mean (standard deviation).
Table 5.
The probability of each genotype being found in each of four dose groups, based on a meta-analysis of the data shown in Table 4
| Dose group | Genotype | Probability |
|---|---|---|
| Low (0–3 mg) | *1/*1 | 54.005 |
| *1/*2 | 20.450 | |
| *1/*3 | 19.863 | |
| *2/*2 | 1.229 | |
| *2/*3 | 3.106 | |
| *3/*3 | 1.347 | |
| Medium (low) (3.1–4.5 mg) | *1/*1 | 60.028 |
| *1/*2 | 22.902 | |
| *1/*3 | 15.168 | |
| *2/*2 | 0.922 | |
| *2/*3 | 0.890 | |
| *3/*3 | 0.091 | |
| Medium (high) (4.6–6.5 mg) | *1/*1 | 68.430 |
| *1/*2 | 23.094 | |
| *1/*3 | 7.345 | |
| *2/*2 | 0.425 | |
| *2/*3 | 0.549 | |
| *3/*3 | 0.000 | |
| High (6.6+ mg) | *1/*1 | 81.540 |
| *1/*2 | 16.443 | |
| *1/*3 | 1.735 | |
| *2/*2 | 0.032 | |
| *2/*3 | 0.252 | |
| *3/*3 | 0.000 |
Subject recruitment strategy
Random recruitment – The subjects of most of the published studies of the influence of genetic variation in CYP2C9 on warfarin PK or PD were not selected for CYP2C9 genotype. Therefore, the probability of having adequate numbers of a certain genotype in the study population for comparison with other genotypes is dependent on the natural frequency of that genotype in the general population. Virtual populations were simulated based on this ‘random recruitment’ design.
Enriched recruitment – In this case, the virtual populations were enriched with certain genotypes. For example, a population of 10 *3/*3 individuals was compared with a population of 10 wild-type subjects. This design will be referred to as ‘enriched recruitment’. In practice, it would require the prior genotyping of many subjects, particularly with regard to the rarer genotypes, in order to carry out subsequent selective recruitment of small groups of individuals.
Study size
Simulated plasma drug concentration- and response-time profiles in the different CYP2C9 genotypes were compared using a range of population sizes (n). For ‘random recruitment’, n was varied from 10, 25, 50, 100, 250 to 550, and for ‘enriched recruitment’ it was varied from 2, 3, 5 to 10.
Null hypothesis
As a set of control simulations to evaluate the possibility of false-positive outcomes, the null hypothesis that there is no true association of the genotype with drug clearance was tested. These simulations used the same study sizes employed in the ‘random recruitment’ simulations described above (n = 10, 15, 50, 100, 250 to 550) and ‘uniform dose’ conditions. Half the population were classed as ‘extensive metabolizers’ (*1*1) and half were ‘poor metabolizers’ (*3*3), but no difference in metabolic capability between the genotypes was introduced.
Influence of VKORC1 genotype
Since pharmacodynamic variability in the response to warfarin is known to depend upon the genotype for vitamin K epoxide reductase complex 1 (VKORC1) [42–44] as well as that for CYP2C9, further simulations were carried out to assess its impact on study power. In the default model the variability in kd was set to 27% [36] (Table 3). To allow for the increase in certainty arising from a knowledge of VKORC1 genotype, this was decreased to 15%. This 44% decrease in kd was based on the weighted average of the results of studies indicating that the total variability in warfarin dose due to VKORC1 genotype (after subtracting variability due to CYP2C9 genotype) is 18–26% [42–44]. The simulations were carried out under ‘random recruitment’ and ‘uniform dosing’ conditions.
Data analysis
Twenty simulations were run at each study size involving a total of 79 600 virtual patients. Although PK and PD data were available up to 24 h after dosage in our simulations, values of the areas under the plasma drug concentration–time curves (AUC) and effect (INR)–time curves (AUEC) were calculated up to 12 h (trapezoidal rule) in order to be consistent with the study design of experimental reports on warfarin PK and PD. The probability of detecting statistically significant differences in PK and PD between the wild-type (*1/*1) and the combination of the other CYP2C9 genotypes was assessed by comparing values of AUC and AUEC, respectively, using anova (SPSS v. 12, 2003; SPSS Inc., Chicago, IL, USA). The corresponding probabilities of detecting differences in AUC/AUEC between the wild-type and any other single genotype were calculated using Tukey's post hoc test for multiple comparisons. The number of studies out of 20 providing a statistically significant difference in AUC (or AUEC) between CYP2C9 genotypes was recorded as the power of that comparison in that particular trial.
Results
The meta-analysis of the enzyme activities associated with the variant alleles of CYP2C9 indicated mean decreases in CLuint of 15% and 45% compared with wild-type activity, respectively, for every *2 and *3 allele present in an individual. The resultant effects for different CYP2C9 genotypes are shown in Table 2. Propagation of these values through the Simcyp® algorithm resulted in values of unbound oral clearance of (S)-warfarin of 19.9 (*1/*1), 17.1 (*1/*2), 10.8 (*1/*3), 14.8 (*2/*2), 7.6 (*2/*3) and 1.9 (*3/*3) l h−1. These predicted values were all within twofold of those reported from in vivo studies [8, 9] (Figure 2).
Figure 2.

Comparison of observed (Scordo et al.[8], ○; Takahashi et al.[10], □) and simulated (◊; n = 100) values of the unbound oral clearance of (S)-warfarin. Solid lines indicate the medians of the simulated data
Default conditions (‘uniform dosage’ and ‘random recruitment’)
About 90 subjects were needed to detect a difference in AUC between the wild type (*1/*1) and the combination of all other genotypes (Figure 3). The power to differentiate between wild type and any other single genotype was less, to a degree depending on the genotype (Figure 4). For example, about 450 subjects were required to detect a difference in AUC between the *2/*3 genotype and the wild type with a power of 80% (Figure 4), whereas, with the same number of subjects, a power of only about 25% was achieved when comparing the *2/*2 genotype with the wild type (Figure 4). The null hypothesis simulations resulted in 0–5% power to detect differences in the AUC of (S)-warfarin between genotypes.
Figure 3.

Outcomes of simulations to determine the statistical power of pharmacokinetic (PK) and pharmacodynamic (PD) studies of (S)-warfarin to detect differences between the influence of the CYP2C9 wild-type genotype and the combination of all other CYP2C9 genotypes (‘random recruitment’ conditions). Power with respect to the following conditions is indicated: AUC (‘uniform dosage’ ( ) and ‘genotype-adjusted dosage’ (
 )); AUEC (‘uniform dosage’ (
 ) and ‘genotype-adjusted dosage’ (
 )); AUEC (‘uniform dosage’ and reduced PD variability (
 ) due to knowledge of VKORC1 genotype). The broken arrow indicates the range of sizes of published PD studies and the solid arrow shows the range of sizes of published PK studies
Figure 4.

Outcomes of simulations to determine the statistical power of pharmacokinetic studies of (S)-warfarin to detect differences between AUC in wild-type vs.*1/*2 ( 20.4), *1/*3 (
 11.6), *2/*2 (
 0.9), *2/*3 (
 1.4) and *3/*3 (
 0.4) genotypes under conditions of ‘uniform dosage’ and ‘random recruitment’
Corresponding powers to detect differences in AUEC between CYP2C9 genotypes are shown in Figures 3 and 5. About 250 subjects were required to achieve 80% power to detect a difference between wild-type and any other genotype (Figure 3). The power to detect differences in AUEC between specific genotypes is shown in Figure 5. For example, about 420 subjects are requiredfor 80% power to detect a difference between the *2/*3 genotype and the wild type. The same number of subjects gave a power of 10% when comparing the *3/*3 genotype with the wild type.
Figure 5.

Outcomes of simulations to determine the statistical power of pharmacodynamic studies of (S)-warfarin to detect differences between AUEC in wild-type vs.*1/*2 ( 20.4), *1/*3 (
 11.6), *2/*2 (
 0.9), *2/*3 (
 1.4) and *3/*3 (
 0.4) genotypes under conditions of ‘uniform dosage’ and ‘random recruitment
Only 21% (20 of 95) of comparisons within published studies (four PK and 15 PD, with five possible comparisons; see Table 6) reported statistically significant differences in PK or PD between the wild type and any single other genotype. This was similar to the percentage expected from our simulations (20%; 19 of 95 comparisons). There were four false-negative and two false-positive predictions for PK comparisons, and corresponding numbers for PD cases were seven and six (overall a good consistency as indicated by χ2 test, P = 0.80).
Table 6.
The outcomes of reported studies of the pharmacokinetics (PK) and/or pharmacodynamics (PD) of warfarin with respect to CYP2C9 genotype
 |
‘Genotype-related dosage’
Using this model with ‘random recruitment’, the power to determine differences in drug clearance between wild-type and all other genotypes was the same as that seen under ‘default conditions’. This was not the case for AUC (a parameter that is dependent on both dose and clearance) or AUEC, where the powers to determine differences between CYP2C9 genotypes were decreased under ‘genotype-related dosage’ conditions compared with ‘uniform dosage’ (Figure 3). The power to detect a difference in AUEC (comparing wild-type and the combination of other genotypes) with the maximum study size reported in the literature (550 individuals) was 65%.
‘Enriched recruitment’
To investigate the effect of ‘enriched recruitment’ under ‘uniform dose’ conditions, *3/*3 individuals were compared directly with wild-type individuals. As expected, this resulted in much higher power compared with that achieved with ‘random recruitment’. Thus, to achieve 80% power in detecting a significant difference in AUC between the two genotypes, only three subjects in each group were required (Figure 6). The corresponding number needed to detect differences in AUEC was five per group (Figure 6).
Figure 6.

Outcomes of simulations to determine the statistical power of pharmacokinetic and pharmacodynamic studies of (S)-warfarin to detect differences in AUC and AUEC between wild-type and *3/*3 genotypes under conditions of ‘enriched recruitment’. PK ( ), DD (
 )
)
Influence of VKORC1 genotype
The study powers arising from these simulations were slightly higher than those of the equivalent ‘uniform dosage’, ‘random recruitment’ simulations described above (Figure 3).
Discussion
Based on CTS using a mechanistic population PK–PD model incorporating data on in vitro drug metabolism, we have examined the power of in vivo studies to determine differences in the disposition of (S)-warfarin and its anticoagulant effect in relation to CYP2C9 genotype. The derivation of metabolic clearance associated with different genotypes from in vitro data recovered that reported from in vivo studies with good accuracy (Figure 2).
The model projection indicated that, under the assumptions of ‘uniform dosage’ and ‘random recruitment’, at least 90 subjects would be required to detect a difference (80% power) in the AUC of (S)-warfarin between wild genotype and the combination of all other genotypes (Figure 3). For ‘genotype-related dosage’, the power would be much less (over 550 subjects required for a power of 80%). Also, comparisons between the wild-type and specific genotypes would require much higher numbers of subjects (e.g. 420 subjects to achieve 80% power in discriminating PK between wild type and *2/*3 under the ‘uniform dosage’ condition). Study sizes of this order are uncommon in classical PK studies, although they may be achieved in population PK studies using sparse data analysis. Four studies assessing the impact of genetic variation in CYP2C9 on warfarin PK using randomly selected subjects have been reported. One of these [10] used 47 subjects and, as predicted by our model, failed to detect a difference in PK between wild-type and all other genotypes. Three other studies were successful in discerning a difference between the wild type and some of the genotypes, but not others [8, 9, 11]. For example, each of the three studies had 0% power to differentiate the PK between the wild-type and the *2/*2 genotype. Accordingly, none of the studies was successful in observing a significant difference between these genotypes using 93, 121 and 297 subjects (due to insufficient numbers of *2/*2 subjects in the study) [8, 9, 11] (Table 6).
With regard to PD outcome, the model projection indicated that under the assumptions of ‘uniform dosage’ and ‘random recruitment’, about 250 subjects would be required to achieve 80% power to detect a difference in AUEC between wild type and the combination of all other genotypes (Figure 3). With ‘genotype-related dosage’ the power decreased to 60% with 550 subjects. All reported studies assessing the impact of genetic variability in CYP2C9 on warfarin response and dosage requirements were sufficiently powered to detect the contrast between wild-type and the combination of all other genotypes (Table 6). However, as with the PK studies, the power for comparisons between specific genotypes was much lower. For example, with a study size of 121, Kamali et al. had a power of around 82% to differentiate the PD of (S)-warfarin between the wild-type and the *1/*3 genotype [9], but all other comparisons had powers of <80%. The reported observations were fully consistent with the powers (Table 6). There were four and seven false-negative cases, respectively, in PK and PD studies (indicated by tick marks that are not underlined in Table 6), where the simulations suggested lack of adequate power to detect differences between wild-type and the respective non-wild-type genotype, but the study found a statistically significant difference. It should be noted that this may happen by chance, as the level of type 1 error is set at 5% and hence every one out of 20 studies may indicate a difference which is not a true difference. However, the 11% rate for false-negative cases vs. the 8% rate for false positives (Table 6) may indicate some conservatism in our power calculations. This might reflect some overestimation of the variability in model parameters. The variances in the parameters of the PD model used in our simulations were based on data from only six healthy individuals (n = 6). Nevertheless, there was good overall concordance between the predicted and observed percentage of studies (20% vs. 21%; P-value of 0.8 from χ2) successful in differentiating (S)-warfarin PK or PD between the wild type and any single other genotype.
When ‘genotype-adjusted’ conditions were considered, a power of only 60% to detect differences in the AUEC between the wild type and a combination of any other genotype was reached with the maximum number of subjects studied of 550. Accordingly, the simulations indicate that the use of INR as a biomarker to adjust the dose of (S)-warfarin should preclude major differences in therapeutic response between genotypes. This supports the view that genotyping for CYP2C9 is only likely to be of value during the initial phase of warfarin therapy when INR is not yet indicative of final response. Accordingly, Schalekamp et al.[45] have recently shown that although other sources of variability such as polymorphism in the vitamin K epoxide reductase (VKORC1) gene can explain some of the variability in maintenance doses of acenocoumarol (21.4%), the time to achieve stable acenocoumarol therapy was associated with CYP2C9 but not VKORC1 genotype. A similar outcome may apply to warfarin therapy. Our simulations have attempted to assess the increase in study power (with respect to discerning the influence of CYP2C9 genotype) as a result of having prior knowledge of the VKORC1 genotype (Figure 3).
The simulations with the ‘enriched-recruitment’ design indicated the need for very small numbers of subjects to separate genotypes with respect to both PK and PD differences (Figure 6), albeit with the requirement for prior screening of many individuals in order to find the rare genotypes. It should be noted that frequent recruitment of individuals with rare genotypes into different trials may pose some practical and ethical problems.
Can the approach that we have used here to simulate the impact of genetic polymorphism on warfarin dosage be applied to new drugs in development? Given adequate prior in vitro information on the enzymes, especially cytochromes P450, involved in the metabolism of the compound and estimates of the relative activity of different genotypic forms and their population frequency, it may be possible to predict in vivo drug clearance as a function of genotype with reasonable accuracy. Although, in the case of warfarin, we have used in vivo information on its volume of distribution, it is possible to estimate this parameter from physicochemical characteristics and variation in organ size and composition [46, 47]. The degree to which a relevant PD model is available a priori may be more limited. However, even crude models based on in vitro receptor binding data and, indeed, any information on genetic variability in the target receptors could be informative in a model-building exercise [48]. Thus, in the future, CTS may increasingly utilize prior in vitro data in mechanistic PK–PD models. This approach, exemplified by the current study, to calculate statistical power avoids tenuous assumptions about the distributions and variation of primary PK parameters required by many current attempts at CTS.
Acknowledgments
GLD was sponsored by a PhD studentship from Simcyp Limited. GTT and AR-H are currently seconded part time to Simcyp Limited from the University of Sheffield.
Appendix
Pharmacokinetic modelling
Steady-state plasma concentrations of (S)-warfarin after multiple doses of rac-warfarin given every 24 h (τ) were generated using a one-compartment model with first-order absorption and a lag time [36]. Thus, values in the ith individual were given by:
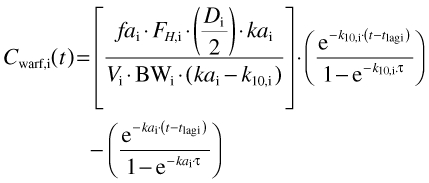 |
(1) |
where Cwarf,i(t), tlag, fai, FH,i, Di, kai, Vi, BWi and k10,i are, plasma drug concentration at time t, the lag time between administration and appearance of drug in the plasma (Table 3), the fraction of the dose absorbed (set to 1), the fraction escaping first-pass metabolism, the dose, a first-order absorption rate constant (Table 3), the steady-state volume of distribution (Table 3), body weight and a first-order elimination rate constant in the ith individual, respectively. All parameter values weretaken from Chan et al.[36] except FH,i, BWi and k10,I, which were calculated using the Simcyp® algorithm, and D, which was either a uniform daily dose of 3 mg or a dose taken from a population distribution as described in the main text.
Pharmacodynamic modelling
The anticoagulant effect of (S)-warfarin was simulated using an indirect response model in which it inhibits prothrombin synthesis, thereby changing prothrombin complex activity (PCA) in the blood as a function of time [36] (Figure 1). The rate of change of PCA is given by:
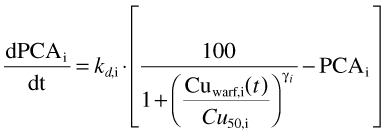 |
(2) |
where kd,i is the degradation rate constant of the prothrombin complex, Cu50,i is the unbound concentration of drug required to produce a 50% inhibition of PCA synthesis and γi is a measure of the steepness of the concentration–response curve (Hill coefficient) in the ith individual (Table 3).
PCA was converted to prothrombin time (PT) using the following equation from Chan et al.[36]:
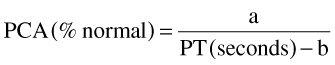 |
(3) |
where a and b are constants with variability (Table 3).
In turn, values of PT were converted to INR values using the following relationship taken from Adcock and Duff [40]:
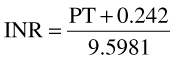 |
References
- 1.Eble J, West B, Link K. A comparison of isomers of warfarin. Biochem Pharmacol. 1966;15:1003. [Google Scholar]
- 2.Goldstein JA, de Morais SM. Biochemistry and molecular biology of the human CYP2C subfamily. Pharmacogenetics. 1994;4:285–99. doi: 10.1097/00008571-199412000-00001. [DOI] [PubMed] [Google Scholar]
- 3.Sullivan-Klose TH, Ghanayem BI, Bell DA, Zhang ZY, Kaminsky LS, Shenfield GM, Miners JO, Birkett DJ, Goldstein JA. The role of the CYP2C9-Leu359 allelic variant in the tolbutamide polymorphism. Pharmacogenetics. 1996;6:341–9. doi: 10.1097/00008571-199608000-00007. [DOI] [PubMed] [Google Scholar]
- 4.Takahashi H, Kashima T, Nomoto S, Iwade K, Tainaka H, Shimizu T, Nomizo Y, Muramoto N, Kimura S, Echizen H. Comparisons between in-vitro and in-vivo metabolism of (S)-warfarin: catalytic activities of cDNA-expressed CYP2C9, its Leu359 variant and their mixture versus unbound clearance in patients with the corresponding CYP2C9 genotypes. Pharmacogenetics. 1998;8:365–73. doi: 10.1097/00008571-199810000-00001. [DOI] [PubMed] [Google Scholar]
- 5.Takahashi H, Kashima T, Kimura S, Murata N, Takaba T, Iwade K, Abe T, Tainaka H, Yasumori T, Echizen H. Pharmacokinetic interaction between warfarin and a uricosuric agent, bucolome: application of in vitro approaches to predicting in vivo reduction of (S)-warfarin clearance. Drug Metab Dispos. 1999;27:1179–86. [PubMed] [Google Scholar]
- 6.Yamazaki H, Inoue K, Chiba K, Ozawa N, Kawai T, Suzuki Y, Goldstein JA, Guengerich FP, Shimada T. Comparative studies on the catalytic roles of cytochrome P450 2C9 and its Cys- and Leu-variants in the oxidation of warfarin, flurbiprofen, and diclofenac by human liver microsomes. Biochem Pharmacol. 1998;56:243–51. doi: 10.1016/s0006-2952(98)00133-6. [DOI] [PubMed] [Google Scholar]
- 7.Takanashi K, Tainaka H, Kobayashi K, Yasumori T, Hosakawa M, Chiba K. CYP2C9 Ile359 and Leu359 variants: enzyme kinetic study with seven substrates. Pharmacogenetics. 2000;10:95–104. doi: 10.1097/00008571-200003000-00001. [DOI] [PubMed] [Google Scholar]
- 8.Scordo MG, Pengo V, Spina E, Dahl ML, Gusella M, Padrini R. Influence of CYP2C9 and CYP2C19 genetic polymorphisms on warfarin maintenance dose and metabolic clearance. Clin Pharmacol Ther. 2002;72:702–10. doi: 10.1067/mcp.2002.129321. [DOI] [PubMed] [Google Scholar]
- 9.Kamali F, Khan TI, King BP, Frearson R, Kesteven P, Wood P, Daly AK, Wynne H. Contribution of age, body size, and CYP2C9 genotype to anticoagulant response to warfarin. Clin Pharmacol Ther. 2004;75:204–12. doi: 10.1016/j.clpt.2003.10.001. [DOI] [PubMed] [Google Scholar]
- 10.Takahashi H, Wilkinson GR, Caraco Y, Muszkat M, Kim RB, Kashima T, Kimura S, Echizen H. Population differences in S-warfarin metabolism between CYP2C9 genotype-matched Caucasian and Japanese patients. Clin Pharmacol Ther. 2003;73:253–63. doi: 10.1067/mcp.2003.26a. [DOI] [PubMed] [Google Scholar]
- 11.Loebstein R, Yonath H, Peleg D, Almog S, Rotenberg M, Lubetsky A, Roitelman J, Harats D, Halkin H, Ezra D. Interindividual variability in sensitivity to warfarin–nature or nurture? Clin Pharmacol Ther. 2001;70:159–64. doi: 10.1067/mcp.2001.117444. [DOI] [PubMed] [Google Scholar]
- 12.Lindh JD, Lundgren S, Holm L, Alfredsson L, Rane A. Several-fold increase in risk of overanticoagulation by CYP2C9 mutations. Clin Pharmacol Ther. 2005;78:540–50. doi: 10.1016/j.clpt.2005.08.006. [DOI] [PubMed] [Google Scholar]
- 13.Khan T, Wynne H, Wood P, Torrance A, Hankey C, Avery P, Kesteven P, Kamali F. Dietary vitamin K influences intra-individual variability in anticoagulant response to warfarin. Br J Haematol. 2004;124:348–54. doi: 10.1046/j.1365-2141.2003.04787.x. [DOI] [PubMed] [Google Scholar]
- 14.Peyvandi F, Spreafico M, Siboni SM, Moia M, Mannucci PM. CYP2C9 genotypes and dose requirements during the induction phase of oral anticoagulant therapy. Clin Pharmacol Ther. 2004;75:198–203. doi: 10.1016/j.clpt.2003.09.015. [DOI] [PubMed] [Google Scholar]
- 15.Joffe HV, Xu R, Johnson FB, Longtine J, Kucher N, Goldhaber SZ. Warfarin dosing and cytochrome P450 2C9 polymorphisms. Thromb Haemost. 2004;91:1123–8. doi: 10.1160/TH04-02-0083. [DOI] [PubMed] [Google Scholar]
- 16.Aithal GP, Day CP, Kesteven PJ, Daly AK. Association of polymorphisms in the cytochrome P450 CYP2C9 with warfarin dose requirement and risk of bleeding complications. Lancet. 1999;353:717–9. doi: 10.1016/S0140-6736(98)04474-2. [DOI] [PubMed] [Google Scholar]
- 17.Higashi MK, Veenstra DL, Kondo LM, Wittkowsky AK, Srinouanprachanh SL, Farin FM, Rettie AE. Association between CYP2C9 genetic variants and anticoagulation-related outcomes during warfarin therapy. JAMA. 2002;287:1690–8. doi: 10.1001/jama.287.13.1690. [DOI] [PubMed] [Google Scholar]
- 18.Margaglione M, Colaizzo D, D'Andrea G, Brancaccio V, Ciampa A, Grandone E, Di Minno G. Genetic modulation of oral anticoagulation with warfarin. Thromb Haemost. 2000;84:775–8. [PubMed] [Google Scholar]
- 19.Taube J, Halsall D, Baglin T. Influence of cytochrome P-450 CYP2C9 polymorphisms on warfarin sensitivity and risk of over-anticoagulation in patients on long-term treatment. Blood. 2000;96:1816–9. [PubMed] [Google Scholar]
- 20.Hillman MA, Wilke RA, Caldwell MD, Berg RL, Glurich I, Burmester JK. Relative impact of covariates in prescribing warfarin according to CYP2C9 genotype. Pharmacogenetics. 2004;14:539–47. doi: 10.1097/01.fpc.0000114760.08559.dc. [DOI] [PubMed] [Google Scholar]
- 21.King BP, Khan TI, Aithal GP, Kamali F, Daly AK. Upstream and coding region CYP2C9 polymorphisms: correlation with warfarin dose and metabolism. Pharmacogenetics. 2004;14:813–22. doi: 10.1097/00008571-200412000-00004. [DOI] [PubMed] [Google Scholar]
- 22.Sconce EA, Khan TI, Wynne HA, Avery P, Monkhouse L, King BP, Wood P, Kesteven P, Daly AK, Kamali F. The impact of CYP2C9 and VKORC1 genetic polymorphism and patient characteristics upon warfarin dose requirements: proposal for a new dosing regimen. Blood. 2005;106:2329–33. doi: 10.1182/blood-2005-03-1108. [DOI] [PubMed] [Google Scholar]
- 23.Siguret V, Gouin I, Golmard JL, Geoffroy S, Andreux JP, Pautas E. [Cytochrome P450 2C9 polymorphisms (CYP2C9) and warfarin maintenance dose in elderly patients] Rev Med Interne. 2004;25:271–4. doi: 10.1016/j.revmed.2003.11.006. [DOI] [PubMed] [Google Scholar]
- 24.Tabrizi AR, Zehnbauer BA, Borecki IB, McGrath SD, Buchman TG, Freeman BD. The frequency and effects of cytochrome P450 (CYP) 2C9 polymorphisms in patients receiving warfarin. J Am Coll Surg. 2002;194:267–73. doi: 10.1016/s1072-7515(01)01163-2. [DOI] [PubMed] [Google Scholar]
- 25.Jonsson EN, Sheiner LB. More efficient clinical trials through use of scientific model-based statistical tests. Clin Pharmacol Ther. 2002;72:603–14. doi: 10.1067/mcp.2002.129307. [DOI] [PubMed] [Google Scholar]
- 26.FDA. Drug Interaction Studies – Study Design, Data Analysis, and Implications for Dosing and Labeling – Preliminary Concept Paper. Available at http://www.fda.gov.lilac.une.edu/ohrms/dockets/ac/04/briefing/2004-4079B1_04_Topic2-TabA.doc (last accessed: 27 March 2006). [DOI] [PubMed]
- 27.Dickinson GL, Rezaee S, Lennard MS, Proctor NJ, Tucker GT, Rostami-Hodjegan A. Incorporating in vitro information on drug metabolism into clinical trial simulations to assess the effect of CYP2D6 polymorphism on pharmacokinetics and pharmacodynamics: dextromethorpan as a model application. J Clin Pharmacol. 2007;47:1–12. doi: 10.1177/0091270006294279. [DOI] [PubMed] [Google Scholar]
- 28.Rowland-Yeo K, Rostami-Hodjegan A, Tucker GT. Abundance of cytochromes P450 in human liver: a meta-analysis. Br J Clin Pharmacol. 2004;57:687–8. [Google Scholar]
- 29.Wilson ZE, Rostami-Hodjegan A, Burn JL, Tooley A, Boyle J, Ellis SW, Tucker GT. Inter-individual variability in levels of human microsomal protein and hepatocellularity per gram of liver. Br J Clin Pharmacol. 2003;56:433–40. doi: 10.1046/j.1365-2125.2003.01881.x. [DOI] [PMC free article] [PubMed] [Google Scholar]
- 30.Johnson TN, Tucker GT, Tanner MS, Rostami-Hodjegan A. Changes in liver volume from birth to adulthood: a meta-analysis. Liver Transplantation. 2005;11:1481–93. doi: 10.1002/lt.20519. [DOI] [PubMed] [Google Scholar]
- 31.Wilkinson GR, Shand DG. Commentary: a physiological approach to hepatic drug clearance. Clin Pharmacol Ther. 1975;18:377–90. doi: 10.1002/cpt1975184377. [DOI] [PubMed] [Google Scholar]
- 32.Obach RS. Prediction of human clearance of twenty-nine drugs from hepatic microsomal intrinsic clearance data: an examination of in vitro half-life approach and nonspecific binding to microsomes. Drug Metab Dispos. 1999;27:1350–9. [PubMed] [Google Scholar]
- 33.Cockcroft DW, Gault MH. Prediction of creatinine clearance from serum creatinine. Nephron. 1976;16:31–41. doi: 10.1159/000180580. [DOI] [PubMed] [Google Scholar]
- 34.Howgate EM, Rowland-Yeo K, Proctor NJ, Tucker GT, Rostami-Hodjegan A. Prediction of in vivo drug clearance from in vitro data. I. Impact of inter-individual variability. Xenobiotica. 2005;36:473–97. doi: 10.1080/00498250600683197. [DOI] [PubMed] [Google Scholar]
- 35.Lee CR, Goldstein JA, Pieper JA. Cytochrome P450 2C9 polymorphisms: a comprehensive review of the in-vitro and human data. Pharmacogenetics. 2002;12:251–63. doi: 10.1097/00008571-200204000-00010. [DOI] [PubMed] [Google Scholar]
- 36.Chan E, McLachlan A, O'Reilly R, Rowland M. Stereochemical aspects of warfarin drug interactions: use of a combined pharmacokinetic–pharmacodynamic model. Clin Pharmacol Ther. 1994;56:286–94. doi: 10.1038/clpt.1994.139. [DOI] [PubMed] [Google Scholar]
- 37.Nagashima R, O'Reilly RA, Levy G. Kinetics of pharmacologic effects in man: the anticoagulant action of warfarin. Clin Pharmacol Ther. 1969;10:22–35. doi: 10.1002/cpt196910122. [DOI] [PubMed] [Google Scholar]
- 38.Breckenridge A, Orme M, Wesseling H, Lewis RJ, Gibbons R. Pharmacokinetics and pharmacodynamics of the enantiomers of warfarin in man. Clin Pharmacol Ther. 1974;15:424–30. doi: 10.1002/cpt1974154424. [DOI] [PubMed] [Google Scholar]
- 39.O'Reilly RA. Studies on the optical enantiomorphs of warfarin in man. Clin Pharmacol Ther. 1974;16:348–54. doi: 10.1002/cpt1974162348. [DOI] [PubMed] [Google Scholar]
- 40.Adcock DM, Duff S. Enhanced standardization of the International Normalized Ratio through the use of plasma calibrants: a concise review. Blood Coagul Fibrinolysis. 2000;11:583–90. doi: 10.1097/00001721-200010000-00001. [DOI] [PubMed] [Google Scholar]
- 41.Holford NH. Clinical pharmacokinetics and pharmacodynamics of warfarin. Understanding the dose–effect relationship. Clin Pharmacokinet. 1986;11:483–504. doi: 10.2165/00003088-198611060-00005. [DOI] [PubMed] [Google Scholar]
- 42.Vecsler M, Loebstein R, Almog S, Kurnik D, Goldman B, Halkin H, Gak E. Combined genetic profiles of components and regulators of the vitamin K-dependent gamma-carboxylation system affect individual sensitivity to warfarin. Thromb Haemost. 2006;95:205–11. doi: 10.1160/TH05-06-0446. [DOI] [PubMed] [Google Scholar]
- 43.Aquilante CL, Langaee TY, Lopez LM, Yarandi HN, Tromberg JS, Mohuczy D, Gaston KL, Waddell CD, Chirico MJ, Johnson JA. Influence of coagulation factor, vitamin K epoxide reductase complex subunit 1, and cytochrome P450 2C9 gene polymorphisms on warfarin dose requirements. Clin Pharmacol Ther. 2006;79:291–302. doi: 10.1016/j.clpt.2005.11.011. [DOI] [PubMed] [Google Scholar]
- 44.D'Andrea G, D'Ambrosio RL, Di Perna P, Chetta M, Santacroce R, Brancaccio V, Grandone E, Margaglione M. A polymorphism in the VKORC1 gene is associated with an interindividual variability in the dose-anticoagulant effect of warfarin. Blood. 2005;105:645–9. doi: 10.1182/blood-2004-06-2111. [DOI] [PubMed] [Google Scholar]
- 45.Schalekamp T, Brasse BP, Roijers JF, Chahid Y, van Geest-Daalderop JH, de Vries-Goldschmeding H, van Wijk EM, Egberts AC, de Boer A. VKORC1 and CYP2C9 genotypes and acenocoumarol anticoagulation status: interaction between both genotypes affects overanticoagulation. Clin Pharmacol Ther. 2006;80:13–22. doi: 10.1016/j.clpt.2006.04.006. [DOI] [PubMed] [Google Scholar]
- 46.Poulin P, Theil FP. Prediction of pharmacokinetics prior to in vivo studies. II. Generic physiologically based pharmacokinetic models of drug disposition. J Pharm Sci. 2002;91:1358–70. doi: 10.1002/jps.10128. [DOI] [PubMed] [Google Scholar]
- 47.Rodgers T, Leahy D, Rowland M. Physiologically based pharmacokinetic modeling 1. Predicting the tissue distribution of moderate-to-strong bases. J Pharm Sci. 2005;94:1259–76. doi: 10.1002/jps.20322. [DOI] [PubMed] [Google Scholar]
- 48.Jonker DM, Visser SA, van der Graaf PH, Voskuyl RA, Danhof M. Towards a mechanism-based analysis of pharmacodynamic drug–drug interactions in vivo. Pharmacol Ther. 2005;106:1–18. doi: 10.1016/j.pharmthera.2004.10.014. [DOI] [PubMed] [Google Scholar]
- 49.Proctor NJ, Tucker GT, Rostami-Hodjegan A. Predicting drug clearance from recombinantly expressed CYPs: intersystem extrapolation factors. Xenobiotica. 2004;34:151–78. doi: 10.1080/00498250310001646353. [DOI] [PubMed] [Google Scholar]