

Abstract
What is already known about this subject
The pharmacokinetics of alemtuzumab have been incompletely described to date.
At most, presentations of half-life have been reported in clinical articles using data at the individual level.
What this paper adds
This paper presents a comprehensive population pharmacokinetic–pharmacodynamic model for alemtuzumab in B-CLL patients using lymphocyte counts as the biomarker and links the model to clinical outcomes.
Aims
To characterize alemtuzumab pharmacokinetics and its exposure–response relationship with white blood cell (WBC) count in patients with B-cell chronic lymphocytic leukaemia (CLL).
Methods
Nonlinear mixed effects models were used to characterize plasma concentration–time data and WBC count-time data from 67 patients. Logistic regression was used to relate summary measures of drug exposure to tumour response.
Results
Alemtuzumab pharmacokinetics were best characterized by a two-compartment model with nonlinear elimination where Vmax (µg h−1) was [1020 × (WBC count/10 × 109 l−1)0.194], Km was 338 µg l−1, V1 was 11.3 l, Q was 1.05 l h−1 and V2 was 41.5 l. Intersubject variability (ISV) in Vmax, Km, V1 and V2 was 32%, 145%, 84% and 179%, respectively. The reduction in WBC over time was modelled by a stimulatory loss indirect response model with values of 18.2 for Emax, 306 µg l−1 for EC50, 1.56 × 10⁹ cells l−1 h−1 for Kin and 0.029 per h for Kout. The probability of achieving a complete or partial response was ≥50% when the maximal trough concentration exceeded 13.2 µg ml−1 or when AUC0–τ exceeded 484 µg h−1 ml−1.
Conclusions
Alemtuzumab displayed time- and concentration-dependent pharmacokinetics with large interpatient variability, both in pharmacokinetics and pharmacodynamics, which was probably reflective of differences in tumour burden among patients. A direct relationship between maximal trough concentrations and clinical outcomes was observed, with increasing alemtuzumab exposure resulting in a greater probability of positive tumour response.
Keywords: exposure–response, indirect response model, logistic regression, model validation, nonlinear pharmacokinetics, NONMEM
Introduction
Alemtuzumab (Campath®) is a 150-kDa humanized IgG1 monoclonal antibody (MAb) that targets the CD52 antigen, a glycoprotein found on the cell surface of many cell types, including lymphocytes and monocytes. Alemtuzumab is currently approved for the treatment of B-cell chronic lymphocytic leukaemia (B-CLL) in patients who have been previously treated with an alkylating agent and who have failed fludarabine therapy. Use in this population was approved based on the results of a pivotal trial in 93 patients, many of whom had advanced disease, in which an overall response rate (complete and partial responders) of 33% was observed [1]. Alemtuzumab has also been or is currently being studied in the treatment of first- and second-line B-CLL, active relapse–remitting multiple sclerosis [2], solid organ transplant [3] and rheumatoid arthritis [4].
Alemtuzumab is currently administered as a 2-h intravenous infusion under a dose escalation scheme wherein patients receive 3 mg daily until well tolerated (e.g. infusion-related toxicities are ≤Grade 2), followed by 10 mg once daily until tolerated, and then 30 mg three times a week (Monday, Wednesday, Friday) for a maximum of 12 weeks. Dose escalation is usually accomplished within 3–5 days. Previous reports on the pharmacokinetics of alemtuzumab have been simplistic and generally limited to a description of half-life being reported [5–7]. The utility of these reports has been fairly limited in that they typically report a single value for alemtuzumab half-life. However, it is now clear that MAbs which target cellular antigens have far more complex, nonlinear pharmacokinetics, such that the half-life of these drugs is both dose and time dependent [8, 9]. When antigen concentration is high, plasma half-life is short because the MAb binds to its epitope and is subsequently rapidly cleared from the blood. However, as the antigen is depleted, clearance from the plasma decreases and plasma half-life increases. As the MAb accumulates, a new steady state is reached. Eventually, when the target is either totally depleted or saturated, the clearance of the MAb will be at its slowest and half-life will be at its longest, approaching the half-life of endogenous IgG (∼21 days).
There are no comprehensive analyses of alemtuzumab pharmacokinetics or of its exposure–response relationship with white blood cell (WBC) counts in patients with B-CLL. The primary purpose of this study was to conduct such an analysis, whereas the secondary objective was to characterize the exposure–tumour response relationship.
Methods
Study protocols and subjects
CAM002 was a Phase I/II, multicentre, open-label, noncomparative study in 52 patients with non-Hodgkin's lymphoma (NHL) and eight patients with B-CLL who had previously failed therapy with purine analogues and had not received alemtuzumab. Only data from CLL patients were included in the analysis. This was a multiple, ascending dose trial designed to evaluate the safety, tolerability and pharmacokinetics of alemtuzumab in the target patient population. Alemtuzumab doses ranged from 7.5 to 240 mg administered as a 2-h intravenous (i.v.) infusion. Doses were escalated within each patient depending on tolerability, generally beginning at 24-mg and ending at 240-mg doses. The targeted duration of alemtuzumab treatment was once-weekly infusion for 4 weeks. Blood samples to determine alemtuzumab concentrations were collected at the first and fourth infusions at the following nominal times: predose, mid-infusion, immediately post infusion and at 15 min, 30 min, 1 h, 2 h, 4 h, 6 h, 8 h, 24 h, 72 h and 168 h post infusion. Blood samples were also taken to determine peak and trough levels of alemtuzumab at the second and third infusions; predose, postdose and every 2 weeks after the first four infusions, then monthly after completion, until the concentrations were nonmeasurable.
CAM003 was a Phase I/II, multicentre, open-label, noncomparative study in 25 patients with NHL and five patients with CLL who had previously failed therapy with purine analogues and had not received alemtuzumab. Only data from CLL patients were included in the analysis. Patients were treated with multiple doses of 0.5, 5 or 50 mg alemtuzumab administered as an i.v. infusion. Doses were not escalated within each patient. Targeted duration of alemtuzumab treatment was five infusions per week for 4 weeks. Therapy could be continued for another 8 weeks in responding patients. Blood samples to determine alemtuzumab concentrations were collected immediately before and at the end of three infusions each week for the first 4 weeks of treatment, every 2 weeks during subsequent treatment and monthly following completion of treatment, until the concentrations were nonmeasurable.
CAM005 was a Phase II, multicentre, open-label, noncomparative study in 30 patients with B-CLL who had previously failed therapy with purine analogues and had not received alemtuzumab. Doses were escalated based on tolerability, generally starting at 3 or 10 mg and escalating to 30 mg alemtuzumab, which was then administered as an i.v. infusion three times weekly if well tolerated for 6 weeks. Patients with no evidence of disease after 6 weeks were discontinued from treatment and observed off-study for 6–8 weeks to confirm response. For patients with evidence of disease improvement or no change in disease at 6 weeks, treatment could continue at a dose of 30 mg three times a week for up to 12 weeks; patients with progressive disease were to be discontinued. For those patients continuing on treatment, evaluation of disease response was conducted again at 12 weeks. Under specific conditions, further treatment beyond 12 weeks was permitted. Blood samples to determine alemtuzumab concentrations were collected immediately before and at the end of the first infusion in each week of treatment, upon completion of treatment and 28 days after the final infusion.
CAM213 was a Phase II, multicentre, open-label, noncomparative study in 30 patients with B-CLL who had previously failed therapy with purine analogues and had not received alemtuzumab. The alemtuzumab dose was initiated at 3 mg, then increased to 10 mg, then increased to 30 mg, based upon patient tolerance during week 1, then treatment continued at 30 mg three times a week intravenously for a maximum of 12 weeks. Patients were treated to maximum response with alemtuzumab. If no disease was detectable by flow cytometry at the end of alemtuzumab therapy, then no further treatment was given and patients were followed. Patients with residual CLL detectable only by flow cytometry after alemtuzumab therapy were considered for autologous peripheral blood stem cell transplantation in an attempt to eradicate the residual detectable disease. Patients were followed until disease progression. Blood samples to determine alemtuzumab concentrations were collected at predose, 15 min, 30 min and 1 h after the end of the alemtuzumab infusion for the first 3-mg, 10-mg and 30-mg dose. In addition, for the first 30-mg dose there was a 4-h sample and possibly a 24-h, 48-h and 72-h sample depending on the day of the week when the patient finished escalation and reached the 30-mg dose. If the patient was able to tolerate the 30-mg dose by Wednesday, samples were to be taken at both 24 h and 48 h; if Thursday was the first 30-mg dose, samples were to be collected at 24 h only, and if Friday was the first 30-mg dose, then a sample was to be taken at 72 h. During week 2 of dosing, samples were taken on the first (Monday) and last (Friday) dose. These were predose, 15 min, 30 min and 1 h. For all subsequent weeks until the final dose, sampling occurred on the middle dose (Wednesday) only, once a week while on therapy. The final 30-mg dose was to be given on a Monday, if possible, and samples were taken at predose, 15 min, 30 min, 1 h, 4 h, 24 h, 48 h, 72 h and 96 h. Follow-up samples were taken after 7, 14, 21, 28 and 35 days. Detailed information and its results have been published separately [5].
All studies were approved by local Institutional Review Boards or Independent Ethics Committees and all patients gave informed consent prior to enrolling.
Analytical assay
Serum alemtuzumab concentrations in CAM002, CAM003 and CAM005 were assayed using a validated enzyme immunoassay (EIA). The lower limit of detection was 60 µg l−1. The quality control samples had a coefficient of variation of <30% at the lowest level (80 µg l−1) and were <20% for all other levels of controls. Serum concentrations of alemtuzumab in CAM213 were analysed using a validated indirect immunofluorescence assay with a CD52+ human T-cell line (HUT-78) as target cells. Binding was measured by flow cytometry and compared with the binding of standard samples in order to determine the effective serum concentration of alemtuzumab. The linear range of the method was 500–10 000 µg l−1. Control samples (measured using a 1 : 2 dilution) at concentrations of 1050, 5120 and 20 370 µg l−1 had an average accuracy of 111, 98 and 103%, respectively, with a coefficient of variation of 6, 11 and 22%, respectively [10].
Database assembly
The pharmacokinetic and pharmacodynamic databases were assembled by Projections Research Inc. During database assembly, the individual data records were scrutinized for possible errors. Missing dose records were imputed using the most recent previous dose and assuming that the imputed dose was administered using the protocol-specified dose regimen. There were no missing dose records immediately prior to pharmacokinetic or pharmacodynamic observations. There were no missing covariate data, so imputation was not required for covariates. All four studies included in this evaluation had dense pharmacokinetic and pharmacodynamic sampling. The pharmacokinetic database contained 1565 concentrations from 67 patients (approximately 23 pharmacokinetic observations per patient). The pharmacodynamic database contained 2632 observations (1565 concentrations and 1067 WBC observations) from 67 patients (approximately 16 pharmacodynamic observations per patient). Measures of outcome were limited to a single observation per patient.
Pharmacokinetic modelling methodology
Nonlinear mixed effect models using NONMEM (Version V, Build 1.1; GloboMax LLC, Hanover, MD, USA) were developed to characterize the pharmacokinetics of alemtuzumab in the patient population. All models were fit using the first-order conditional estimation (FOCE) method with interaction. The SLOW option, which utilizes the gradient method introduced in Nonmem IV, was implemented in order to improve the minimization process by avoiding local minima which can sometimes be a problem with the default method in Nonmem V (see the NMUSERS archive 24 May 2001 for a discussion of estimation methods). Traditional model-building techniques were used. For the pharmacokinetic evaluation, a base model without covariates was developed. Random effects were treated as log-normal in distribution. Residual error was modelled as a combination of additive and proportional error. Each covariate was then screened directly in NONMEM using a power function covariate model centred or scaled to a hypothetical reference patient. The reference patient used in this analysis was a patient with demographic factors that were approximately equal to the mean or median (e.g. weight, creatinine clearance) or most prevalent (e.g. sex or race) demographic. In some cases, lab normal values were used to generate the reference patient values. The following covariates were examined: age, weight, height, body surface area (BSA), body mass index (BMI), sex, race, study, WBC count and lymphocyte count. Wherever possible, covariate information for each patient was updated over time, therefore covariates such as WBC count changed over time for each patient. Covariates were examined graphically via plots of ηvs. covariate values. All covariates were tested using model-based evaluation as well as graphical evaluation. Covariate models were developed using forward stepwise regression with a significance level of 0.001 based on the likelihood ratio test (LRT) required to be retained in the model and backwards deletion using a significance level of 0.001 to remain in the model. A strict statistical criterion (α = 0.001) for inclusion of explanatory variables was selected in order to minimize the Type I error [11].
Pharmacodynamic modelling methodology
Nonlinear mixed effect models using NONMEM (Version V, Build 1.1; GloboMax LLC) were developed to characterize the pharmacodynamics of alemtuzumab in the patient population using WBC count as a biomarker of activity. Lymphocyte counts were also used as a biomarker. The resulting lymphocyte model was quite similar to WBC count model and is not presented here. All models were fit using the first-order approximation as models using FOCE had extremely long run times and failed to converge. Only the structural model relating WBC count to alemtuzumab exposure was developed; no covariates were evaluated. All random effects were treated as log-normally distributed, with the exception of the residual error, which was treated as normally distributed.
Formal model-based pharmacokinetic–pharmacodynamic analysis has not previously been conducted with alemtuzumab. Following administration by i.v. infusion of alemtuzumab, WBC counts generally decline rapidly. Based on the time course of WBC counts over time, alemtuzumab either acts to stimulate the loss of CD52+ cells or acts to inhibit the formation of new CD52+ cells. It was assumed that the mechanism of action of alemtuzumab would be similar to other therapeutic MAbs that target cellular antigens and stimulate the loss of target cells, which implies that the mechanism of action could be described using an indirect response model [12]. It should be noted that a series of inhibitory models (whereby alemtuzumab inhibits the formation of cells) was also tested (data on file), but these models were not pursued because they were not physiologically reasonable, were unstable, terminated or showed poor goodness of fit plots and other diagnostics. A precursor cell model [13] was also tested for some of the pharmacodynamic evaluations, but was not as predictive as the stimulatory loss indirect response model.
Model evaluation and qualification
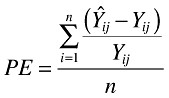
Model evaluation was aimed at testing both the descriptive capacity of the model, including robustness of the parameter estimates and adequacy of the fit as well as the predictive capacity of the model. Therefore, model qualification was conducted both to assess the model capacity to predict the individual observations over time as well as to simulate similar pharmacokinetic and pharmacodynamic behaviour. Diagnostic plots were assessed to confirm model performance for both the pharmacokinetic and pharmacodynamic models. In addition, the confidence intervals (CIs) of the parameter estimates for both models were evaluated using nonparametric bootstrapping. A total of 250 bootstrap replicate datasets were created and the parameters estimated. The number of replicates was limited to 250 due to the long run times for these models. Finally, the prediction error (PE) and root mean square error (RMSE) in the difference between the observed and individual predicted observations were calculated and summarized using descriptive statistics. The observations were Ln-transformed for the pharmacokinetic evaluation, but were not transformed for the pharmacodynamic evaluation. The equation for the calculation of the PE is:
 |
(1) |
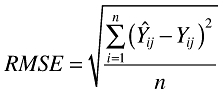
The equation used to calculate the RMSE is:
 |
(2) |
In these equations, Yij is the ith observed observation for the jth subject and Ŷij is the corresponding predicted observation.
The pharmacokinetic model was also evaluated using a predictive check [14, 15]. Two types of predictive check evaluations were conducted for the pharmacokinetic model, both based on a subset of the data, which consisted of patients who had sufficient sampling to estimate a half-life from the observed concentrations. In the first evaluation, a database based on the selected subset (dosing and covariate information were retained) was created with daily pharmacokinetic sampling. A total of 500 replicates were simulated using the final model to simulate expected concentrations and the 95% prediction intervals were generated. The observed data from the subset of patients were overlaid on the prediction intervals and compared visually. Because the dosing, sampling times and WBC information were so different for each patient, these predictive check evaluations were conducted separately for each patient. In the second evaluation, a series of 250 simulated datasets were generated using the actual sample times recorded in the selected subset of data. The final model was used to simulate the expected concentrations. Where evaluable, half-lives were calculated using WinNonlin (Version 5.1; Pharsight Corp., Mountain View, CA, USA) for both the actual and observed data. The half-life values from the observed and simulated data were ranked and frequency histograms of the ranked half-life values taken were generated. The half-life statistic was selected for evaluation, because this parameter was expected to vary based on concentration and other relevant covariates. Therefore if the predictive check for half-life showed good agreement under these changing conditions, model performance would be considered adequate.
Response and outcome analysis
Only data from Studies 213 and 005 were analysed for treatment outcome. Response criteria for both studies were defined using the 1996 National Cancer Institute Working Group response criteria for CLL [15]. Patients were categorized into complete response (CR), partial response (PR), stable disease (S.D.) or progressive disease (PD) based on their best response without regard to overall Campath exposure or number of cycles. The following measures of exposure were examined: the largest model predicted trough concentration over 5 days of dosing (which occurs on day 5 and which at steady state reduces to Cmin,ss), model predicted area under the curve (AUC0–τ) during the dosing interval for the last dosing event, total daily dose of the last dosing event, and model-predicted WBC nadir at the last dosing event. Ordinal logistic regression was used with the Logistic procedure in SAS, version 8.2 (SAS Institute, Cary, NC, USA) to relate measures of exposure to outcome [16]. In addition, patients were dichotomized into responders (CR or PR) or nonresponders (S.D. or PD). Logistic regression was then used to relate measures of exposure to the binary outcome measure. A P-value of 0.05 was considered statistically significant.
Results
Pharmacokinetic model
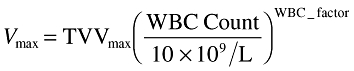
Table 1 presents a summary of patient demographics by study and pooled across studies. The best final pharmacokinetic model was a two-compartment model with zero order input and Michaelis–Menten elimination parameterized in terms of Vmax (the maximal rate of elimination), Km (the Michaelis constant), V1 (central compartment volume of distribution), Q (intercompartmental clearance) and V2 (peripheral volume of distribution). Vmax was described as
 |
(3) |
where TVVmax is the typical Vmax value for a patient having a WBC count of 10 × 109 l−1 and WBC_factor is the power function relating WBC count to Vmax. Intersubject variability (Ω) was described for Vmax, Km, V1 and V2 using a simple diagonal form. More complex models were tested but were rejected due to termination of the minimization process or questionable parameter estimates. Inter-occasion variability was not investigated. The model employed a combined constant coefficient of variation and additive residual error model. The final parameter estimates together with the bootstrap CIs are presented in Table 2. All parameters were precisely estimated. Figure 1 presents basic diagnostic goodness of fit plots for the final model. No obvious bias or model misspecification was identified in the final model, although the range of observed concentrations is substantially higher than the range of typical predicted concentrations, which is reflected in the large intersubject variability (ISV) that was observed for Km and V2. The conditional weighted residuals [17] showed no marked trend over time and were centred at zero. The calculated PE for the pharmacokinetic model was 0.737 and the RMSE was 0.00992, suggesting that the model performance was adequate given the range of concentrations in the database.
Table 1.
Demographic summary for patients in the pharmacokinetic and pharmacodynamic datasets
| Variable (units) | 002 | 003 | 005 | 213 | Pooled |
|---|---|---|---|---|---|
| Number of patients | 8 | 5 | 24 | 30 | 67 |
| Age (years) | 58 (48–72) | 66 (45–71) | 56 (46–75) | 60 (41–74) | 59 (41–75) |
| Weight (kg) | 69.4 (61–85) | 82.6 (57–167) | 70 (51–96) | 77.5 (45–123) | 72 (45–167) |
| Sex | 5 M/3 F | 4 M/1 F | 15 M/9 F | 25 M/5 F | 49 M/18 F |
| Creatinine clearance (ml min−1) | 69.2 (55.4–104) | 90.8 (48.0–137) | 70.4 (45.1–123) | 75.3 (30.4–150) | 70.7 (30.4–150) |
| WBC count (cells × 109 l−1) | 57.8 (1.9–281) | 28.5 (8.6–79) | 22.9 (4.1–310) | 62.8 (1.27–522) | 37.8 (1.3–522) |
| Lymphocyte count (cells × 109 l−1) | 92.0 (28.3–100) | 86.0 (59–95) | 16.9 (0.3–228) | 9.69 (0.01–185) | 28.3 (0.01–228) |
Data are reported as median (range). M, Male; F, female; WBC, white blood cell.
Table 2.
Final covariate pharmacokinetic model parameter estimates
| Parameter (units) | Population mean (SE*) | %CV intersubject variance (SE*) | Bootstrap summary statistics Lower 95% CI | Median | Upper 95% CI |
|---|---|---|---|---|---|
| TVVmax (µg h−1) | 1020 (9.5) | 32 (31.8) | 651 | 979.5 | 1840 |
| WBC factor | 0.194 (8.5) | – | 0.081 | 0.192 | 0.382 |
| Km (µg l−1) | 338 (27.5) | 145 (37.2) | 226 | 420.5 | 849 |
| V1 (l) | 11.3 (15.0) | 84 (21.2) | 8.92 | 12.4 | 16.4 |
| Q (l h−1) | 1.05 (2.0) | Not estimated | 0.443 | 1.17 | 2.13 |
| V2 (l) | 41.5 (32.8) | 179 (27.9) | 21.3 | 35.4 | 73.2 |
| CCV residual error | 37.2 (2.0) | 31.0 | 37.0 | 40.0 | |
| Additive residual error (µg l−1) | 64.73 (19.3) | 37.2 | 61.5 | 113.6 |
As percentage coefficient of variation. WBC, White blood cell; CCV, constant coefficient of variation.
Figure 1.

Basic diagnostic goodness of fit plots under the final pharmacokinetic model
The results of the visual predictive check evaluation are presented in Figure 2. Because the dosing, sample timing and WBC counts were so different between patients, these intervals were generated separately for each patient. A selected subset of patients with a high, average and low WBC count at the last dose are presented. For all three panels, the observations are contained within the prediction intervals and the model appears adequate to describe the observed data in this selected subset. The intervals are wide, reflecting the high interindividual variability in the model. The results of the predictive check of the calculated half-life are presented in Figure 3. The distribution of rankings shows that the observed half-life values were generally at or near the midpoint of the simulated half-life values. In addition, the half-life values obtained from the observed and simulated data were compared using a t-test and a Komolgorov–Smirnov test. The results obtained from these two tests suggested that the half-life values were similar both for the mean values and for the distribution of half-lives. Hence, all model evaluations indicated that the model did an adequate job of characterizing the pharmacokinetic profile of alemtuzumab.
Figure 2.

Results of visual predictive check for three selected individuals: a subject with a white blood cell (WBC) count of 281 × 109 cells l−1 prior to dosing (top); a subject with a WBC count of 1.1 × 10⁹ cells l−1 prior to dosing (middle); and a subject with a WBC count of 0.5 × 10⁹ cells l−1 prior to dosing (bottom). Ninety-five percent prediction intervals from final pharmacokinetic model vs. time after the last dose overlaid with observed concentration data from that subject
Figure 3.

Results of second predictive check evaluation. Distribution of ranking of observed half-life values compared with the distribution of half-life values from simulated data from selected subset
Pharmacodynamic model
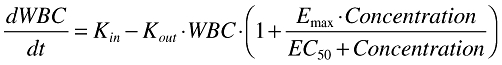
The best structural model was a simple indirect response model with a stimulation of Kout[18]. The equation for this model is:
 |
(4) |
In this equation, which describes the change in WBC over time, Kin is the zero order rate constant of cell formation, Kout is the first-order rate constant of cell death, Emax is the maximum effect of alemtuzumab on cell death and EC50 is the concentration at half maximal effect.
The residual error model was an additive model. Interindividual variability was described for all parameters except for Kout. The model contained a term describing the correlation of Emax and EC50. Models with a more complex Ω matrix structure were investigated, but they either terminated, had questionable parameter estimates and higher interindividual variability, or the objective function did not decrease sufficiently for the model to be accepted. Inter-occasion variability was not investigated.
Table 3 lists the model parameter estimates and the 95% CIs of the structural parameters based on 250 bootstrap replicates. The 95% CIs for the variance terms are not presented, as the number of replicates would need to be increased to estimate reliably the 95% CIs for variance terms. The estimates of interindividual variability are high, but may reflect differences between patients in CD52 receptor positivity, extent of illness and interassay variability. The ratio of Kin to Kout, 53.8 × 10⁹ l−1, is an estimate of the pretreatment WBC count that suggests a high baseline WBC count in patients, which is consistent with the high WBC count seen in patients with B-CLL. Several basic goodness of fit plots are shown in Figure 4. The observed vs. predicted plot shows scatter about the line of unity, although there are observations that are quite high, while the range of typical predicted WBC values is substantially lower than the observed range, which results in some apparent visual bias. The observed vs. individual predicted plot shows good scatter about the line of unity with no evident bias. The plot of conditional weighted residuals vs. typical predicted values shows that the range of conditional weighted residuals was generally within ±3 SD and the observations appeared to be uniformly scattered about the line of identity. Representative alemtuzumab concentration–time and WBC count–time plots under the final pharmacokinetic–pharmacodynamic model are shown in Figure 5. The model showed quite good descriptive characteristics given the complex interplay between alemtuzumab pharmacokinetics and pharmacodynamics.
Table 3.
Final covariate model pharmacodynamic parameter estimates for WBC counts
| Parameter (units) | Population mean (SE*) | %CV interindividual variance (SE*) | Bootstrap summary statistics Lower 95% CI | Median | Upper 95% CI |
|---|---|---|---|---|---|
| Emax | 18.2 (39.1) | 244 (100) | 9.11 | 17.1 | 120 |
| EC50 (µg l−1) | 306 (39.9) | 775 (83.7) | 94.4 | 280 | 1800 |
| Kin (cells × 109 l−1 h−1) | 1.56 (35.4) | 172 (68.7) | 0.367 | 1.62 | 3.63 |
| Kout (h−1) | 0.029 (14.1) | Not estimated | 0.019 | 0.029 | 0.048 |
| Additive residual error (cells × 109 l−1) | 15.6 (38.1) | 6.83 | 15.0 | 20.2 |
As percentage coefficient of variation. WBC, White blood cell.
Figure 4.

Basic diagnostic goodness of fit plots under the final pharmacodynamic model
Figure 5.

Individual predicted alemtuzumab concentrations and white blood cell (WBC) counts under the final pharmacokinetic and pharmacodynamic model for four representative patients. •, Alemtuzumab concentration; ○, WBC count; solid line, predicted alemtuzumab concentration; dashed line, predicted WBC count
Outcome analysis
A total of 48 patients had evaluable outcome data from Studies 005 and 213. Of these, two patients were classified as CR, 12 as PR, 22 as S.D. and 12 as PD. Patients were on treatment from 1 to 23 weeks in Study 005 (median 12.5 weeks) and from 5 to 16 weeks in Study 213 (median 12 weeks). One patient was identified as a possibly influential observation. This patient, who had stable disease, had a maximal trough concentration of 26.8 µg ml−1, the largest of all maximal trough concentrations observed, compared with a median of 6.0 µg ml−1.
When this questionable observation was included in the ordinal logistic regression model, maximal trough concentrations (P= 0.0029), AUC0–τ (P= 0.0052) and total daily dose of the last dosing event, e.g. 30 mg (P= 0.0370) were significant predictors of response, having coefficients of determination of 18%, 16% and 11%, respectively. When the questionable observation was not included in the analysis, the results were even more significant. WBC nadir was not a significant predictor of outcome with or without the questionable observation included in the analysis. When response was dichotomized into responders and nonresponders and the questionable observation included in the analysis, maximal trough concentrations (P= 0.0229) and AUC0–τ (P= 0.0297) were significant predictors of outcome (Figure 6). For conservatism, the influential observation was kept in the model. Maximal trough concentrations ranged from below the limit of quantification (BQL) to 26.8 µg ml−1 with a mean of 5.9 µg ml−1 in nonresponders and 3.6–21.0 µg ml−1 with a mean of 10.2 µg ml−1 in responders (P= 0.0088). Dose was not tested in this binary logistic analysis due to quasi-complete separation of dose and response. The probability of achieving a positive outcome was ≥50% when the maximal trough concentration exceeded 13.2 µg ml−1 or when AUC0–τ exceeded 484 µg h−1 ml−1.
Figure 6.

Scatter plot of probability of achieving a complete or partial response vs. model-predicted maximal trough concentrations (top) and AUC0–τ (bottom plot) in responders and nonresponders using logistic regression analysis. Patients in Study 005 are denoted with solid circles. Patients in Study 213 are denoted with open circles. Solid line is the model-predicted fit from logistic regression analysis with the potentially influential observation (highlighted with an arrow) included. Dashed line is the model-predicted fit with the influential observation removed. Grey boxes are the empirical probability of response based on five bins and including the questionable observation
When the influential observation was not included in the analysis, maximal trough concentrations (P= 0.0006), AUC0–τ (P= 0.0008) and last dose received (P= 0.0389) were significant predictors of response, having coefficients of determination of 27%, 27% and 11%, respectively. When response was dichotomized into responders and nonresponders, maximal trough concentrations (P= 0.0037) and AUC0–τ (P= 0.0039) were significant predictors of outcome (Figure 6). Quantifiable maximal trough concentrations ranged from 0.33 to 12.9 µg ml−1 with a mean of 5.2 µg ml−1 in nonresponders and 3.6–21.0 µg ml−1 with a mean of 10.2 µg ml−1 in responders (P= 0.0003). The maximal trough concentration required to achieve a 50% chance of responding was 10.3 µg ml−1, whereas the AUC0–τ to achieve a 50% chance of responding was 321 µg h−1 ml−1.
Discussion
The best structural model was a two-compartment model with Michaelis–Menten elimination. WBC count was the only important covariate identified in the pharmacokinetic analysis. The influence of WBC count on Vmax was strong, but was not surprising because alemtuzumab targets CD52, which is located on lymphocytes, a subclass of WBCs. It should be noted that because the WBC count varied over time (generally decreasing following administration of alemtuzumab), the parameter estimate for Vmax changed for each individual over time as well. The relationship of Vmax with a marker of receptor density has been noted for other MAbs such as efalizumab [19] and is consistent with a receptor-mediated clearance mechanism via internalization or antibody-dependent cytotoxicity. No covariates were identified that affect Km, which is consistent with the fact that Km reflects the intrinsic affinity of the clearing cells for alemtuzumab and would not be expected to be affected by the usual patient covariates used in a population analysis. Alemtuzumab is a 150-kDa protein that is unlikely to cross membranes; therefore it would be expected to be largely confined to the plasma and interstitial space. Extracellular fluid has been shown to be directly proportional to weight when examined across a variety of species [20]. It would be expected that central volume would also be directly proportional to weight and would be ∼14 l in a 70-kg person. In this analysis, a central volume of 11.3 l was identified, which was consistent with expectations, although weight was not identified as a covariate.
Because of its nonlinear and time-dependent pharmacokinetics, no single estimate of half-life can be reported. As concentrations increase (as would be expected at higher doses) alemtuzumab half-life will increase as well. Increased half-life is particularly noticeable in multiple-dose situations because of the accumulation of alemtuzumab and even more noticeable in patients whose WBC count is very low because the alemtuzumab's intrinsic clearance was found to be dependent on the WBC count. Therefore, patients with elevated WBC counts would be expected to have a shorter half-life than those who have a low or depleted WBC count. Under the current label, alemtuzumab half-life is listed as ∼11 h (range 2–32 h) after the first administration, but increases to 6 days (range 1–14 days) after the last 30-mg dose when WBC counts are at their nadir.
The intersubject variability in alemtuzumab pharmacokinetics was large (>30% for all pharmacokinetic parameters), which probably reflects the broad differences in circulating tumour burden, residual tumour burden within the bone marrow and available CD52 antigen, which is not unusual for a MAb that targets cellular antigens. Similarly large variability has been reported for other therapeutic antibodies such as epratuzumab [21], rituximab [22] and visilizumab [23].
There are few published reports on the pharmacokinetics of humanized MAbs in humans. Those that are published have generally evaluated narrow dose ranges that did not stress the system for linearity [24]. Using models developed in chimpanzees and applied to humans, Bauer et al.[8] have reported that the pharmacokinetics of hu1124 (later renamed efalizumab, Raptiva®), an anti-CD11a antibody, in patients with psoriasis were nonlinear and dependent on the plasma concentration of CD11a. As the dose of hu1124 increased from 0.1 to 10 mg kg−1, the apparent half-life increased from 0.4 days to 5 days. In addition, hu1124 pharmacokinetics were consistent with a two-compartment model. Clenoliximab also showed strong evidence of nonlinear behaviour and that the nonlinearity was at least partly reflective of the binding of the drug [25]. In the absence of published data, drug product labels also provide evidence of nonlinearity in the pharmacokinetics of humanized MAbs. Trastuzumab (Herceptin®) is reported to have increasing half-life and decreasing clearance as dose is increased from 10 to 500 mg once weekly [26]. Trastuzumab half-life is reported to be 1.7 days at 10 mg and 12 days at 500 mg. The product label for rituximab (Rituxan®) states that in patients receiving 375 mg m−2 once weekly, the apparent half-life is 76 h after the first administration and 206 h after the fourth infusion, an effect that is attributed to ‘variable tumour burden … and the changes in CD20-positive (normal and malignant) B-cell populations upon repeated administrations’[27]. Therefore, the nonlinear pharmacokinetics observed with alemtuzumab were consistent with other MAbs and probably represent a class effect for MAbs that target cellular antigens.
As with the pharmacokinetics, there are few published reports on the pharmacodynamics of humanized MAbs in humans. Graff et al.[28] modelled the relationship between a glycoprotein IIb/IIIa inhibitor and platelet aggregation. However, this agent exhibits a direct effect on platelet aggregation and its activity is analogous to that of aspirin in some respects. Lee et al.[29] have described the relationship between etanercept and patient response to therapy via at least a 20% reduction in American College of Rheumatology (ACR) score using logistic regression. The cumulative area under the concentration–time curve was used as the exposure variable with a 20% reduction in ACR score as the binomial clinical outcome measure for the analysis. Logistic modelling, however, overlooked the relationship between the drug exposure and change in target cell or receptor level, which drives the clinical response.
The first example of a physiologically based model describing the mechanism of a therapeutic MAb in patients was a model relating concentrations of anti-TAC (Zenepax®) to reduction in CD25+ T cells based on binding to the receptor [30]. The model then linked the reduction of CD25+ T cells to clinical response. A similar model was utilized to describe patient response to clenoliximab [25], hu1124 [8] and SB 249417 [31]. These results suggest a characteristic behaviour of therapeutic MAbs directed against specific cell targets. A similar approach was carried out in the present analysis of alemtuzumab, although a full cascade model could not be developed because the model was lacking data on receptor positivity and clinical outcome.
The pharmacodynamics of alemtuzumab as measured by WBC count were evaluated in this study. Alemtuzumab was found to reduce WBC count and lymphocyte count (data not shown). While the interaction between MAbs and target cells is generally mediated by binding to receptors and is therefore more readily related between free antibody concentration and CD receptor-positive cell count, the present evaluation of the pharmacodynamic behaviour of alemtuzumab has given reasonable results and provided some insight into the necessary patient exposure to provide an effect on clearance of tumour cells. The observed interindividual variability of the associated pharmacodynamic parameters was high, which was at least partly attributable to the fact that alemtuzumab targets CD52, which is not present on all WBCs, but rather is present on a subset of cells of different proportions for each patient. Patients also had a wide range of initial WBC counts (1.3–522 cells × 109 l−1), possibly due to varying response to prior therapy or varying disease status. These conditions will tend to inflate the variability of all associated pharmacodynamic parameters. Nevertheless, the pharmacodynamic model was adequate for describing the WBC data, but there were limitations. Few WBC count observations were collected after the end of therapy. An accurate estimate of Kin, which is a measure of how rapidly WBC counts replenish, could therefore not be obtained. The value of 1.56 × 10⁹ cells h−1 is clearly an overestimation of the true value because it would suggest that the patients relapse quickly after drug is removed, which has not been the case clinically. It seems likely, therefore, that additional data from B-CLL patients after treatment would be required to estimate these parameters more accurately and that extrapolation of WBC count data after the end of therapy is not recommended under this model.
While there have been many population pharmacokinetic analyses of chemotherapeutic agents, there have been only a handful that relate exposure to tumour response. In this analysis, patients that achieved a trough alemtuzumab concentration >13.2 µg ml−1 had a 50% chance of achieving either a CR or PR. One patient who had stable disease also had the highest maximal trough concentration and AUC0–τ in this population. Such a combination (high concentration, poor response) could influence the statistical analysis and possibly lead to erroneous conclusions. However, with or without this patient in the population analysis dataset, maximal trough concentration, AUC0–τ of the last dose and last total dose administered were all positively related to a favourable outcome. Of course, better results were obtained with this patient removed from the analysis, but there was no obvious reason to do so and so it was decided to keep this patient in the analysis. It should be noted that Hale et al.[5] analysed a subset of this dataset (Study 213) and in their analysis a significant positive correlation between maximal trough concentrations and increasing response was observed, which is consistent with this more model-based and larger sample size analysis. It should also be noted that these results are qualitatively similar to results from Montillo et al.[32], who showed that all patients having an AUC0−12 > 5 µg h−1 ml−1 achieved a CR.
In summary, a pharmacokinetic–pharmacodynamic model was developed for alemtuzumab in patients with B-CLL. Clearance was shown to be nonlinear with Vmax dependent on WBC count. No other covariates were important predictors of alemtuzumab disposition. Because alemtuzumab targets the CD52 antigen, it showed time-dependent pharmacokinetics with clearance decreasing as tumour burden decreased. Hence, alemtuzumab half-life increased with repeated dose administration due to saturation of clearance pathways and removal of receptor-mediated clearance. Alemtuzumab's effect on WBCs was best characterized by a stimulatory indirect response model in which WBCs were rapidly depleted with repeated administration. A direct relationship between maximal trough concentrations and outcome was observed, with increasing exposure resulting in a greater probability of positive tumour response.
Competing interests: P.L.B. is a Genzyme employee. D.R.M. and S.W. are consultants to Genzyme. A.B., S.R. and J.K. are employees of Schering AG. L.R.B. is a previous employee of Millenium Pharmaceuticals. M.J.K. and P.H. have received financial support from both Genzyme and Schering AG.
All financial support was provided by Genzyme.
References
- 1.Keating MJ, Flinn I, Jain V, Binet JL, Hillmen P, Byrd J, Albitar M, Brettman L, Santabarbara P, Wacker B, Rai KR. Therapeutic role of alemtuzumab (Campath-1H) in patients who have failed fludarabine: results of a large international study. Blood. 2002;99:3554–61. doi: 10.1182/blood.v99.10.3554. [DOI] [PubMed] [Google Scholar]
- 2.Moreau T, Coles A, Wing M, Thorpe J, Miller D, Moseley I, Issacs J, Hale G, Clayton D, Scolding N, Waldmann H, Compston A. CAMPATH-IH in multiple sclerosis. Mult Sclerosis. 1996;1:357–65. doi: 10.1177/135245859600100616. [DOI] [PubMed] [Google Scholar]
- 3.Knechtle SJ. Present experience with Campath-1H in organ transplantation and its potential use in pediatric recipients. Pediatr Tranplant. 2004;8:106–12. doi: 10.1046/j.1399-3046.2003.00139.x. [DOI] [PubMed] [Google Scholar]
- 4.Isaacs JD, Manna VK, Rapson N, Bulpitt KJ, Hazleman BL, Matteson EL, St Clair EW, Schnitzer TJ, Johnston JM. CAMPATH-1H in rheumatoid arthritis – an intravenous dose-ranging study. Br J Rheumatol. 1996;35:231–40. doi: 10.1093/rheumatology/35.3.231. [DOI] [PubMed] [Google Scholar]
- 5.Hale G, Rebello P, Brettman LR, Fegan C, Kennedy B, Kimby Leach M, Lundin J, Mellstedt H, Moreton P, Rawstron AC, Waldmann H, Osterberg A, Hillmen P. Blood concentrations of alemtuzumab and antiglobulin responses in patients with chronic lymphocytic leukemia following intravenous or subcutaneous routes of administration. Blood. 2004;104:948–55. doi: 10.1182/blood-2004-02-0593. [DOI] [PubMed] [Google Scholar]
- 6.Morris EC, Rebello P, Thomson KJ, Peggs KS, Kyriakou C, Goldstone AH, Mackinnon S, Hale G. Pharmacokinetics of alemtuzumab used for in vivo and in vitro T-cell depletion in allogeneic transplantations: relevance for early adoptive immunotherapy and infectious complications. Blood. 2003;102:404–6. doi: 10.1182/blood-2002-09-2687. [DOI] [PubMed] [Google Scholar]
- 7.Rebello P, Cwynarski K, Varughese M, Eades A, Apperley JF, Hale G. Pharmacokinetics of CAMPATH-1H in BMT patients. Cytotherapy. 2001;3:261–7. doi: 10.1080/146532401317070899. [DOI] [PubMed] [Google Scholar]
- 8.Bauer RJ, Dedrick RL, White ML, Murray MJ, Garovoy MR. Population pharmacokinetics and pharmacodynamics of the anti-CD11a antibody hu1124 in human subjects with psoriasis. J Pharmacokinet Biopharm. 1999;27:397–420. doi: 10.1023/a:1020917122093. [DOI] [PubMed] [Google Scholar]
- 9.Joshi A. Antibody Pharmacokinetics. Presented at the Annual Meeting of the American Assocation of Pharmaceutical Scientists, Salt Lake City UT.
- 10.Rebello P, Hale G. Pharmacokinetics of CAMPATH-1H: assay development and validation. J Immunol Meth. 2002;1:285–302. doi: 10.1016/s0022-1759(01)00556-7. [DOI] [PubMed] [Google Scholar]
- 11.Wahlby U, Jonsson EN, Karlsson MO. Assessment of actual significance levels for covariate effects in NONMEM. J Pharmcokin Pharmacodyn. 2001;28:231–52. doi: 10.1023/a:1011527125570. [DOI] [PubMed] [Google Scholar]
- 12.Dayneka NL, Garg V, Jusko WJ. Comparison of four basic models of indirect pharmacodynamic responses. J Pharmacokin Biopharm. 1993;21:457–78. doi: 10.1007/BF01061691. [DOI] [PMC free article] [PubMed] [Google Scholar]
- 13.Sharma A, Ebling WF, Jusko WJ. Precursor-dependent indirect pharmacodynamic response model for tolerance and rebound phenomena. J Pharm Sci. 1998;87:1577–84. doi: 10.1021/js980171q. [DOI] [PubMed] [Google Scholar]
- 14.Yano Y, Beal SL, Sheiner LB. Evaluating pharmacokinetic/pharmacodynamic models using the predictive check. J Pharmacokinet Pharmacodyn. 2001;28:171–92. doi: 10.1023/a:1011555016423. [DOI] [PubMed] [Google Scholar]
- 15.Cheson BD, Bennett JM, Grever M, Kay N, Keating MJ, O'Brien S, Rai KR. National Cancer Institute-sponsored Working Group guidelines for chronic lymphocytic leukemia: revised guidelines for diagnosis and treatment. Blood. 1996;87:4990–7. [PubMed] [Google Scholar]
- 16.Stokes M, Davis CS, Koch GG. Categorical Data Analysis Using the SAS System. Cary, NC: SAS Institute; 2000. [Google Scholar]
- 17.Hooker A, Staatz CE, Karlsson MO. 2006. p. 15. Conditional weighted residuals, an improved diagnostic for the FO/FOCE methods Abstr. 1001.
- 18.Jusko WJ, Ko HC. Physiologic indirect response models characterize diverse types of pharmacodynamic effects. Clin Pharmacol Ther. 1994;56:406–19. doi: 10.1038/clpt.1994.155. [DOI] [PubMed] [Google Scholar]
- 19.Ng CM, Joshi A, Dedrick RL, Garovoy MR, Bauer RJ. Pharmacokinetic–pharmacodynamic-efficacy analysis of efalizumab in patients with moderate to severe psoriasis. Pharm Res. 2005;22:1088–100. doi: 10.1007/s11095-005-5642-4. [DOI] [PubMed] [Google Scholar]
- 20.Peters RH. The Ecological Implications of Body Size. Cambridge: Cambridge University Press; 1983. [Google Scholar]
- 21.Perotti B, Doshi S, Chen D, Gayko U, Leonard JP, Wegener WA, Goldenberg DM, Cesano A. Pharmacokinetics of epratuzumab administered as a single agent or in combination with rituximab in patients with B-cell NHL. Proc Am Soc Clin Oncol. 2003;22:575. (Abstr. 2311) [Google Scholar]
- 22.Maloney DG, Grillo-Lopez AJ, Bodkin DJ, White CA, Liles T-M, Royston I, Varns C, Rosenberg J, Levy R. IDEC-C2B8: Results of a Phase I multiple-dose trial in patients with relapsed non-Hodgkin's lymphoma. J Clin Oncol. 1997;15:3266–74. doi: 10.1200/JCO.1997.15.10.3266. [DOI] [PubMed] [Google Scholar]
- 23.Carpenter PA, Appelbaum FR, Corey L, Deeg HJ, Doney K, Gooley T, Krueger J, Martin P, Pavlovic S, Sanders J, Slattery J, Levitt D, Storb R, Woolfrey A, Anasetti C. A humanized non-FcR-binding anti-CD3 antibody, visilizumab, for treatment of steroid-refractory acute graft-versus-host disease. Blood. 2002;99:2712–9. doi: 10.1182/blood.v99.8.2712. [DOI] [PubMed] [Google Scholar]
- 24.Dowell JA, Korth-Bradley J, Liu HL, Berger MS. Pharmacokinetics of gemtuzumab ozogamicin, an antibody-targeted chemotherapy agent for the treatment of patients with acute myeloid leukemia in first relapse. Clin Pharmacol. 2001;41:1206–14. doi: 10.1177/00912700122012751. [DOI] [PubMed] [Google Scholar]
- 25.Mould DR, Davis CB, Minthorn EA, Kwow KC, Elliot MJ, Luggen ME, Totoritis MC. A population pharmacokinetic–pharmacodynamic analysis of single doses of clenoliximab in patients with rheumatoid arthritis. Clin Pharmacol Ther. 1999;66:246–57. doi: 10.1016/S0009-9236(99)70032-9. [DOI] [PubMed] [Google Scholar]
- 26.Herceptin® (trastuzumab) South San Francisco: Genentech; 2001. Product label. [Google Scholar]
- 27.Rituxan® (rituximab) South San Francisco: Genentech; 2002. Product label. [Google Scholar]
- 28.Graff J, Klinkhardt U, Westrup D, Kirchmaier CM, Breddin HK, Harder S. Pharmacodynamic characterization of the interaction between the glycoprotein IIb/IIIa inhibitor YM337 and unfractionated heparin and aspirin in humans. Br J Clin Pharmacol. 2003;56:321–6. doi: 10.1046/j.0306-5251.2003.01873.x. [DOI] [PMC free article] [PubMed] [Google Scholar]
- 29.Lee H, Kimko HC, Rogge M, Wang D, Nestorov I, Peck CC. Population pharmacokinetic and pharmacodynamic modeling of etanercept using logistic regression analysis. Clin Pharmacol Ther. 2003;73:348–65. doi: 10.1016/s0009-9236(02)17635-1. [DOI] [PubMed] [Google Scholar]
- 30.Mould DR, Nieforth KA, Patel IH. The Population Pharmacokinetics and Pharmacodynamics of Humanized Anti-TAC. King of Prussia, PA: East Coast Nonmen User's Group; 1995. [Google Scholar]
- 31.Chow FS, Benincosa LJ, Sheth SB, Wilson D, Davis CB, Minthorn EA, Jusko WJ. Pharmacokinetic and pharmacodynamic modeling of humanized anti-factor IX antibody (SB 249417) in humans. Clin Pharmacol Ther. 2002;71:235–45. doi: 10.1067/mcp.2002.122276. [DOI] [PubMed] [Google Scholar]
- 32.Montillo M, Tedeschi A, Miqueleiz S, Veronese S, Cairoli R, Intropido L, Ricci F, Colosimo A, Scarpati B, Montagna M, Nichelatti M, Regazzi M, Morra E. Alemtuzumab as consolidation after a response to fludarabine is effective in purging residual disease in patients with chronic lymphocytic leukemia. J Clin Oncol. 2006;24:2337–42. doi: 10.1200/JCO.2005.04.6037. [DOI] [PubMed] [Google Scholar]