Abstract
Waves of spontaneous electrical activity that are highly synchronized across large populations of neurones occur throughout the developing mammalian central nervous system. The stages at which this activity occurs are tightly regulated to allow activity-dependent developmental programmes to be initiated correctly. What determines the onset and cessation of spontaneous synchronous activity (SSA) in a particular region of the nervous system, however, remains unclear. We have tested the hypothesis that activity itself triggers developmental changes in intrinsic and circuit properties that determine the stages at which SSA occurs. To do this we exposed cultured slices of mouse neocortex to tetrodotoxin (TTX) to block SSA, which normally occurs between embryonic day 17 (E17) and postnatal day 3 (P3). In control cultured slices, SSA rarely occurs after P3. In TTX-treated slices, however, SSA was generated from P3 (the day of TTX removal) until at least P10. This indicates that in the absence of spontaneous activity, the mechanisms that normally determine the timing of SSA are not initiated, and that a compensatory response occurs that shifts the time of SSA occurrence to later developmental stages.
Spontaneous electrical activity plays critical instructive roles in brain development (Moody & Bosma, 2005). In many regions of the mammalian brain, spontaneous activity is synchronized across large populations of neurones with frequencies ranging from 0.5 to 2 events min−1 (retina: Meister et al. 1991; spinal cord: O'Donovan et al. 1998; hindbrain: Gust et al. 2003; hippocampus: Ben-Ari et al. 1989; cortex: Garaschuk et al. 2000; Corlew et al. 2004). This spontaneous, synchronized activity (SSA) is generated and synchronized in some structures by mechanisms that involve discrete pacemaker populations of neurones (Hunt et al. 2005), but in others relies on the emergent properties of networks that combine mutual excitation with post-activity depression (Butts et al. 1999; Tabak et al. 2001). In some regions of the brain, such as the hippocampus, evidence for both types of mechanisms exists (Strata et al. 1997; Leinekugel et al. 1998; Menendez de la Prida et al. 1998). In all cases, SSA occurs during a discrete period of early development, although that period differs among regions of the brain and spinal cord (Moody & Bosma, 2005).
The mechanisms that generate SSA rely on intrinsic properties of neurones and their synaptic interactions that are unique to early developmental stages (Barish, 1986; Owens et al. 1996; Greaves et al. 1996; Dallman et al. 1998, 2000; Corlew et al. 2004; Moody & Bosma, 2005). These properties, as well as the types of spontaneous activity they mediate, are incompatible with the mature functions of neurones (Moody & Bosma, 2005). For this reason, the transition out of an immature state, in which SSA is favoured, to a mature state, in which neurones generally operate asynchronously, is a critical feature of nervous system development. Many of the changes in ion channel and receptor properties that characterize this transition are triggered by spontaneous activity itself (Dallman et al. 1998; Ganguly et al. 2001; Moody & Bosma, 2005). These results raise the possibility that SSA is self-terminating, and thus that the transition between the immature and mature signalling properties of neurones depends on activity generated in the immature state. It is also possible, although much less well studied, that the onset of SSA is self-reinforcing, such that the complete expression of the mechanisms that initiate SSA requires that the activity begins to be generated.
In mouse cortex, SSA occurs during a brief window of development between embryonic day 17 (E17) and postnatal day 3 (P3) (Corlew et al. 2004; see also Garaschuk et al. 2000 for similar results in rat cortex). This activity is rarely, if ever, seen after the first postnatal week. We have found that when activity is blocked during its normal window of occurrence (between E17 and P3), SSA shifts in time so that it occurs throughout the period from P3 to P10, almost a week later than normal. This demonstrates that in the absence of activity, the mechanisms that normally determine the timing of SSA are not triggered, and that as a result either the onset or the termination of SSA, or both, fail to occur at the normal stages of development. Auto-regulation of spontaneous activity during development may have important implications for the interpretation of experiments in which activity is blocked to assess its developmental functions.
Methods
Animals
All procedures were in accordance with NIH guidelines, and were approved by the Institutional Animal Care and Use Committee of the University of Washington. Time-mated Swiss-Webster mice were purchased from Harlan (Kent, WA, USA). To prepare slices for culture, pregnant females were killed on gestational day 17 (E17) by CO2 inhalation, fetuses were removed and decapitated, and brains were dissected out in ice-cold artificial cerebrospinal fluid (ACSF; see solutions) equilibrated with carbogen gas (95% O2–5% CO2). For acute slice experiments, pups at stages P0–P10 were killed by decapitation, and brains dissected out as above.
Preparation and culture of brain slices
Brains were mounted in the holder of a Vibratome (Model 1000; Technical Products International, St Louis, MO, USA) and sliced in the coronal plane in ice-cold ACSF. For culture, slices from E17 embryos were placed on Millicell sterilized culture plate inserts (Millipore Corporation, Billerica, MA, USA) in 1 ml cell culture medium (see solutions), and placed in an H2O-jacketed incubator (Thermo Electron Corporation, Forma Scientific, Waltham MA, USA) at 36–37°C in 5% CO2. For both experimental and control slices, medium was changed at days 2 and 5 in culture, and then every other day until the slice was used. Experimental slices (see Results) were cultured initially in medium containing 1 μm tetrodotoxin (Sigma; 3 mm stock in dH2O diluted to a final concentration of 1 μm). The TTX-containing medium was replaced with control medium on day 5 in culture ( = P3), at the same time that medium was changed for control slices. For acute and cultured slice patch clamp experiments, slices were allowed to recover at 30°C in oxygenated ACSF for 1–3 h before being placed in the experimental chamber.
Solutions and drugs
Cell culture medium contained 75% sterile Neurobasal-A™ medium (1×) (Invitrogen, Carlsbad, CA, USA), 25% horse serum (Sigma), penicillin (100 IU ml−1), streptomycin (0.1 mg ml−1), and 2 mml-glutamine (HyClone Laboratories Inc., Logan, UT, USA). Artificial cerebrospinal fluid contained (mm): 140 NaCl, 3 KCl, 2 MgCl2, 2 CaCl2, 1.25 NaHPO4, 26.5 NaHCO3 and 20 d-glucose. All salts were obtained from Sigma (St Louis, MO, USA). Drugs were kept as frozen stock solutions, and added to ACSF just before use: d(−)-2-amino-5-phosphonopentanoic acid (d-AP5): 10 mm stock in dH2O; (−)-bicuculline methobromide: 50 mm stock in dH2O; picrotoxin: 5 mm stock in DMSO; 6-cyano-7-nitroquinoxaline-2,3-dione (CNQX) disodium salt: 25 mm stock in dH2O; muscimol: 50 mm stock in dH2O. All drugs were obtained from Tocris Bioscience (Ellisville MO, USA).
Ca2+ imaging
Cultured tissue slices were removed from the incubator and held in room temperature oxygenated ACSF for 60–90 min. Slices were then immersed in oxygenated ACSF containing the [Ca2+]i-indicating dye fluo-4 (1.5 μm; Molecular Probes, Eugene, OR, USA) and 0.07% Pluronic F-127 for 30 min. Slices were rinsed and placed into a glass-bottomed chamber on the stage of an upright microscope (Zeiss Axioskop) equipped with a ×20 water-immersion fluorescence objective, and continuously superfused with oxygenated ACSF at a rate of 1 ml min−1 at room temperature. Images were captured with CoolSnap ES camera (Photometrics, Tucson, AZ, USA) using a capture time of 300 ms at an interval of 1.0 s, using MetaFluor software (Universal Imaging, West Chester, PA, USA). At the start of each experiment, an area of the cortex, 700 μm wide and 892 μm deep, was selected for imaging. Areas were generally in the superior lateral aspect of the coronal slice, lateral to the midline and encompassing the developing cortical layers. For each experiment, 23–86 individual cell bodies were selected, spanning the complete depth and width of the imaged area. Each individual trace in the records represents the average fluo-4 fluorescence within a single cell as a function of time. For analysis, all traces from each experiment were exported into SigmaPlot (SPSS, Chicago, IL, USA). Records were smoothed using a software high-pass filter to remove baseline drift. For quantitative analysis of activity in individual cells and of synchrony among cells, traces were idealized using a custom-written threshold detection routine based on a ΔF/F event detection. Each point in the data that fell above the detection criterion was converted to 1.0 and each point below threshold to 0.0. This produced a binary event trace for each cell of each experiment (Gust et al. 2003). All idealized records from each experiment were then averaged, producing a single summary record in which each [Ca2+]i transient has an amplitude between 0.0 and 1.0 that indicates the fraction of cells participating in that event (Gust et al. 2003; Corlew et al. 2004). From these summary records, we calculated the average frequency of events showing ≥ 50% synchrony and the average synchrony of events with ≥ 20% synchrony (synchronicity index).
Electrophysiology
Pipettes were pulled to a resistance of 3.5–8 MΩ from 50 μl haematocrit glass capillary tubes using a two-stage puller (Narishige, Tokyo, Japan), and filled with potassium internal solution, which contained (mm): 113 KMeSO4 (ICN Biomedicals), 28 KCl, 10 Hepes, 2 MgATP, 3 Na2-ATP, and 0.2 Na-GTP, pH to 7.25. Individual neuronal somata were visualized with an upright microscope (Zeiss Axioskop) using a water immersion ×63 objective with DIC optics. Recordings were made using a List EPC-7 (Heka Elektronik, Lambrecht/Pfalz, Germany) or Axopatch 1-D (Axon Instruments, Union City, CA, USA) amplifier. Cells targeted for recording were in cortical layers 2–6. After formation of a seal (> 2 GΩ), a holding potential of −60 mV was applied, and brief pulses of suction were delivered until the membrane inside the pipette ruptured. Currents were filtered at 1.5 kHz with an 8-pole Bessel characteristic, recorded and analysed using pCLAMP8 software (Axon Instruments). Input resistance (Rin) was calculated from the linear fit to steady-state currents at voltages from −80 mV to −40 mV (±10, ±20 mV steps from −60 mV). Sodium and potassium currents (INa and IK) were extracted from cellular responses to pulses ranging from −20 to +70 mV from −60 mV, after leak subtraction. INa was measured at its peak value; IK was measured at +70 mV. Current densities were calculated by dividing current amplitude by capacitance. To measure capacitance, a triangle wave voltage command was used, and capacitance measured from the amplitude of the resulting square-wave current (Moody & Bosma, 1985). The hyperpolarization-activated cation current (Ih) was measured at −120 mV during a series of negative pulses ranging from +10 to −120 from −50 mV. Current density was calculated as peak current divided by the capacitance of the cell. Most cells were also held under current clamp to investigate the presence and form of spontaneous activity. During current clamp, negative holding current was applied to keep the resting potential near −60 mV. Analysis of burst frequency, mean voltage trajectory between bursts, and other parameters (see Results) was done in either SigmaPlot or MatLab (The Math Works, Natick, MA, USA).
Results
Cultured slices show normal developmental events
In order to test the physiological effects of blocking SSA in cultured slices, it was first necessary to show that ion channel development occurs normally in culture, and that those slices generate SSA primarily between E17 and P3, the stages at which this activity is observed in acute slices (Corlew et al. 2004).
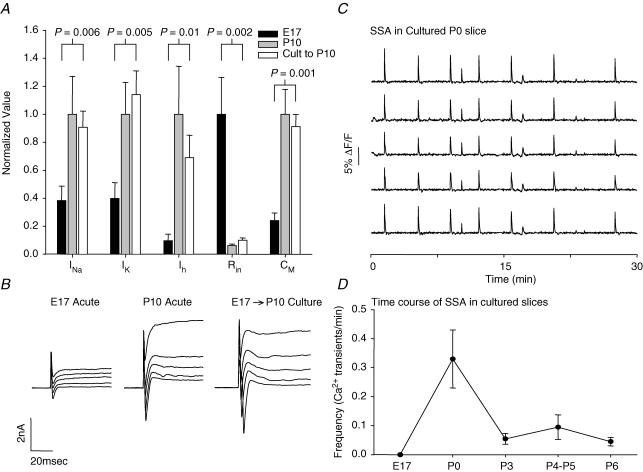
In previous work, we measured the development of ionic currents, input resistance and membrane capacitance from E14 to P10 (Picken-Bahrey & Moody, 2003a,b). Based on those measurements, we asked whether development of these properties in slices cultured from E17 to P10 was similar to that seen in vivo, as judged by their values in E17 and P10 acute slices. Figure 1A compares values of sodium current (INa), outward K+ current (IK), the hyperpolarization-activated cation current (Ih), input resistance (Rin), and capacitance (Cm) in acute E17 slices, acute P10 slices, and slices cultured from E17 to P10. These properties change by factors of 2.5–16 between E17 and P10, and thus are robust indicators of development in culture. In each case, the values taken from cultured slices at P10 are significantly different from those in acute E17 slices, but not different from those in acute P10 slices. This indicates that basic electrophysiological properties develop normally in culture during this period. Therefore, the developmental changes in neuronal firing properties which result from activity block can be assessed in cultured slices. Records of INa and IK taken from the three conditions are shown in Fig. 1B. (A transient component to the outward K+ current was more prominent in cultured slices. This was not studied further because it did not differ between control and TTX-treated cultured slices. See Fig. 10.)
Figure 1. Normal development of electrical properties in cultured slices.
A, comparison of sodium current (INa), outward K+ current (IK), the hyperpolarization-activated cation current (Ih), input resistance (Rin), and capacitance (CM) values in neurones from acute E17 slices (black), acute P10 slices (grey), and slices cultured from E17 to P10 (white). For each parameter the values in acute P10 slices and the cultured E17–P10 slices were significantly different from the acute E17 slices, but were not significantly different from each other. Significance values for (E17 acute) versus (E17 cultured to P10) slices are shown on the plot; significance values for (P10 acute) versus (E17 cultured to P10) slices were all ≥ 0.15. B, voltage-clamp records for composite INa and IK in the same three conditions as A. C, spontaneous synchronous [Ca2+]i transients recorded from a cultured P0 slice in which 69 neurones were imaged for 46 min. Shown are data from 5 cells for 30 min of the recording. 61/69 neurons participated in this synchronous activity. D, time course of SSA in cultured slices. Frequency of synchronous events is shown as a function of developmental stage. SSA shows a strong peak at P0, as in acute slices. The E17 time point is from acute slices, since culture started at that stage in our experiments.
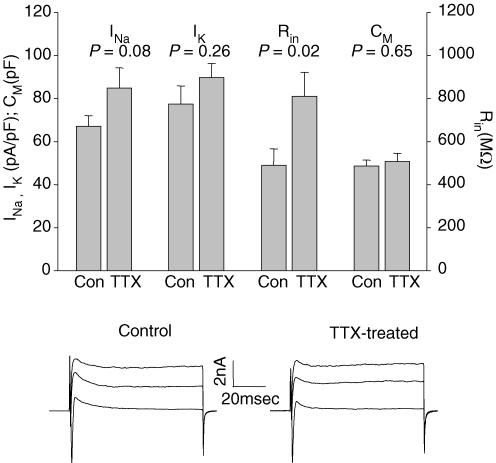
Figure 10. Comparison of intrinsic neuronal properties in TTX-treated and control slices.
Comparison of inward sodium current (INa), delayed outward K+ current (IK), input resistance (Rin), and capacitance (CM) in control and TTX-treated slices. All records were from P6–P9 cultured slices. INa, IK, and Rin are expressed as densities, normalized to capacitance. The y-axis scale shows actual density or capacitance numbers. Composite INa and IK voltage-clamp traces from cells in control and TTX-treated P8 slices are shown below.
Slices cultured from E17 also showed spontaneous synchronized activity (measured as [Ca2+]i transients) at P0 (Fig. 1C) at a mean frequency of 0.33 ± 0.1 events min−1. This frequency is somewhat lower than seen in acute P0 slices (0.91 ± 0.12 events min−1, n = 59; Corlew et al. 2004), probably due to the fact that acute slices were studied at 30–35°C and 5 mm [K+], whereas the present experiments were done at room temperature and 3 mm [K+]. We also measured SSA in cultured slices at P3–P6 and at E17 (acute slices before culturing), to determine whether the time course of SSA in cultured slices approximates that measured in acute slices (Corlew et al. 2004). These data are shown in Fig. 1D, and indicate that as in acute slices, SSA appears between E17 and P0 in cultured slices, then declines by a factor of 6 between P0 and P3.
Activity-blocked slices show high levels of synchronous activity at P3–P10
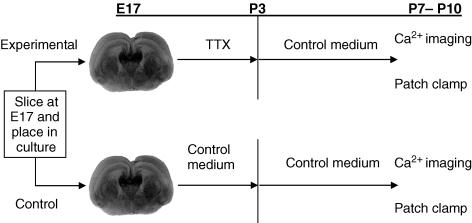
To test whether blocking spontaneous activity changes the time course over which SSA is expressed, we cultured slices from E17 to P3 in TTX-containing medium, which blocks activity (Corlew et al. 2004), then returned the slices to control medium and measured SSA using calcium imaging methods at stages ranging from P3 (the day of TTX removal) to P11. Control slices were cultured using identical methods but were not exposed to TTX. The experimental design is shown in Fig. 2. In the sections below, we refer to cultured slices by their chronological ages and treatment. So, for example, ‘TTX-treated P6’ refers to a slice cultured at E17, exposed to TTX-containing medium for the first 5 days in vitro (until P3), and then maintained in culture for an additional 3 days in control medium before being used in an experiment.
Figure 2. Experimental design.
Coronal brain slices were placed into culture on E17. Experimental slices were exposed to medium containing 1 μm TTX from E17 until P3, at which time the medium was replaced with control medium for the remainder of culture. For both control and experimental slices, medium was changed at P0 (E17 + 2 days in vitro), at P3 (5 DIV), and then every 2 days after P3 until the slices were removed for experiments.
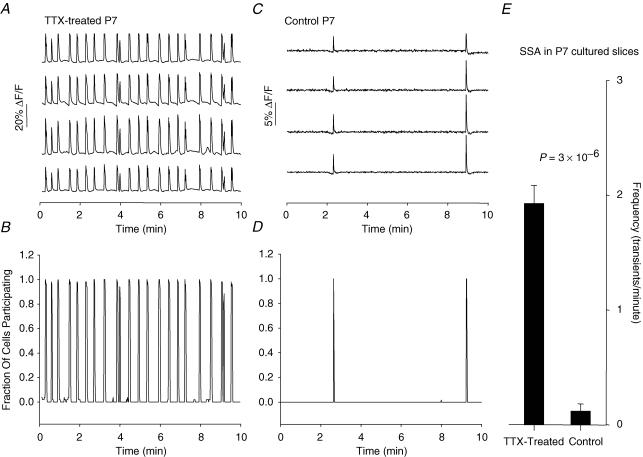
Slices that had activity blocked by TTX from E17–P3 in vitro showed robust synchronous activity at P7 whereas control cultured slices had little, if any, such activity (Fig. 3) (TTX-treated: 1.94 ± 0.16 events min−1, n = 13; control: 0.12 ± 0.06 events min−1, n = 5; P = 3 × 10⁻⁶ by Student's unpaired t test). This activity occurred at somewhat higher frequency than the normal activity in acute P0 slices (acute P0: 0.91 ± 0.12 events min−1; P = 4 × 10⁻⁴versus TTX-treated cultured slices), and showed higher synchronicity: 0.90 ± 0.04 (n = 13; Fig. 3B), compared to 0.52 ± 0.04 in acute P0 slices (P = 1 × 10⁻⁵). The activity present in later stage TTX-treated slices was completely and reversibly blocked by acute application of TTX (see Fig. 8; n = 3).
Figure 3. High-frequency SSA at abnormally late stages in TTX-treated slices.
A, spontaneous [Ca2+]i transients in 4 neurones (out of 38 imaged) from a P7 TTX-treated slice displaying robust spontaneous, synchronous [Ca2+]i transients. To quantify the synchronicity and frequency of activity from [Ca2+]i transients measured in large numbers of neurones, each record (representing activity in a single neurone) was idealized, and then all records from a single experiment were averaged, yielding a summary plot in which each transient has an amplitude between 0 and 1, representing the fraction of cells that participate synchronously in that event. From these summary records we extract the total frequency of events (with synchronicity = 0.5) and the mean synchronicity of all events that involve more than 20% of the cells (see Methods; see also Corlew et al. 2004). B, summary record prepared in this way from the TTX-treated slice shown in A; 52 cells imaged. Note that in this slice, 100% of the cells imaged participated in almost all transients. C, 4 representative neurones from a P7 control slice, displaying relatively little spontaneous activity. D, summary record for the TTX-treated slice shown in C; 49 cells imaged. Note that although activity is rare, when it does occur it is still highly synchronous. E, comparison of activity in TTX-treated and control cultured P7 slices reveals significantly higher frequency in TTX-treated slices.
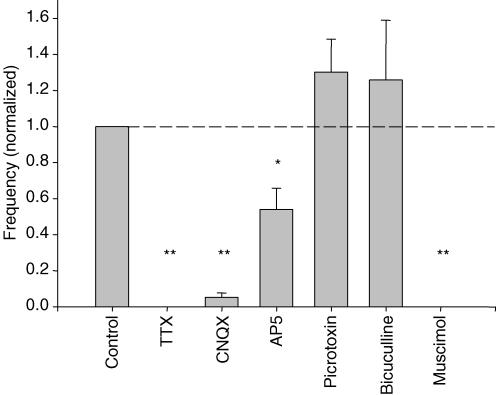
Figure 8. Summary of drug effects on SSA frequency.
Summary of the effects of TTX (n = 3), CNQX (n = 6), AP5 (n = 6), picrotoxin (n = 6), bicuculline (n = 6) and muscimol (n = 5) on the frequency of spontaneous [Ca2+]i transients in TTX-treated slices. All frequencies are normalized to their values in the same slices before drug application. P-values were calculated by paired t tests of frequencies before and after drug application in each slice. *P < 0.05; **P < 0.01. The effects of picrotoxin (P = 0.24) and bicuculline (P = 0.66) were not significant.
Developmental time course of activity after removal of block
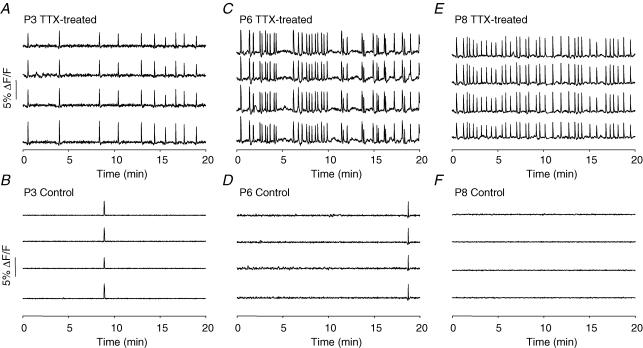
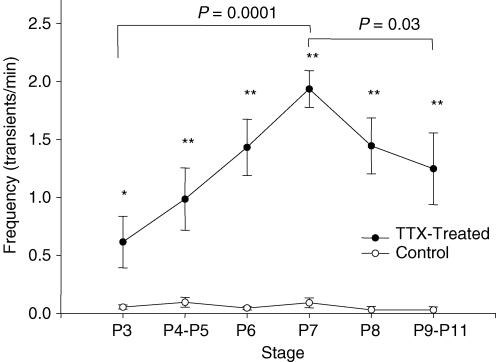
To measure the time course of SSA development in cultured TTX-treated slices, we recorded [Ca2+]i transients from 58 experimental and 18 control slices at stages ranging from P3 (the day of TTX removal) to P10. At all stages between P3 and P10, we detected SSA in TTX-treated slices. SSA is very rare in control slices at these stages (Fig. 4) Figure 5 shows the frequency of activity (transients with > 50% of cells participating) as a function of stage for TTX-treated and control slices. At each time point, TTX-treated slices showed significantly more synchronous activity than controls. (Although when SSA was detected in control slices, its synchronicity was not different from that in TTX-treated slices: TTX-treated, 0.88 ± 0.02, n = 58; control, 0.84 ± 0.07, n = 14; P = 0.41.) The frequency of SSA in TTX-treated slices increased steadily from P3 to P7, and then diminished somewhat by P9–P11. Measurements after P11 were not made, because we could not rule out the possibility that a lack of activity at those stages reflected deterioration in the condition of slices in culture. The time course of SSA shown in Fig. 5 shows a more gradual onset and termination than that in acute slices (Corlew et al. 2004); thus, in addition to reaching its maximum frequency seven days later, SSA in TTX-treated slices extends over a slightly longer period of time than normal SSA. In several slices we detected robust synchronized activity as early as 30 min after TTX removal on P3. We have not been able to detect SSA within the first 30 min after removal of TTX during imaging sessions, although this may merely reflect a less complete removal of TTX by perfusion during imaging than by bulk solution change in the culture dish. We therefore cannot be certain whether the onset of the mechanisms that initiate SSA occurs after TTX removal or during the period of TTX block. Nonetheless, our data indicate that blocking SSA during the normal time of its occurrence disrupts the mechanisms that determine either the onset or the termination of SSA, or both.
Figure 4. Time course of SSA development.
A, C and E, spontaneous [Ca2+]i transients in 4 neurones from TTX-treated slices at stages P3, P6, and P8, respectively, exhibiting highly synchronous, spontaneous [Ca2+]i transients. B, D and F, 4 neurones from control slices at the same stages show little spontaneous activity.
Figure 5. Development of SSA frequency after TTX removal.
Frequency of synchronous activity (transients with ≥ 50% of imaged cells participating) in TTX-treated and control slices as a function of developmental stage. Data are combined for stages P4–P5 and P9–P11. *Experimental frequency is significantly higher than the control frequency with P < 0.05; **P < 0.01.
Involvement of neurotransmitters in activity
In rat cortex, spontaneous synchronous activity depends on glutamatergic synaptic interactions, with excitatory GABAergic transmission playing only a minor role (Garaschuk et al. 2000). In contrast, similar activity in the developing hippocampus relies on excitatory GABA transmission (Garaschuk et al. 1998). We therefore tested the role of glutamatergic and GABAergic synaptic transmission on activity induced by TTX treatment.
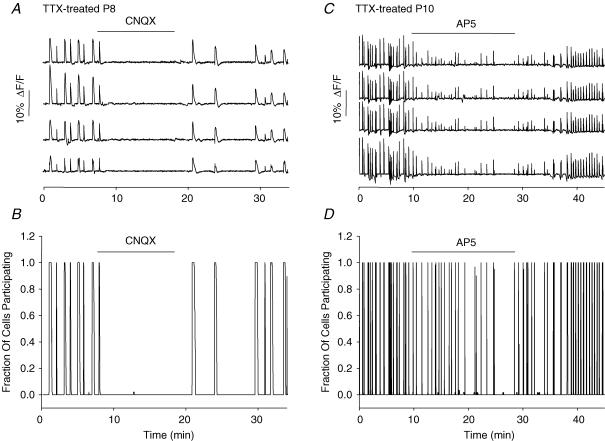
The AMPA/kainate receptor blocker CNQX (25 μm) blocked activity almost completely in all cases (n = 6; frequency reduced to 0.05 ± 0.02 of control; P = 2 × 10⁻⁷) (Figs 6A and B and 8). The NMDA receptor blocker AP5 (25 μm) exerted only a partial and inconsistent block of synchronous activity (frequency reduced to 0.66 ± 0.08 of control; n = 6; P = 0.008) (Figs 6C and D and 8). The synchronicity of activity, however, was not significantly reduced by AP5 (Fig. 6D). Even at a concentration of 125 μm, AP5 did not consistently block activity or reduce synchronicity (data not shown). At all concentrations, AP5 also reduced the amplitude of the [Ca2+]i transients. These results indicate that both AMPA/kainate and NMDA receptors participate in SSA, with the non-NMDA receptors playing the more central role.
Figure 6. Involvement of glutamate receptor activity in SSA generation.
A, spontaneous [Ca2+]i transients in 4 neurones from a P8 TTX-treated slice show a complete block of activity by CNQX (25 μm), an AMPA/kainate receptor antagonist, with recovery upon washout. B, idealized summary record including all 60 neurones from the slice shown in A. C, spontaneous [Ca2+]i transients in 4 neurones of a P10 TTX-treated slice show decreased frequency and amplitude of activity during exposure to AP5 (25 μm), an NMDA receptor antagonist, with recovery upon washout. D, Idealized summary record from the slice shown in C, including all 60 neurones imaged. Concentrations of AP5 up to 125 μm failed to block activity completely.
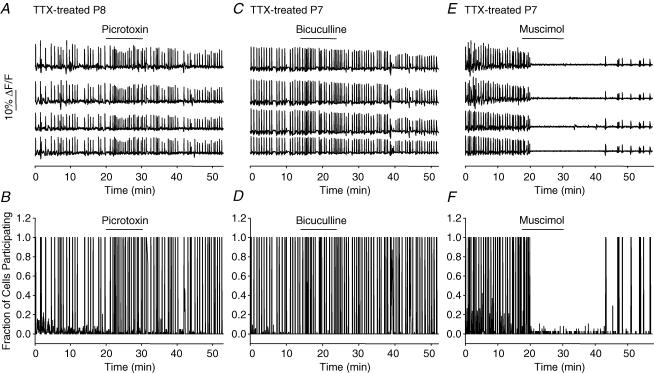
The GABAA receptor blockers picrotoxin (10 μm) and bicuculline (50 μm) had little effect on spontaneous activity, producing an apparent increase in frequency which was not significant for either drug (Figs 7A–D and 8). This implies that GABAA receptor activation is not critical for the generation of this activity, and suggests that it might even be functionally inhibitory to its generation. To test this, we applied the GABAA receptor agonist muscimol (5 μm), which completely blocked activity in each of the five preparations tested (Figs 7E and F and 8). A summary of all drug-induced changes in SSA frequency is shown in Fig. 8.
Figure 7. Involvement of GABA receptor activity in SSA generation.
A and C, spontaneous [Ca2+]i transients in 4 neurones from P8 and P7 TTX-treated slices show little effect of the GABAA antagonists picrotoxin (10 μm) and bicuculline (50 μm). B and D, idealized summary records for the experiments in A and C. 64 cells imaged for B, 58 for D. E, spontaneous [Ca2+]i transients in 4 neurones from a P7 TTX-treated slice show complete block of activity during exposure to muscimol (5 μm), a GABAA agonist, with recovery upon washout. F, idealized summary record of the recording shown in E. 38 cells imaged.
Whole-cell clamp measurements of SSA in individual cortical neurones
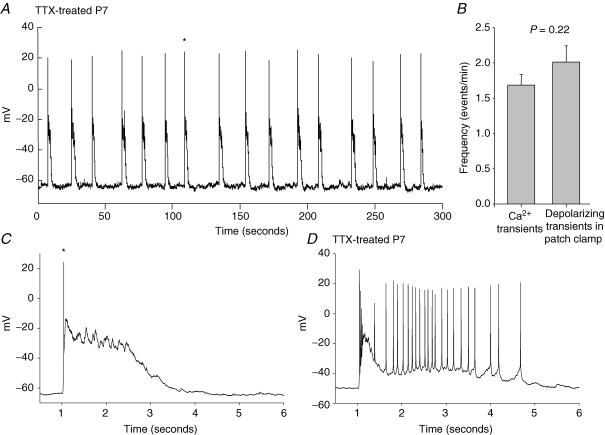
To measure the electrical activity in neurones that underlies the spontaneous [Ca2+]i transients, we made whole-cell current clamp recordings from 21 cells in six TTX-treated slices at P7–P10. The recordings lasted from 2.2 to 15 min (mean: 9.4 ± 0.75 min). Single action potentials were rarely seen in these recordings. The predominant activity in TTX-treated slices was in the form of regularly spaced large depolarizing transients, ranging in duration from 1 to 5 s, with 1–25 action potentials riding on top (Fig. 9A, C and D). The mean frequency of these depolarizing waves was 2.01 ± 0.23 min−1, which was not significantly different from the frequency of spontaneous [Ca2+]i transients recorded from the same stages in TTX-treated slices (1.69 ± 0.15 events min−1; P = 0.22) (Fig. 9B). The initial depolarizing phase of almost all of these transients rose abruptly from a stable baseline resting potential, with one to three excitatory synaptic potentials visible during the rising phase. We saw no evidence of a gradually increasing network excitability manifest as increasing EPSP frequency during the interburst interval (Menendez de la Prida et al. 1998). Although in some cells we saw a very small gradual depolarization between some bursts (Fig. 9A), the resting potential was generally stable within 3–5 mV for the entire interburst interval throughout each recording.
Figure 9. Whole-cell recording of depolarizing transients during SSA.
A, whole-cell recording from a single cell in a P7 TTX-treated cultured slice, revealing long spontaneous depolarizing transients at regular intervals. Each transient in this cell included one single action potential. B, comparison of average SSA frequency in TTX-treated slices (P7–P10) as observed with Ca2+ imaging and whole-cell recording. Values are not significantly different (P = 0.22). C, expanded view of the transient indicated with an asterisk in A. D, expanded view of a single depolarizing transient from a different cell which showed long bursts of action potentials. The full recording from the cell shown in D showed almost the same frequency of transients as for the cell in A.
In acute slices, the onset of SSA prior to P0 correlates with the developmental increase in INa amplitude occurring at that stage, and the termination of SSA after P0 takes place in time with a dramatic reduction in input resistance (Corlew et al. 2004). In addition, block of activity in cultured cortical neurones with TTX results in a homeostatic increase in INa amplitude and excitability (Desai et al. 1999). These data raise the possibility that blocking SSA with TTX results in an increase in INa amplitude or prevents the normal postnatal decrease in input resistance, either of which could explain the persistence of SSA in TTX-treated slices. To test these possibilities, we measured INa and outward K+ current densities (normalized to capacitance), and input resistance in control and TTX-treated cultured slices at P7–P9. As shown in Fig. 10, neither capacitance, INa density, nor IK density differed significantly between control and TTX-treated slices. Although the mean input resistance in TTX-treated slices was slightly greater than that of non-TTX-treated controls of the same developmental stage (TTX-treated: 811 ± 111 MΩ, n = 28; control: 478 ± 82 MΩ, n = 32; P = 0.02), it was much lower than that of P0 acute slices (6000 ± 2633 MΩ; P = 5 × 10⁻⁴versus TTX-treated P7–P10 cultured slices; Corlew et al. 2004) even though activity in later stage TTX-treated slices is more robust and occurs at higher frequency than that of acute P0 slices. Thus, 94% of the postnatal decline in input resistance occurs normally when activity is blocked, and the slightly higher input resistance that results is unlikely to be the sole explanation of the persistence of synchronized activity in TTX-treated slices. These data indicate that homeostatic regulation of at least these four intrinsic parameters does not explain the change in timing of SSA caused by TTX treatment.
Discussion
The electrophysiological properties of many neurones and muscle cells are qualitatively different at early stages of development than they are in the mature state. The nature of these immature properties favours the generation of spontaneous electrical activity that is often highly synchronized across large populations of cells. The neurotransmitter GABA, for example, which is inhibitory in mature neurones, is excitatory in many regions of the mammalian nervous system early in development due to elevated levels of intracellular chloride (Rohrbough & Spitzer, 1996; Owens et al. 1996). GABA excitation is essential in the developing hippocampus for the generation of synchronized giant depolarizing potentials that occur during the first postnatal week (Garaschuk et al. 1998). Slowly activating outward K+ currents are needed for spontaneous activity to occur (or to be effective in admitting enough Ca2+ to carry out its development roles) in developing amphibian neurones (Jones & Ribera, 1994), ascidian muscle (Dallman et al. 2000), and cochlear hair cells (Fuchs & Sokolowski, 1990). The high input resistance that is often found in immature neurones and muscle cells (Moody & Bosma, 2005) appears to play a role in the generation of spontaneous action potentials in ascidian muscle (Dallman et al. 1998) and cortical neurones (Corlew et al. 2004). Other properties found predominantly in immature neurones, such as Ca2+-permeable AMPA receptors (Catsicas et al. 2001), slowly deactivating NMDA receptors (Hestrin, 1992), and voltage-gated channels with more negative activation relationships (Dallman et al. 2000), may play similar roles (Moody & Bosma, 2005).
Several lines of evidence indicate that the critical transition from immature to mature physiological neuronal properties is at least in part regulated by spontaneous activity, thus creating a feedback loop in which immature electrical properties regulate spontaneous activity which, in turn, regulates the maturation of electrical properties. For example, spontaneous activity in cochlear hair cells and ascidian muscle triggers the expression of rapidly activating Ca2+-dependent K+ currents that help terminate activity (Dallman et al. 1998; Brandt et al. 2003). Similarly, in hippocampal neurones activity is necessary for expression of the KCC2 chloride extrusion pump (Ganguly et al. 2001), whose activation converts GABA action from excitatory to inhibitory, thus terminating spontaneous activity (Khazipov et al. 2004).
These results imply that SSA plays a role in many developmental processes, some of which alter cellular properties and lead to SSA termination. Less studied, but equally possible, is the idea that spontaneous activity helps to time its own onset, by reinforcing the initial changes in intrinsic properties and synaptic connectivity that favour it. We have tested the hypothesis that SSA regulates its own timing by blocking activity in slices of developing mouse cortex during its normal period of occurrence from E17 to P3. When activity is blocked by TTX during the five days of its normal occurrence (E17–P3), SSA continues to be generated throughout the period from P3 to P11, much later than normal. Because the properties of SSA in TTX-treated slices are somewhat different from those in acute slices, it is difficult to say whether TTX exposure causes a shift in the timing of SSA to later stages, or simply blocks SSA termination. In acute slices, the synchronicity of SSA increases by 4-fold between E16 and P0, then decreases by 4-fold between P0 and P4 (Corlew et al. 2004). In TTX-treated cultured slices, the synchronicity of SSA is > 90% throughout our measurement period, from P3 to P11. So, judged by the criterion of synchronicity, TTX-treatment prevents the termination of SSA. On the other hand, the frequency of SSA in TTX-treated slices increases gradually from P3 to P7, and then decreases from P7 to P9–P11 (see Fig. 5). This pattern is similar to that seen for normal SSA between E16 and P0 (increase) and P0 and P3 (decrease) (Corlew et al. 2004). So by this criterion, the effect of TTX exposure is more like a shift in SSA timing to later stages. Because the total period of SSA occurrence in TTX-treated slices is longer than that of normal SSA, and because the synchronicity remains very high throughout this period, we favour the hypothesis that the primary effect of TTX treatment is to prevent the mechanisms that normally terminate SSA. Determining whether TTX treatment also affects the onset of SSA will require experiments with briefer exposures to TTX, or recording during acute interruptions of TTX exposure between E17 and P3, to determine to what extent the mechanisms that trigger SSA are present during TTX treatment, but not expressed as SSA because TTX is present.
Transmitter mechanisms of synchronized activity
SSA in TTX-treated slices results from transmitter action similar to that which mediates its normal occurrence at P0 (Garaschuk et al. 2000). It appears to be driven mainly by AMPA receptors, with a smaller participation by NMDA receptors, as judged by its complete block by CNQX and partial block by AP5 (even at high concentrations) (Figs 6 and 8). It is difficult to quantify the participation of NMDA receptors, however, because in the absence of AMPA receptor activation, there is likely to be little depolarizing drive on the neurones, which is necessary to remove the Mg2+ block from the NMDA receptors. It is possible that spontaneous activity could be generated and synchronized solely by NMDA receptor activation if another source of unpatterned depolarization were present when AMPA receptors are blocked. Our results also indicate that GABA action plays a relatively minor role in this activity, as is the case in normal synchronized activity in cortex (Garaschuk et al. 2000). Interestingly, whatever role GABA does play in this activity appears to be inhibitory rather than excitatory. GABA antagonists often increased the frequency of activity, although overall this effect was not statistically significant, and muscimol, a GABA agonist, completely blocked activity (Fig. 7). Activity was also blocked by TTX, ruling out the possibility that a TTX-resistant form of activity appeared during TTX treatment, and subsequently continued to occur after the block was removed.
Possible compensatory mechanisms by which SSA is extended by TTX treatment
Several kinds of homeostatic mechanisms are known to be triggered by manipulations of the intensity of electrical activity in neural networks. Increasing or decreasing activity causes up- and down-regulation of Na+ currents in cortical neurones (Dargent & Couraud, 1990; Desai et al. 1999), and compensatory changes in the balance of excitation and inhibition (see Turrigiano & Nelson, 2004; for review). A combination of effects of activity block on intrinsic and synaptic properties has been shown to cause long-term increases in excitability in hippocampal neurons that can lead to chronic seizure-like activity (Niesen & Ge, 1999). These homeostatic changes in intrinsic and synaptic properties occur in parallel, but occur with distinct timing and partially independent mechanisms (Karmarkar & Buonomano, 2006). Activity-dependent homeostatic changes in synaptic function can operate acutely, at the level of receptor number (Kilman et al. 2002), or over longer time periods at the level of transmitter phenotype (Borodinsky et al. 2004). Compensatory changes in network properties are widespread in developing neurons, and where they have been studied in detail, appear to be geared toward regulating the termination of critical periods of spontaneous activity (see above; Dallman et al. 1998; Ganguly et al. 2001; Brandt et al. 2003).
Our data indicate that such homeostatic mechanisms operate during SSA in developing cortical neurons. Although the changes in the timing of SSA caused by TTX exposure are complex, the fact that we could detect high levels of SSA from P3 to at least P10, that synchronicity remained very high during that entire period, and that only modest changes in frequency of activity occurred during this time suggest that the primary effect of blocking SSA is to prevent its termination. The simplest explanation for this is that some developmental change in intrinsic or synaptic properties that normally terminates activity does not occur when activity is blocked. Because changes in INa and input resistance are correlated with the normal onset and termination of SSA in cortical neurons (Corlew et al. 2004), we compared these properties in TTX-treated and control slices. INa density was not affected by TTX treatment, and the effect on Rin seemed too small to explain the persistence of robust SSA. Capacitance and outward K+ current density were also not affected. Another likely possibility is that blocking activity prevents the switch in GABAA action from excitatory to inhibitory, thus prolonging activity (see Ganguly et al. 2001). This also seems not to be the case, given that GABA participates little in the generation of spontaneous synchronized activity in either normal (Garaschuk et al. 2000) or TTX-treated slices (Fig. 7). Furthermore, activation of GABA receptors in TTX-treated slices blocks activity completely (Fig. 7E and F). There are many other possible intrinsic and synaptic properties that could explain both the normal termination of SSA and the compensatory changes caused by TTX treatment which we have yet to explore, and which could explain both the effects of TTX treatment and the normal cessation of activity.
It is also possible that blocking activity triggers changes unrelated to the normal mechanisms that terminate activity, but that cause a similar form of activity to appear. This would not be surprising, given that spontaneous waves of activity in a single structure can be generated via a variety of mechanisms involving different transmitters and distinct circuitry (Chub & O'Donovan, 1998; Wong et al. 2000).
Whatever the mechanisms are that cause activity to auto-regulate in this way, our experiments do not distinguish whether activity itself, or the synchronized nature of the activity, is necessary to trigger them, since TTX blocks all activity. It would be interesting to desynchronize activity while retaining normal overall amounts of activity in individual neurones. We have not succeeded, however, in desynchronizing SSA in cortical slices with low concentrations of either gap junction blockers, glutamate receptor antagonists, or GABAA receptor agonists.
General implications of the auto-regulatory nature of spontaneous activity
Self-termination may provide an internal monitor that ensures that spontaneous activity continues long enough to carry out its developmental functions. Normal variations in the timing and intensity of activity might result in different durations of time within an overall critical period during which activity must occur in order to trigger activity-dependent developmental programmes. Linking the development of ion channel or receptor properties that serve to terminate activity to that activity itself would ensure that such normal variations in activity would be compensated by changes in the overall duration of activity.
Finally, the ability of SSA to react to a period of block by re-establishing itself at later stages may make it difficult to design experiments to determine the developmental roles of that activity. Many such experiments block activity during the normal period of its occurrence, and then remove the block for an additional period of time before assessing the resulting developmental abnormalities. If, however, the critical period during which activity can carry out its developmental functions extends over more stages than those during which activity normally occurs, later re-establishment of activity after a period of block might allow activity-dependent developmental programs to be triggered after the block is removed. This might cause the range of activity-dependent developmental programs to be underestimated.
Acknowledgments
Supported by NSF grants IOB 0416392 and 0627297 to W.J.M. We thank Rebecca Mease for help with MatLab analysis, and Martha Bosma for reading the manuscript.
References
- Barish ME. Differentiation of voltage-gated potassium current and modulation of excitability in cultured amphibian neurones. J Physiol. 1986;375:229–250. doi: 10.1113/jphysiol.1986.sp016114. [DOI] [PMC free article] [PubMed] [Google Scholar]
- Ben-Ari Y, Cherubini E, Corradetti R, Gaiarsa JL. Giant synaptic potentials in immature rat CA3 hippocampal neurones. J Physiol. 1989;416:303–325. doi: 10.1113/jphysiol.1989.sp017762. [DOI] [PMC free article] [PubMed] [Google Scholar]
- Borodinsky LN, Root EM, Cronin JA, Sann SB, Gu X, Spitzer NC. Activity-dependent homeostatic specification of transmitter expression in embryonic neurons. Nature. 2004;429:515–517. doi: 10.1038/nature02518. [DOI] [PubMed] [Google Scholar]
- Brandt A, Striessnig J, Moser T. Cav1.3 channels are essential for development and presynaptic activity of cochlear inner hair cells. J Neurosci. 2003;23:10832–10840. doi: 10.1523/JNEUROSCI.23-34-10832.2003. [DOI] [PMC free article] [PubMed] [Google Scholar]
- Butts DA, Feller MB, Shatz CJ, Rokhsar DS. Retinal waves are governed by collective network properties. J Neurosci. 1999;19:3580–3593. doi: 10.1523/JNEUROSCI.19-09-03580.1999. [DOI] [PMC free article] [PubMed] [Google Scholar]
- Catsicas M, Allcorn S, Mobbs P. Early activation of Ca2+-permeable AMPA receptors reduces neurite outgrowth in embryonic chick retinal neurons. J Neurobiol. 2001;49:200–211. doi: 10.1002/neu.1075. [DOI] [PubMed] [Google Scholar]
- Chub N, O'Donovan MJ. Blockade and recovery of spontaneous rhythmic activity after application of neurotransmitter antagonists to spinal networks of the chick embryo. J Neurosci. 1998;18:294–306. doi: 10.1523/JNEUROSCI.18-01-00294.1998. [DOI] [PMC free article] [PubMed] [Google Scholar]
- Corlew R, Bosma MM, Moody WJ. Spontaneous, synchronous electrical activity in neonatal mouse cortical neurones. J Physiol. 2004;560:377–390. doi: 10.1113/jphysiol.2004.071621. [DOI] [PMC free article] [PubMed] [Google Scholar]
- Dallman JE, Davis AK, Moody WJ. Spontaneous activity regulates calcium-dependent K+ current expression in developing ascidian muscle. J Physiol. 1998;511:683–693. doi: 10.1111/j.1469-7793.1998.683bg.x. [DOI] [PMC free article] [PubMed] [Google Scholar]
- Dallman JE, Dorman J, Moody WJ. Action potential waveform voltage clamp reveals the significance of the patterns of ion channel development in ascidian muscle. J Physiol. 2000;524:375–386. doi: 10.1111/j.1469-7793.2000.t01-1-00375.x. [DOI] [PMC free article] [PubMed] [Google Scholar]
- Dargent B, Couraud F. Down-regulation of voltage-dependent sodium channels initiated by sodium influx in developing neurons. Proc Natl Acad Sci U S A. 1990;87:5907–5911. doi: 10.1073/pnas.87.15.5907. [DOI] [PMC free article] [PubMed] [Google Scholar]
- Desai NS, Rutherford LC, Turrigiano GG. Plasticity in the intrinsic excitability of cortical pyramidal neurons. Nat Neurosci. 1999;2:515–520. doi: 10.1038/9165. [DOI] [PubMed] [Google Scholar]
- Fuchs P, Sokolowski BH. The acquisition during development of Ca-activated potassium currents by cochlear hair cells of the chick. Proc Biol Sci. 1990;241:122–126. doi: 10.1098/rspb.1990.0075. [DOI] [PubMed] [Google Scholar]
- Ganguly K, Schinder AF, Wong ST, Poo M-M. GABA itself promotes the developmental switch of neuronal GABAergic responses from excitation to inhibition. Cell. 2001;105:521–532. doi: 10.1016/s0092-8674(01)00341-5. [DOI] [PubMed] [Google Scholar]
- Garaschuk O, Hanse E, Konnerth A. Developmental profile and synaptic origin of early network oscillations in the CA1 region of rat neonatal hippocampus. J Physiol. 1998;507:219–236. doi: 10.1111/j.1469-7793.1998.219bu.x. [DOI] [PMC free article] [PubMed] [Google Scholar]
- Garaschuk O, Linn J, Eilers J, Konnerth A. Large-scale oscillatory calcium waves in the immature cortex. Nat Neurosci. 2000;3:452–459. doi: 10.1038/74823. [DOI] [PubMed] [Google Scholar]
- Greaves AA, Davis AK, Dallman JE, Moody WJ. Development of ionic currents in the muscle lineage of the ascidian Boltenia villosa. J Physiol. 1996;497:39–52. doi: 10.1113/jphysiol.1996.sp021748. [DOI] [PMC free article] [PubMed] [Google Scholar]
- Gust J, Wright JJ, Pratt EB, Bosma MM. Development of synchronized activity of cranial motor neurons in the segmented embryonic mouse hindbrain. J Physiol. 2003;550:123–133. doi: 10.1113/jphysiol.2002.038737. [DOI] [PMC free article] [PubMed] [Google Scholar]
- Hestrin S. Developmental regulation of NMDA receptor-mediated synaptic currents at a central synapse. Nature. 1992;357:686–689. doi: 10.1038/357686a0. [DOI] [PubMed] [Google Scholar]
- Hunt PN, McCabe AK, Bosma MM. Midline serotonergic neurones contribute to widespread synchronous activity in embryonic mouse hindbrain. J Physiol. 2005;566:807–819. doi: 10.1113/jphysiol.2005.089581. [DOI] [PMC free article] [PubMed] [Google Scholar]
- Jones SM, Ribera AB. Overexpression of a potassium channel gene perturbs neural differentiation. J Neurosci. 1994;14:2789–2799. doi: 10.1523/JNEUROSCI.14-05-02789.1994. [DOI] [PMC free article] [PubMed] [Google Scholar]
- Karmarkar UR, Buonomano DV. Different forms of homeostatic plasticity are engaged with distinct temporal profiles. Eur J Neurosci. 2006;23:1575–1584. doi: 10.1111/j.1460-9568.2006.04692.x. [DOI] [PubMed] [Google Scholar]
- Khazipov R, Khalilov I, Tyzio R, Morozova E, Ben-Ari Y, Holmes GL. Developmental changes in GABAergic actions and seizure susceptibility in the rat hippocampus. Eur J Neurosci. 2004;19:590–600. doi: 10.1111/j.0953-816x.2003.03152.x. [DOI] [PubMed] [Google Scholar]
- Kilman V, van Rossum MC, Turrigiano GG. Activity deprivation reduces miniature IPSC amplitude by decreasing the number of postsynaptic GABAA receptors clustered at neocortical synapses. J Neurosci. 2002;15:1328–1337. doi: 10.1523/JNEUROSCI.22-04-01328.2002. [DOI] [PMC free article] [PubMed] [Google Scholar]
- Leinekugel X, Khalilov I, Ben-Ari Y, Khazipov R. Giant depolarizing potentials: the septal pole of the hippocampus paces the activity of the developing intact septohippocampal complex in vitro. J Neurosci. 1998;18:6349–6357. doi: 10.1523/JNEUROSCI.18-16-06349.1998. [DOI] [PMC free article] [PubMed] [Google Scholar]
- Meister M, Wong ROL, Baylor DA, Shatz CJ. Synchronous bursts of action potentials in ganglion cells of the developing mammalian retina. Science. 1991;252:939–943. doi: 10.1126/science.2035024. [DOI] [PubMed] [Google Scholar]
- Menendez de la Prida L, Bolea S, Sanchez-Andres JV. Origin of the synchronized network activity in the rabbit developing hippocampus. Eur J Neurosci. 1998;10:899–906. doi: 10.1046/j.1460-9568.1998.00097.x. [DOI] [PubMed] [Google Scholar]
- Moody WJ, Bosma MM. Hormone-induced loss of surface membrane during maturation of starfish oocytes: differential effects on potassium and calcium channels. Dev Biol. 1985;112:396–404. doi: 10.1016/0012-1606(85)90412-9. [DOI] [PubMed] [Google Scholar]
- Moody WJ, Bosma MM. Ion channel development, spontaneous activity, and activity-dependent development in nerve and muscle cells. Physiol Rev. 2005;85:883–941. doi: 10.1152/physrev.00017.2004. [DOI] [PubMed] [Google Scholar]
- Niesen CE, Ge S. Chronic epilepsy in developing hippocampal neurons: electrophysiologic and morphologic features. Dev Neurosci. 1999;21:328–338. doi: 10.1159/000017382. [DOI] [PubMed] [Google Scholar]
- O'Donovan MJ, Chub N, Wenner P. Mechanisms of spontaneous activity in developing spinal networks. J Neurobiol. 1998;37:131–145. doi: 10.1002/(sici)1097-4695(199810)37:1<131::aid-neu10>3.0.co;2-h. [DOI] [PubMed] [Google Scholar]
- Owens DF, Boyce LH, Davis MBE, Kriegstein AR. Excitatory GABA responses in embryonic and neonatal cortical slices demonstrated by gramicidin perforated-patch recordings and calcium imaging. J Neurosci. 1996;16:6414–6423. doi: 10.1523/JNEUROSCI.16-20-06414.1996. [DOI] [PMC free article] [PubMed] [Google Scholar]
- Picken-Bahrey HL, Moody WJ. Voltage-gated currents, dye and electrical coupling in the embryonic mouse neocortex. Cerebral Cortex. 2003a;13:239–251. doi: 10.1093/cercor/13.3.239. [DOI] [PubMed] [Google Scholar]
- Picken-Bahrey HL, Moody WJ. Early development of voltage-gated ion currents and firing properties in neurons of the mouse cerebral cortex. J Neurophysiol. 2003b;89:1761–1773. doi: 10.1152/jn.00972.2002. [DOI] [PubMed] [Google Scholar]
- Rohrbough J, Spitzer NC. Regulation of intracellular Cl− levels by Na+-dependent Cl− cotransport distinguishes depolarizing from hyperpolarizing GABAA receptor-mediated responses in spinal neurons. J Neurosci. 1996;16:82–91. doi: 10.1523/JNEUROSCI.16-01-00082.1996. [DOI] [PMC free article] [PubMed] [Google Scholar]
- Strata F, Atzori M, Molnar M, Ugolini G, Tempia F, Cherubini E. A pacemaker current in dye-coupled hilar interneurons contributes to the generation of giant GABAergic potentials in developing hippocampus. J Neurosci. 1997;17:1435–1446. doi: 10.1523/JNEUROSCI.17-04-01435.1997. [DOI] [PMC free article] [PubMed] [Google Scholar]
- Tabak J, Rinzel J, O'Donovan MJ. The role of activity-dependent network depression in the expression and self-regulation of spontaneous activity in the developing spinal cord. J Neurosci. 2001;21:8966–8978. doi: 10.1523/JNEUROSCI.21-22-08966.2001. [DOI] [PMC free article] [PubMed] [Google Scholar]
- Turrigiano GG, Nelson SB. Homeostatic plasticity in the developing nervous system. Nat Rev Neurosci. 2004;5:97–107. doi: 10.1038/nrn1327. [DOI] [PubMed] [Google Scholar]
- Wong WT, Myhr KL, Miller ED, Wong ROL. Developmental changes in the neurotransmitter regulation of correlated spontaneous retinal activity. J Neurosci. 2000;20:351–360. doi: 10.1523/JNEUROSCI.20-01-00351.2000. [DOI] [PMC free article] [PubMed] [Google Scholar]


