

Abstract
Aim
Omalizumab, a humanized IgG monoclonal antibody that binds to human immunoglobulin E (IgE), interrupts the allergic cascade in asthmatic patients. The aim was to compare simultaneously drug exposure and IgE biomarker responses in Japanese and White patient populations.
Methods
An instantaneous equilibrium drug–ligand binding and turnover population model was built from 202 Japanese patients. A posterior predictive evaluation for the steady-state distributions of omalizumab and IgE was then carried out against 531 White patients.
Results
The mean parameters estimated from the Japanese patients were as follows: omalizumab clearance 7.32 ± 0.153 ml h−1, IgE clearance 71.0 ± 4.68 ml h−1 and the difference between that for omalizumab and the complex 5.86 ± 0.920 ml h−1, the volume of distribution for omalizumab and IgE 5900 ± 107 ml, and that for the complex 3630 ± 223 ml, the rate of IgE production 30.3 ± 2.04 µg h−1. Half-lives of IgG (23 days) and IgE (2.4 days) were close to previous reports. The dissociation constant for binding, 1.07 nM, was similar to in vitro values. Clearance and volume of distribution for omalizumab varied with bodyweight, whereas the clearance and rate of production of IgE were predicted accurately by baseline IgE. Overall, these covariates explained much of the interindividual variability.
Conclusions
The predictiveness of the Japanese model was confirmed by Monte-Carlo simulations for a White population, also providing evidence that the pharmacokinetics of omalizumab and IgE were similar in these two populations. Furthermore, the model enabled the estimation of not only omalizumab disposition parameters, but also the binding with and the rate of production, distribution and elimination of its target, IgE.
Keywords: atopic asthma, binding model monoclonal antibody, IgE, NONMEM
Introduction
Omalizumab is a recombinant DNA-derived humanized monoclonal antibody that selectively binds human immunoglobulin E (IgE). The antibody is an immunoglobulin (Ig) G1 κ with a human framework and complementarity determining regions (CDRs) from a humanized anti-IgE murine antibody [1]. The causal role of IgE in allergic disease is well established [1–3]. Theallergic cascade is initiated when IgE bound to high-affinity FcεRI receptors on the surface of basophils and mast cells is cross-linked by allergen, resulting in the degranulation of these effector cells and the release of inflammatory mediators such as histamine and leukotrienes. Omalizumab interrupts the allergic cascade by (i) forming complexes with IgE and preventing the arming of effector cells, (ii) aiding off-loading of mast cells and basophils by trapping IgE as it dissociates from the receptor, and (iii) downmodulating FcεRI as a direct consequence of the reduction in free IgE concentrations [4–12].
Administration of omalizumab significantly decreases serum free IgE concentrations, resulting in improved control of atopic asthma and, most probably, other atopic conditions. As a result of omalizumab binding to IgE, lowering its free concentration, total serum IgE concentrations rise. Such an increase could occur by two mechanisms: (i) omalizumab–IgE complexes could be eliminated more slowly than free IgE due to the ability of the IgG portion of complexes to access the Brambell receptor, sparing them from lysosomal degradation [13], and (ii) the complexes, being of higher molecular mass (at least 340 kDa for the dimer but up to 1000 kDa for the hexamer [14]), filter less effectively through the vascular endothelium and are therefore retained within the smaller plasma volume of distribution [15–18].
However, these mechanisms have yet to be confirmed, although a mechanism-based PK/PD model of the pharmacokinetics of omalizumab and its binding to IgE has been published for a limited number of subjects [19]. The concentration–time profiles of omalizumab, free and total IgE exhibited many of the same properties as other therapeutic antibodies. In addition, the model allowed the estimation of both drug-specific kinetic parameters and those that are related to endogenous IgE production and elimination.
We now present an alternative model, based on the concentration–time profiles of omalizumab, free and total IgE in Japanese subjects. As in the previous model, it incorporates three entities, namely free omalizumab, free IgE and the omalizumab–IgE complex, but each with their own clearance and volume of distribution. The relationship between these entities is defined by the law of mass reaction, assuming, unlike in previous work [19], that they are always at equilibrium. This simplification enabled the successful analysis of large quantities of sparse data using NONMEM with a binding model, which was impossible with the previous model. Given the timescale (weeks) of clinical studies with monoclonal antibodies, and the short equilibration time (hours) for the antibody–IgE complexation reaction, such an assumption is considered valid. The concentration–time profiles of the three compounds can then be explored simultaneously by a population model, which enables the prediction of statistical distributions of individual profiles using covariate values (body weight and baseline IgE) to decrease unexplained interindividual variability.
Therapeutically, a table based on the pretreatment IgE concentration and body weight has been constructed to estimate the omalizumab dose required to decrease trough free IgE concentrations (based on samples drawn immediately prior to drug treatment in a multiple dose regimen) to between 12 and 21 ng ml−1, the range associated with clinical efficacy [20]. The frequency distribution of the IgE response is such that >90% of patients achieve suppression at concentrations <50 ng ml−1. The present model mimics this frequency distribution of free IgE. Furthermore, although the model parameters were estimated using data from Japanese patients only, simulated distributions of free IgE overlay well the steady-state data from independent studies in White patients treated according to the dosing table. This finding indicates that the model is predictive and that there are effectively no differences in the pharmacokinetics of omalizumab between Japanese and Whites.
Methods
Analysis of omalizumab and total and free IgE
An enzyme-linked immunosorbent assay (ELISA) was used for the analysis of total omalizumab using human myeloma-derived IgE from the U266B1 cell line, ATCC number TIB-196266 (American Type Culture Collection, Manassas, VA, USA) as the capture antibody. A monoclonal antibody was developed against the CDR of omalizumab, conjugated with horseradish peroxidase, and used to detect plate-bound drug. Colourimetric detection used the o-phenylenediamine reaction with hydrogen peroxide. The assay range was 0.16–10 ng ml−1, but samples were normally diluted, so that the lower limits of quantification (LLOQ) were 160 ng ml−1 in studies 1101 and 1305, 1600 ng ml−1 in studies 007, 008 and 009. The coefficient of variation was 4.0% at 0.90 ng ml−1.
Free IgE in serum was determined using a previously reported ELISA [14]. The assay had an upper limit of quantification of 150 ng ml−1, a LLOQ of 0.78 ng ml−1 and coefficients of variation of 10.1% at 1.51 ng ml−1 and 5.4% at 21.8 ng ml−1.
Pretreatment total IgE concentrations in serum were determined by a microparticle enzyme immunoassay test kit commercially available from Abbott Inc. (Abbott Park, IL, USA). The LLOQ of total IgE was 2.4 ng ml−1, with a coefficient of variation of 13.6% at 3.6 ng ml−1. Measurements for total IgE in IU ml−1 were converted to ng ml−1; 1 IU ml−1 total IgE = 2.42 ng ml−1 total IgE.
Study design
For the population PK/PD analysis, the data from five studies shown in Table 1 were integrated. Study 1101 used a single dose (75–375 mg) and the remaining studies involved multiple dosing with treatment periods of 8–52 weeks. The sampling times were 0, 0.5, 1, 2, 4, 7, 10, 14, 28, 42, 56, 70 and 84 days after administration in the single-dose study. In the multiple-dose studies, samples were drawn immediately prior to dosing (trough) and during the post-treatment period.
Table 1.
Study designs and blood sampling times for studies contributing to the population pharmacokinetic analysis
| Subject no. | Background data (subjects used for analysis, mean ± SD and range) | |||||||
|---|---|---|---|---|---|---|---|---|
| Study | Purpose | Patient indication | Treated | Used in the analysis* | Study design | Treatment period (weeks) | Body weight (kg) | Baseline IgE (ng ml−1) |
| 1101 | Model building and internal validation using all samples | Healthy volunteer but atopic with high baseline IgE | 48 (Japanese: 48) | 48 | Single dose | – | 62.5 ± 6.4 (51–79) | 811 ± 473 (204–2143) |
| 1305 | “ | Seasonal allergic rhinitis | 154 (Japanese: 154) | 154 | Multiple dose with dosing table | 12 | 60.5 ± 10.2 (42–101) | 373 ± 317 (53–1316) |
| 007 | External validation using all samples | “ | 165 (White: 164) | 155 | “† | 8 | 73.7 ± 13.6 (48–110) | 356 ± 305 (72.6–1728) |
| 008 | External validation using steady-state trough samples | Allergic asthma | 268 (White: 238) | 206 | “ | 52 | 79.6 ± 18.6 (39–150) | 424 ± 361 (48.4–2081) |
| 009 | “ | “ | 274 (White: 256) | 170 | “ | 52 | 78.2 ± 16.9 (40.0–148) | 523 ± 387 (51–1970) |
Studies 1101 and 1305 had short treatment periods and used all the samples from the patients to build the model. Thus, nearly all the patients treated with omalizumab were available to contribute samples. Studies 008 and 009 had relatively long treatment periods. In these studies patients were more likely not to be available to contribute the needed steady-state trough sample (at least 240 days after first dose and postdose within 2 days of the planned dose interval) for inclusion into the analysis.
In study 007, 300 mg was administered every 3 weeks (IgE >363 ng ml−1) or 4 weeks (IgE ≤363 ng ml−1).
Study 1101 was carried out at the Sekino Clinical Pharmacology Clinic, 28-3, Ikebukuro 3 Chome, Toshima-ku, Tokyo. Study 1305 was carried out in two centres, in Tokyo and in Osaka, both organized by the Osaka Clinical Research Organization for Medicine Clinic, 4-12-11 Kasuga, Suita-Shi, Osaka. Both studies were approved by the Institutional Review Boards of the aforementioned organizations and all patients gave informed written consent. The studies were conducted in accordance with the Declaration of Helsinki and Guidelines for Good Clinical Practice. The data from studies 007, 008 and 009 have been published [13, 14, 21].
For model building, Japanese studies 1101 and 1305 were combined. Despite study 1101 not representing a therapeutic treatment period, its incorporation in the modelling permitted a better evaluation of the influence of baseline IgE on the pharmacokinetics and pharmacodynamics of omalizumab because the range of baseline IgE concentrations included was broader than in the other studies.
Only subjects treated with omalizumab were used in the modelling and validation. Values of free IgE concentration above the upper limit of quantification were excluded. All data from all subjects treated with omalizumab in studies 1101 and 1305 were used in the model building.
In order to confirm model predictions, external validation was conducted using data from clinical studies 007, 008 and 009. Study 007 involved an 8-week treatment of patients with seasonal allergic rhinitis. In this study, subjects with baseline IgE ≤363 ng ml−1 received 300 mg of omalizumab every 4 weeks, and the other subjects received the same dose every 3 weeks. The median concentration–time profiles for total omalizumab, free and total IgE were predicted by simulation and compared with observed median data.
Studies 008 and 009 involved 52-week treatments of patients with allergic asthma. In these studies a dosing table was used based on body weight and pretreatment IgE concentration (Table 2). Predose omalizumab, total and free IgE concentrations at steady state, at least 240 days after the first dose, were predicted by simulation and compared with observed values.
Table 2.
Dosing table used in studies 1305, 008 and 009. Doses specified are in mg
| Baseline IgE | Body weight (kg) | |||||
|---|---|---|---|---|---|---|
| IU ml−1 | ng ml−1 | 30–60 | >60–70 | >70–80 | >80–90 | >90–150 |
| ≥30–100 | ≥72.6–242 | 150 | 150 | 150 | 150 | 300 |
| >100–200 | >242–484 | 300 | 300 | 300 | 300 | 225 |
| >200–300 | >484–726 | 300 | 225 | 225 | 225 | 300 |
| >300–400 | >726–968 | 225 | 225 | 300 | 300 | – |
| >400–500 | >968–1210 | 300 | 300 | 375 | 375 | – |
| >500–600 | >1210–1452 | 300 | 375 | – | – | – |
| >600–700 | >1452–1694 | 375 | – | – | – | – |
*Omalizumab dose administered by subcutaneous injection every 2 weeks (in bold) or 4 weeks (not bold).
The PK/PD structural model
The concept of the PK/PD model is shown in Figure 1. The model incorporates free omalizumab, free IgE and the immune complex of omalizumab and IgE. The disposition for each component was assumed to be described by a one-compartment first-order elimination model.
Figure 1.

The PK/PD model structure
The amount of omalizumab in subcutaneous tissue (XSC), the sum of the amounts of free omalizumab and complex in serum (total omalizumab, XTX) and the amount of total IgE in serum (XTE) are represented in units of nmol and described by the following differential equations:
where the parameters are: ka, absorption rate constant (l h−1); f, absolute bioavailability; D, dose (nmol); PE, endogenous production rate of IgE (nmol h−1); CLX, clearance of free omalizumab (ml h−1); CLE, clearance of free IgE (ml h−1); CLC, clearance of complex (ml h−1); tD, dosing time (h).
Concentrations [nmol l−1 (nM)] are derived from the above amounts and distribution volumes [VX, distribution volume of free omalizumab (ml); VE, distribution volume of free IgE (ml); VC, distribution volume of complex (ml); XC, the amount of the complex in serum (nmol)] as follows:
Here, CC, CTX, CTE, CfX and CfE are, respectively, the nanomolar concentrations of complex, total omalizumab, total IgE, free omalizumab and free IgE. In the clinical studies CTX, CTE and CfE were expressed in units of ng ml−1. In the NONMEM code they were converted to molar units using the molecular weights of omalizumab (150 kDa) and IgE (190 kDa).
Based on preliminary model building with the condition that VX ≠ VE, NONMEM optimization was not successful. Consequently, VE was assumed to equal VX. Because IgE and IgG have similar molecular weights and physical structures, their transfer between blood and tissue should be similar.
The amount of complex is determined by the law of mass action and can be described by the following equation:
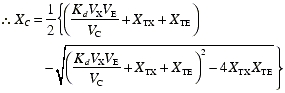 |
where Kd is the dissociation constant expressed in molar units (nM). The formation of complex is far more rapid than changes in omalizumab concentrations. Therefore, relative to the timescales of the clinical studies and their sampling, the concentration of complex can be assumed to be always at equilibrium.
The dissociation constant
For chemical equilibria between two species forming a complex, the dissociation constant, Kd is assumed to be constant in the absence of any competing agent. However, the reaction between omalizumab and IgE has been shown to form two trimers (X2E and E2X) and a hexamer with a 1:1 stoichiometry (X3E3), depending upon whether omalizumab or IgE is in excess. Therefore, Kd varies depending upon the relative concentrations of omalizumab and IgE [22]. In the PK/PD model, the change in Kd was assumed to obey the following empirical model:
where α ≥ 0. The value of Kd at XTX = XTE is Kd0. When there is an excess of omalizumab, XTX >> XTE, the value of Kd increases, indicating a decrease in apparent affinity. Over the range of omalizumab and IgE concentrations observed in the clinical studies, the apparent Kd shifts by a factor of about 2.
The stochastic model
The observational equation for each of the three measured compounds was represented similarly as
where Y is the observed value in a particular individual for a given compound at a particular timepoint, F is the corresponding fitted value from the PK/PD model, and ε is the corresponding error normally distributed with mean 0. All errors were assumed to be unrelated, with the error from each compound being allocated a separate parameter (σ12, σ22 or σ32) to describe its associated intra-individual variability.
The PK/PD parameters Kd0 and α were assumed to be constant with no interindividual variability. The population model added random effects for the remaining PK/PD parameters in order to recognize differences between individuals, and similarities across observations corresponding to the same individual. The PK/PD parameters were allowed to depend on multiplicative effects of covariates and random error. The error component for each parameter represents the unexplained intersubject variability for the corresponding parameter. Thus, if TVPARM is the ‘typical value’, or population median value for a parameter PARM, and if η1 is a random variable, with mean 0 and variance ω12, representing the deviation of the PARM of an individual patient from the typical value (TVPARM) on the natural logarithm scale, then the PARM of that patient is
In the same way, the random effect η1 represents the natural logarithm of the ratio of the PARM of an individual patient to the typical value (TVPARM). Other parameters were treated similarly with a corresponding random effect ηj. The joint distribution of the ηj's was assumed to be normal with a mean of 0 and with block diagonal variance–covariance matrix Ω. The ηj's for PE and CLE were assumed to be correlated and the remaining ηj's assumed to be unrelated to each other and with ηj's for PE and CLE. A continuous covariate xi (body weight or baseline IgE) was modelled as affecting the jth PK/PD parameter, say TVPARM, as follows:
where
and xi0 is the reference of the covariate or standard value.
The clearance of the omalizumab–IgE complex, CLC, was reparameterized to be additive upon the clearance of free omalizumab: CLC = CLX + ΔCLC. The clearance of the complex is greater than that of free omalizumab [19], for which there are two hypotheses. Endogenous IgG is known to be protected from catabolism by the neonatal Fc or Brambell receptor (FcRn) [23], which redirects IgG back to the systemic compartment, thereby giving rise to a longer half-life compared with other classes of immunoglobulin. However, in binding a ligand, in this case IgE, steric hinderance may decrease the affinity to FcRn, leading to greater catabolism and clearance of the complex. In this regard, every antibody drug approved by the Food and Drug Administration has a shorter half-life [18] than that reported for endogenous IgG [24, 25]. The second hypothesis is that, since the complex contains IgE, it could be subject to the same elimination mechanism as this protein. Therefore, the clearance of the complex could be equal to that of native IgG plus a proportion of the clearance of IgE. This fraction is unlikely to be equal to one, due to the steric hinderance involved in the binding of omalizumab to at least one side of the Fc portion of IgE. In either case, the ΔCLC term represents the extra clearance of the complex over and above that of native IgG (free omalizumab).
Body weight, baseline IgE, age and sex were individually plotted against the PK/PD parameters, and meaningful covariate–parameter relationships nominated. Significance was tested by backward elimination using a significance level of P < 0.01, corresponding to a change of at least 6.63 in the NONMEM objective function. Separate parameters for modelling the predictive effects of baseline IgE on PE and CLE were present in the basic model. The range of baseline IgE values was broad and optimization by NONMEM did not converge without the inclusion of these covariates.
Model validation
Both internal validation and external validation were performed. Dermographic data for virtual subjects was generated by randomly sampling from the actual datasets. These virtual subjects were then given the appropriate dose and regimen as specified for each study. Using these data, the PK/PD parameters were simulated for each subject using the final population PK/PD model parameters. For each dose and regimen combination, 1000 virtual subjects were generated. The simulation reflected interindividual variability by setting the interindividual parameter distributions to those estimated from the model. In addition, the simulation assumed perfect compliance with the dosing table and zero values for all intra-individual variability from the observation equations.
For study 1101, in order to validate the model internally, the simulation results and the observed data were compared at each dose. As a guide, 80% prediction intervals and the median of the simulated values were superimposed on the scatter plots of the observed values for total omalizumab, free IgE and total IgE.
For study 1305, in order to internally validate the model, the observed median was compared with the 95% prediction intervals for the median, which were calculated as follows:
One thousand replications were generated including the same number of subjects as the observed number in each combination of dose and regimen. Each replication was made by resampling from the previously simulated dataset.
The median for each replication was calculated.
The 2.5th and 97.5th percentiles of the 1000 medians, as the end-points of the 95% prediction interval for the median, were calculated.
For external validation, the observed serum concentrations of omalizumab, free IgE and total IgE from studies 007, 008 and 009 that were not used in the model building were compared with model predictions. For studies 008 and 009, to ensure steady state, trough samples had to be collected at least 240 days after the first dose, with a period after the last dose prior to the trough sample within 2 days of the planned dose interval (14 or 28 days). The simulation was carried out using regular dosing with the planned dose and dosing interval, and with the trough sample drawn one dosing interval after the dose administered 224 days after the first dose.
Parameter uncertainty was not considered in the simulations. Values were calculated based on the NONMEM estimates for θ, ω and ε. However, when making a posterior predictive assessment, as opposed to a predictive evaluation of the data used to generate the model, parameters uncertainty should not be ignored. The standard error (SE) of each parameter, obtained by the NONMEM $COVARIANCE procedure, was used as an estimate of uncertainty. An additional simulation using the SE of the θ estimates was performed for the validation of studies 008 and 009 according to the following equation:
where Zij = (xi/xi0)(θij+δij) and δij ∼ N(0,SE2 for θij).
Software used for modelling and simulation
For the model building and determination of individual PK/PD parameters, NONMEM (Version V Level 1.1) was used with the first-order conditional estimation method (METHOD = FOCE). S-Plus (version 6.1) was used for the simulation, statistical computation and graphics. For external validation, the simulation data set of trough concentration was generated by NONMEM. Noncompartmental analysis to compute terminal half-lives was carried out using WinNonlin (version 4.0.1).
Results
In the studies used in the model building (1101 and 1305), 202 healthy subjects and patients were administered omalizumab. A total of 3192 samples (1037 omalizumab, 1191 total IgE and 964 free IgE) were used for model building. Two hundred and seventy-five free IgE concentrations that were above the upper limit of quantification (150 ng ml−1) were excluded. Seven hundred and seven patients were administered omalizumab in studies 007, 008 and 009; 531 patients who had evaluable trough concentrations in these studies were used for the external validation of the model. Demographic data are summarized in Table 1.
The estimated PK/PD parameter values are shown in Table 3. The covariate–parameter effects (body weight for omalizumab clearance and distribution volume and baseline IgE for free IgE clearance and rate of IgE production) were included and confirmed as statistically significant (P < 0.01). Interindividual variability for the random effects associated with the PK/PD parameters ranged from 13% (VX) to 40% (ka). Intra-individual variability from the observation equations ranged from 17% to 22%. The standard error (SE) for the estimated fixed-effects parameters (θ) ranged from 2% to 20% of θ. With the exception of free IgE, the individual weighted residuals, IWRES, showed a symmetric distribution around zero through the whole range of predicted values (Figure 2). Free IgE showed asymmetry for higher predicted values, as samples containing concentrations >150 ng ml−1 were not quantifiable.
Table 3.
Population estimated model parameters and related information
| PK/PD parameter | Population mean [θ (SE for θ)] | Interindividual variance (ω,% CV) |
|---|---|---|
| CLx/f (ml h−1)* | 7.32 (0.153) | 20.3 |
| CLX/f exponent for body weight | 0.911 (0.135) | |
| ΔCLC/f (ml h−1) | 5.86 (0.920) | 34.9 |
| CLE/f (ml h−1)† | 71.0 (4.68) | 25.3 |
| CLE/f exponent for baseline IgE | −0.281 (0.0312) | |
| PE/f (µg h−1)† | 30.3 (2.04) | 23.1 |
| PE/f exponent for baseline IgE | 0.657 (0.0301) | |
| Correlation between η(CLE/f) and η(PE/f) | 0.968 | |
| VX/f (ml)*‡ | 5900 (107) | 13.0 |
| VX/f exponent for body weight | 0.658 (0.100) | |
| VC/f (ml) | 3630 (223) | 25.0 |
| ka (h−1) | 0.0200 (0.00114) | 39.9 |
| Kd0 (nm) | 1.07 (0.118) | |
| α | 0.157 (0.0306) | |
| Intra-individual variance (σ,% CV) | ||
| Omalizumab | 16.7 | |
| Total IgE | 21.1 | |
| Free IgE | 21.8 |
NONMEM objective function value: 37375.330. Total no. of observation records: 3192. Total no. of individuals: 202.
The value at 61.1 kg of body weight.
The value at 482.4 ng ml−1 of baseline IgE (30.3 µg h−1 = 0.159 nmol h−1).
VE/f was assumed to be the same as VX/f.
Figure 2.

Diagnostic plots for the model. The upper panels show the goodness-of-fit through the relationship between the estimated values (IPRED) and the corresponding observed values with respect to the line of identity. The lower panels show the distributions of individual weight residuals (IWRES) for free and total IgE and omalizumab. The broken lines indicate the S-Plus LOESS local regression lines. The upper limit of quantification for free IgE was 150 ng ml−1. Observations above this value were not quantifiable and could not be plotted
To confirm the necessity for the expression allowing affinity to vary with the ratio of omalizumab to IgE, the log-likelihood NONMEM objective functions were compared for models with and without variation in Kd. With concentration dependence allowed (α ≠ 0), the NONMEM objective function decreased significantly by 107.
In building the basic model, the influence of the broad range of baseline IgE (IgE0) was not negligible and the optimization process did not converge without the inclusion of covariates. Therefore, the basic model included the covariate of IgE0 on PE/f.
In the preliminary analysis, the influences of body weight, baseline IgE, age and sex on the PK/PD parameters were evaluated visually using the scatter plot between POSTHOC estimations of each PK/PD parameter and each demographic factor. As a result, the following combinations of covariates and PK/PD parameters were examined:
(1) IgE0 on CLE/f; (2) BW on CLX/f; (3) BW on VX/f; (4) BW on VC/f; (5) AGE on ka; (6) AGE on VX/f; (7) SEX on VX/f.
In the first examination step, the combinations of (1) to (4) were included in the model, and the significance was confirmed by backward elimination. During this process (1) to (3) showed a significant change in the objective function value (−2LL > 12.12, P < 0.001), and (4) did not show a significant change. Baseline IgE was chosen as the covariate on PE/f and CLE/f, and the correlation between η(PE/f) and η(CLE/f) included the use of a block statement in order to stabilize the model. The inclusion of correlations, between these η's gave significant drops in the objective function value.
In a second examination step, combinations of (5) to (7) were in corporated one by one into the model built in the above step. No significant change in the objective function value was observed for (5) to (7).
As the result, the final model was developed to include the covariates shown in Table 3. The apparent clearance of omalizumab (CLX/f) and free IgE (CLE/f), the apparent rate of IgE production (PE/f) and apparent distribution volume of omalizumab (VX/f) depend onbaseline IgE and body weight according to the following equations:
Thus, doubling body weight increases the apparent clearance and volume of distribution of omalizumab by (20.911 − 1) · 100% = 88% and (20.658 − 1) · 100% = 58%, respectively. Doubling baseline IgE decreases the apparent clearance of free IgE by 18% and increases the apparent rate of IgE production by 58%.
The results of internal validation of the model are shown in Figure 3 for the single-dose study 1101 and in Figure 4 (upper panel) for the multiple-dose study 1305. Free IgE is predicted to decrease as the dose of omalizumab increases from 75 to 375 mg. Individual observed values were mostly within the 80% prediction intervals and the extent of interindividual variability specified in the model was similar to that observed. Some random deviations occur in the free IgE concentrations for the 150 mg dose group. However, the number of points within the 80% prediction intervals of free IgE for all dose groups was 390 of 491, or 79.4%. Even though the observed values of five of 12 subjects in the 150-mg group were not within the 80% prediction intervals, a binominal test P-value of 0.073 showed that this deviation was not significant. The observed median values of free IgE concentration in this group were mostly captured within the 95% prediction intervals for the medians (data not shown). Figure 4 (upper panel, study 1305) shows that the observed median values after multiple dosing were mostly captured within the 95% prediction intervals.
Figure 3.

Individual observed serum concentrations of omalizumab, total and free IgE in study 1101 and the 80% prediction intervals of the model predictions. The circles are individual observed values and lines are 10%, 50% and 90% percentiles at each time point calculated from 1000 simulated subjects for each cohort. The dashed line indicates the time of omalizumab administration. The upper limit of quantification for free IgE was 150 ng ml−1. Observations above this value were not quantified and could not be plotted
Figure 4.

Median observed serum concentrations of omalizumab, total and free IgE in studies 1305 and 007, and the 95% prediction intervals of the median predicted time course of the respective compound for the given dosing regimen. The circles are observed medians at each time point for each dose and regimen combination, and the lines are the 95% prediction intervals for medians calculated from 1000 simulated subjects at each time point. The data for two dose groups in study 1305 were omitted because the number of subjects was <10
The results of the external validation are shown in Figure 4 (lower panel) for the multiple-dose study 007, and in Figure 5 for the distributions of predicted and observed predose trough samples at steady state (studies 008 and 009). The observed median values following multiple doses of omalizumab are close to the 95% prediction intervals of the median (Figure 4).
Figure 5.

Frequency distribution of trough concentrations at steady state. Comparison of observed values and model predictions after the administration of omalizumab every 2 or 4 weeks in studies 008 and 009. The histograms are the observed distributions of trough concentrations, and the curve shows the distribution of trough concentrations for a simulation of 1000 subjects based on the parameters estimated from studies 1101 and 1305. The vertical line indicates the median of observed values and the hatched area indicates the 95% prediction intervals of the median calculated from the simulation
The shapes of the predicted and observed distributions were similar (Figure 5), and the 95% prediction intervals included the observed median in most cases. Although one may initially conclude that the model is not predictive, as >5% of the observed medians were outside the 95% prediction intervals, this is most likely due to the posterior predictive simulation not accounting for uncertainty in the NONMEM estimated values. To overcome this, an additional simulation was performed with uncertainty added to each parameter. The resultant uncertain 95% prediction intervals for the medians are shown in Figure 5 as horizontal bars. The intervals did not broaden to any great extent, but now there were no significant deviations of observed medians outside the prediction intervals for total IgE and, most relevent to clinical efficacy, free IgE (binomial test P = 0.2262).
Discussion
Consistent with other therapeutic monoclonal antibodies [26] and with previously reported results [19], an increase in total IgE was observed during treatment with omalizumab. This increase is caused by both a redistribution of ligand from extravascular sites, and a decrease in its rate of elimination due to slower clearance of the omalizumab–IgE complex compared with that of the free ligand [15–17]. The present mechanism-based direct-ligand binding model includes both of these mechanisms, giving rise to model parameters that are physiologically and physicochemically relevant.
Values of the apparent clearances obtained for free omalizumab and free IgE were 7.32 and 71.0 ml h−1 for a typical 61.1-kg patient with 482.4 ng ml−1 baseline IgE. The typical apparent distribution volumes of both compounds were 5900 ml. Therefore, the half-lives of omalizumab and IgE were 23 and 2.4 days, very close to previously reported values of 23 and 2.5–2.7 days for human IgG [24, 25] and IgE [24, 25, 27]. The mean half-life of total omalizumab calculated noncompartmentally in study 1101 was 18.2 days. This difference of 5 days compared with the value for free omalizumab is probably due to the fact that noncompartmental analysis calculates the clearance of the sum of free and complexed omalizumab and, therefore, the value is a mixture of the more slowly cleared free together with the more rapidly cleared complex. The clearance of the omalizumab–IgE complex was estimated to be 5.86 ml h−1 higher than that of free omalizumab. It is likely that the presence of IgE bound to omalizumab IgG interferes with the ability of the Brambell FcRn receptor [13] to rescue the IgG from lysosomal degradation. However, the fact that clearance of the complex is not as rapid as that of free IgE suggests that some level of rescue does occur, leading to an accumulation of total IgE compared with that observed at baseline.
When corrected for the 62% subcutaneous bioavailability of omalizumab [28], the absolute distribution volumes for a typical 61.1-kg subject are 3660 ml for free omalizumab, 2250 ml for the complex (Table 3). The latter is very close to the volume of plasma (2130 ml) for a subject of that body weight [29]. The volumes for omalizumab and IgE are somewhat larger, probably reflecting distribution to the tissue interstitium [30–32]. It is known that the concentration of immunoglobulin in interstitial fluid is lower than in blood [30–32], due to restricted vascular endothelial permeation and continual lymphatic drainage. Therefore, as expected, the IgG–IgE complex, with its higher molecular weight (340–1000 kDa) and hence lower tight-junctional permeability than free IgG (150 kDa) or free IgE (190 kDa), will appear to have a smaller distribution volume. Further, even if the complex were to permeate, due to the low concentration, any molecules of the complex should dissociate. Therefore, it is concluded that the observed increase in total serum IgE is caused not only by differences in clearance between IgE and complex, but also by a more restricted distribution volume.
Following internal and external validation, the model described the pharmacokinetic and pharmacodynamic responses over a broad range of conditions with respect to different subpopulations, doses and dose intervals. In particular, the response at steady state was determined by only three clearance parameters and the rate of IgE production. Kd was assumed to be identical in all patients, but was dependent upon the molar ratio of total omalizumab to total IgE.
Clearance of free IgE and the rate of production of IgE were shown to be accurately predicted by baseline IgE concentration; clearance and volume of distribution of free omalizumab by body weight. Therefore, the pharmacodynamic response is mainly a function of body weight, baseline IgE and dosage. The results of the simulations were obtained using only population PK/PD parameters from the model building, body weight and baseline IgE concentration in the validation dataset. The simulations, based on the two Japanese studies, were predictive of the distribution of the free IgE biomarker response in an independent non-Japanese population.
In conclusion, a mechanism-based population PK/PD model was established for omalizumab binding to IgE and its predictability was confirmed for the clinically important variable, free IgE. There was no significant deviation of predicted from observed median total and free IgE trough concentrations at steady state. The model, even though its parameters were estimated from small clinical pharmacological studies, mimicked the extent of free IgE variability in larger long-term Phase III studies, the predicted medians consistently being within 25% of observed values and the tails of the predicted distributions being close to those of the observed data across a fivefold range of dose. Furthermore, since the model was developed using Japanese patient data, and the posterior predictive evaluation was against data from Whites, there are unlikely to be notable differences in omalizumab pharmacokinetics and IgE pharmacodynamics between the populations.
Finally, the general model, specifying a monoclonal antibody, or other agent, binding to a target ligand in an equilibrium reaction with a fixed stoichiometry, is of general applicability given the increasing number of biotechnologically derived molecules being discovered and developed as therapeutic agents. The model described allows for the determination not only of drug characteristics, but also of those of an endogenous ligand, including half-life and rate of production, without direct administration of the natural ligand. This approach should be a powerful tool in the understanding of the role of many potential target ligands in the pathophysiology of diseases.
Conflict of interest
All authors work for Novartis Pharmaceuticals, manufacturers of omalizumab (trade mark Xolair™). P.J.L. owns shares in Novartis Pharmaceuticals AG and Novartis Corporation has granted options to W.M.S. to purchase American Depositary Shares of Novartis AG subject to terms of the stock incentive plan of the company.
We thank Dr Günther Kaiser, Dr Gilles-Jacques Riviere, Dr Laurence Brookman, Dr Jean-Louis Steimer, Dr Ryosei Leo Kawai, Dr Yoko Wakui and Mr Vincent Buchheit for their advice and support.
References
- 1.Ishizaka K, Ishizaka T. Identification of gamma IgE antibodies as a carrier of reaginic activity. J Immunol. 1967;99:1187–98. [PubMed] [Google Scholar]
- 2.Johansson SGO, Bennich H. Immunological studies of an atypical (myeloma) immunoglobulin. Immunology. 1967;13:381–94. [PMC free article] [PubMed] [Google Scholar]
- 3.Ishizaka K, Ishizaka T. Biological function of IgE antibodies and mechanisms of reaginic hypersensitivity. Clin Exp Immunol. 1970;6:25–42. [PMC free article] [PubMed] [Google Scholar]
- 4.Presta LG, Lahr SJ, Shields RL, Porter JP, Gorman CM, Fendly BM, Jardieu PM. Humanization of an antibody directed against IgE. J Immunol. 1993;151:2623–32. [PubMed] [Google Scholar]
- 5.Jardieu P. Anti IgE therapy. Curr Opin Immunol. 1995;7:779–82. doi: 10.1016/0952-7915(95)80047-6. [DOI] [PubMed] [Google Scholar]
- 6.Jardieu P, Schoenhoff M, Thomas D, Fox J, Presta L. IgE modulation: potential for anti IgE therapy in asthmatic disease. In: Chanez P, Bousquet J, Michel FB, Godard P, editors. Genetics to Quality of Life of the Optimal Treatment and Management of Asthma. Seattle: Hogrefe and Huber; 1996. pp. 193–7. [Google Scholar]
- 7.Heusser C, Jardieu P. Therapeutic potential of anti-IgE antibodies. Curr Opin Immunol. 1997;9:805–13. doi: 10.1016/s0952-7915(97)80182-3. [DOI] [PubMed] [Google Scholar]
- 8.Boushey HA, Fahy JV. Monoclonal anti IgE antibody E25 therapy for asthma. Res Immunol. 1998;149:189–92. [Google Scholar]
- 9.Fick RB. Therapy of allergic pulmonary diseases with anti IgE antibodies. Pediatr Pulmonol Suppl. 1999;18:115–7. [PubMed] [Google Scholar]
- 10.Holgate ST, Corne J, Jardieu P, Fick RB, Heusser CH. Treatment of allergic airways disease with anti IgE. Allergy. 1998;53:83–8. doi: 10.1111/j.1398-9995.1998.tb04946.x. [DOI] [PubMed] [Google Scholar]
- 11.Jardieu PM, Fick RB., Jr IgE inhibition as a therapy for allergic disease. Int Arch Allergy Immunol. 1999;118:112–5. doi: 10.1159/000024043. [DOI] [PubMed] [Google Scholar]
- 12.Patalano F. Injection of anti IgE antibodies will suppress IgE and allergic symptoms. Allergy. 1999;54:103–10. [PubMed] [Google Scholar]
- 13.Busse W, Corren J, Lanier BQ, McAlary M, Fowler-Taylor A, Cioppa GD, van As A, Gupta N. Omalizumab, anti-IgE recombinant humanized monoclonal antibody, for the treatment of severe allergic asthma. J Allergy Clin Immunol. 2001;108:184–90. doi: 10.1067/mai.2001.117880. [DOI] [PubMed] [Google Scholar]
- 14.Adelroth E, Rak S, Haahtela T, Aasand G, Rosenhall L, Zetterstrom O, Byrne A, Champain K, Thirlwell J, Cioppa GD, Sandstrom T. Recombinant humanized mAb-E25, an anti-IgE mAb, in birch pollen-induced seasonal allergic rhinitis. J Allergy Clin Immunol. 2000;106:253–9. doi: 10.1067/mai.2000.108310. [DOI] [PubMed] [Google Scholar]
- 15.Scherrmann JM, Terrien N, Urtizberea M, Pierson P, Denis H, Bourre JM. Immunotoxicotherapy: present status and future trends. J Toxicol Clin Toxicol. 1989;27:1–35. doi: 10.3109/15563658909038567. [DOI] [PubMed] [Google Scholar]
- 16.Sabouraud AE, Urtizberea M, Cano NJ, Grandgeorge M, Rouzioux JM, Scherrmann JM. Colchicine-specific Fab fragments alter colchicines disposition in rabbits. J Pharmacol Exp Ther. 1992;260:1214–9. [PubMed] [Google Scholar]
- 17.Valentine JL, Owens SM. Antiphencyclidine monoclonal antibody therapy significantly changes phencyclidine concentrations in brain and other tissues in rats. J Pharmacol Exp Ther. 1996;278:717–24. [PubMed] [Google Scholar]
- 18.Lobo ED, Hansen RJ, Balthasar JP. Antibody pharmacokinetics and pharmacodynamics. J Pharmaceut Sci. 2004;93:2645–68. doi: 10.1002/jps.20178. [DOI] [PubMed] [Google Scholar]
- 19.Meno-Tetang GML, Lowe PJ. On the prediction of the human response: a recycled mechanistic PK/PD approach. Basic Clin Pharmacol Tox. 2005;96:182–92. doi: 10.1111/j.1742-7843.2005.pto960307.x. [DOI] [PubMed] [Google Scholar]
- 20.US BLA ACM. XOLAIR™, BB IND 5369 Final. [17 October 2006]. Available at http://www.fda.gov/ohrms/dockets/ac/03/briefing/3952B1_01_Genentech-Xolair.pdf.
- 21.Soler M, Matz J, Townley R, Buhl R, O'Brien J, Fox H, Thirlwell J, Gupta N, Della Cioppa G. The anti-IgE antibody omalizumab reduces exacerbations and steroid requirement in allergic asthmatics. Eur Respir J. 2001;18:254–61. doi: 10.1183/09031936.01.00092101. [DOI] [PubMed] [Google Scholar]
- 22.Liu J, Lester P, Builder S, Shire SJ. Characterization of complex formation by humanized anti-IgE monoclonal antibody and monoclonal human IgE. Biochemistry. 1995;34:10474–82. doi: 10.1021/bi00033a020. [DOI] [PubMed] [Google Scholar]
- 23.Junghans RP. Finally! The Brambell receptor (FcRB). Mediator of transmission of immunity and protection from catabolism for IgG. Immunol Res. 1997;16:29–57. doi: 10.1007/BF02786322. [DOI] [PubMed] [Google Scholar]
- 24.Waldmann TA, Strober W. Metabolism of immunoglobulins. Prog Allergy. 1969;13:1–110. doi: 10.1159/000385919. [DOI] [PubMed] [Google Scholar]
- 25.Frazer JK, Capra JD. Immunoglobulins: Structure and function. In: Paul WE, editor. Fundamental Immunology. 4. Philadelphia: Lippincott-Raven; 1999. pp. 37–74. [Google Scholar]
- 26.Charles P, Elliott MJ, Davis D, Potter A, Kalden JR, Antoni C, Breedveld FC, Smolen JS, Eberl G, de Woody K, Feldmann M, Maini RN. Regulation of cytokines, cytokine inhibitors, and acute-phase proteins following anti-TNF-alpha therapy in rheumatoid arthritis. J Immunol. 1999;163:1521–8. [PubMed] [Google Scholar]
- 27.Waldmann TA, Iio A, Ogawa M, McIntyre OR, Strober W. The metabolism of IgE. Studies in normal individuals and in a patient with IgE myeloma. J Immunol. 1976;117:1139–44. [PubMed] [Google Scholar]
- 28.Xolair Omalizumab for Subcutaneous Use. Package insert. San Francisco, CA: Genentech, Inc.; 2003. [Google Scholar]
- 29.Streeten DHP, Bell DS. Circulating blood volume in chronic fatigue syndrome. J Chronic Fatigue Syndrome. 1998;4:3–11. [Google Scholar]
- 30.Bill A. Plasma protein dynamics. Albumin and IgG capillary permeability, extravascular movement, and regional blood flow in unanesthetized rabbits. Acta Physiol Scand. 1977;101:28–42. doi: 10.1111/j.1748-1716.1977.tb05980.x. [DOI] [PubMed] [Google Scholar]
- 31.Juweid M, Strauss HW, Yaoita H, Rubin RH, Fischman AJ. Accumulation of immunoglobulin G at focal sites of inflammation. Eur J Nucl Med. 1992;19:159–65. doi: 10.1007/BF00173275. [DOI] [PubMed] [Google Scholar]
- 32.Hedger MP, Hettiarachchi S. Measurement of immunoglobulin G levels in adult rat testicular interstitial fluid and serum. J Androl. 1994;15:583–90. [PubMed] [Google Scholar]