Abstract
We report the first clinical application of electrocardiographic imaging (ECGI), a new, noninvasive imaging modality for arrhythmias, in an athlete with focal ventricular tachycardia (VT) originating from a left ventricular (LV) diverticulum. A reconstructed map of the epicardial activation sequence during a single premature ventricular complex (PVC) of an identical QRS morphology to the clinical VT, generated from 224-electrode body surface ECGs and a chest CT (ECGI), localized the PVC to the site of the diverticulum. This correlated with subsequent maps obtained using standard techniques. We describe the first case that used ECGI to guide diagnosis and therapy of a clinical tachyarrhythmia.
Keywords: Imaging, Mapping, Arrhythmia, Epicardial, Ventricular Tachycardia
As summarized recently,1,2 electrocardiographic imaging (ECGI) is a new, noninvasive, imaging modality for cardiac electrophysiology (EP). This technique has been in development for many years. It derives from the desire to have a true noninvasive imaging modality for diagnosis of arrhythmias beyond the diagnostic capabilities of the 12-lead ECG. The latter technique still cannot provide precise information on or localization of regional electrical activity in the heart, nor can it provide the sequences of activation during arrhythmias. Body surface potential mapping (BSPM) can provide more electrical and diagnostic information than the 12-lead ECG, but, as summarized recently,3 has serious limitations that stem from the remote locations of the body surface electrodes relative to the heart. Limitations include low sensitivity in detecting abnormal activation and repolarization and inability to determine their location in the heart. Importantly, BSPM cannot provide the actual sequence of activation of the cardiac impulse during arrhythmias. Therefore, its use has been quite limited. Because of the above limitations, efforts have been made over the last 25 years to reconstruct epicardial activation sequences from body surface measurements obtained noninvasively, that is, to solve the so-called inverse problem of electrocardiography.4
ECGI represents an inverse technique to determine noninvasively and with high resolution the electrical activity of the heart from electrical data recorded on the body surface together with cardiac CT images. These data are used to reconstruct epicardial potential maps, epicardial electrograms, and maps of epicardial activation and repolarization.1 This technique has been studied extensively and has been tested and validated experimentally in a torso-tank model, in the normal and abnormal canine heart,5-11 and, recently, in humans.1 In particular, it has successfully provided images of cardiac activation and repolarization during normal excitation, during ventricular pacing, in the presence of conduction disturbances, and during atrial flutter.
ECGI has been recently evaluated through comparison with intraoperative mapping in patients undergoing cardiac surgery and has demonstrated accuracy better than 10 mm in locating focal activity initiated by pacing.12,13 But to date ECGI has not been used as a primary clinical tool for arrhythmia diagnosis and management.
Here we describe the first case in which ECGI was used in a patient to assist in the diagnosis and management of a tachyarrhythmia, an unusual ventricular tachycardia (VT). In particular, ECGI was applied to guide the catheter ablation of a focal VT in a young athlete. This case further validates the ECGI technique, but in a real clinical setting.
Case report
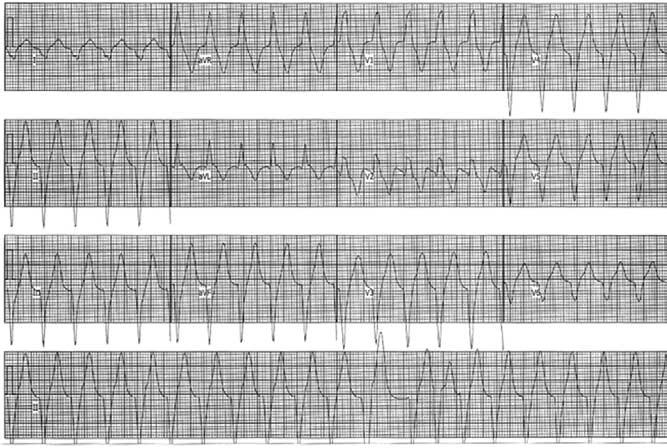
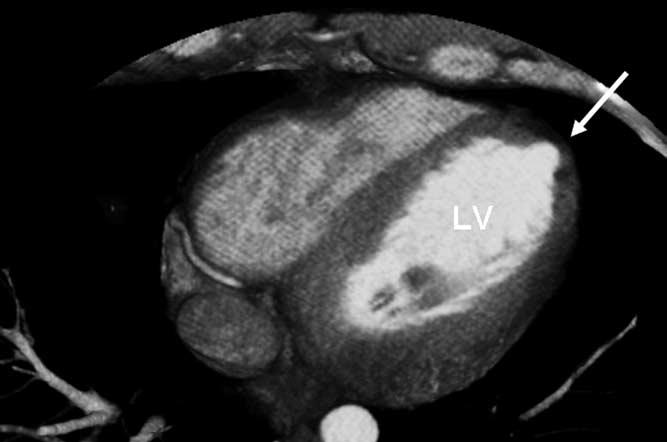
A 29-year-old athlete with no significant past medical history was referred to our institution for EP consultation. He had asymptomatic premature ventricular complexes (PVCs) on a routine, otherwise normal ECG and was subsequently shown to develop a spontaneous, sustained, wide QRS complex tachycardia (WCT) during an exercise treadmill test (Figure 1). On presentation to our hospital, the physical exam was normal and the baseline ECG was normal. Further diagnostic testing was performed. An echocardiogram was normal apart from a small left ventricular (LV) apical diverticulum, which was confirmed on magnetic resonance image and chest computed tomography (CT) (Figure 2). Previously, he had a normal standard cardiac catheterization, including normal coronary angiography. Because of suspicion that the WCT was emanating from the ventricular diverticulum and the fact that the patient continued to have PVCs of a morphology similar, if not identical, to the WCT, an ECGI was performed to characterize the ventricular activation sequence of the PVCs. Our intention was to provide objective data to confirm our suspicion.
Figure 1.

Twelve-lead ECG of the patient's clinical tachycardia. Rhythm strip is shown in the bottom panel is lead II. Paper speed = 25 mm/second.
Figure 2.

Cardiac CT scan of a cross section of the LV. Note the small LV apical diverticulum (arrow).
Methods and results
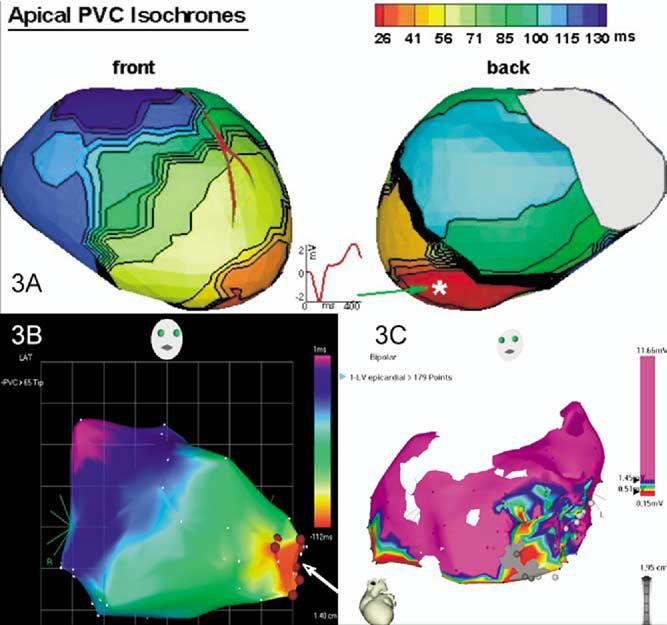
Before an invasive EP study, isolated PVCs of an identical morphology to the WCT were recorded using a body-surface 224-electrode vest covering the circumference of the thorax, along with a chest CT anatomic scan (the ECGI procedure).1 The noninvasively reconstructed epicardial electroanatomic ECGI map localized the origin of the PVCs to the LV apex (Figure 3A), precisely to the area of the diverticulum. Importantly, the QS wave pattern of the reconstructed electrogram from the site of origin of the PVCs indicated that those beats were emanating from the ventricular epicardium at that site (Figure 3A).
Figure 3.

Comparison of three different modalities of mapping in this patient with focal VT. A Reconstructed activation map of a single PVC using noninvasive ECGI. A reconstructed epicardial electrogram from the PVC site of origin (asterisk) is also shown. B Endocardial activation map of the LV chamber using three-dimensional electroanatomic (CARTO) mapping of PVCs—right anterior oblique view. Ablation sites are shown (arrow). C Because of the infrequent PVCs, the epicardial map was obtained during sinus rhythm. All sites with a bipolar electrogram amplitude >1.45 mV are shown as purple. A low-amplitude region is present at the apex, including regions that are electrically unexcitable to pacing at 10 mA (2-ms pulse width). The gray circles are sites where pacing captured the phrenic nerve. Pace mapping in the low-voltage region produced a QRS morphology similar to that of the PVCs (not shown). Respective time scales are shown in panels A and B. Voltage scale is shown in panel C.
An invasive EP study was then performed, guided by the noninvasive ECGI images. The tachycardia was sustained but could only be induced in the presence of isoproterenol (1–2 μg/minute). Intracardiac activation mapping during tachycardia demonstrated earliest activation in the apical LV diverticulum. During sinus rhythm, pace mapping at this area produced a QRS complex morphology remarkably similar to the VT morphology in 12/12 ECG leads. Electroanatomic three-dimensional mapping (CARTO) of the LV chamber performed during PVCs (Figure 3B) again identified the earliest site of activation at the LV apex in the region of the diverticulum, consistent with a focal origin of the tachycardia. Analysis of the CARTO maps and transient resolution of the VT during several radiofrequency applications delivered endocardially to the area supported the prior ECGI indication of an epicardial origin for the WCT.
VT recurred, and because we had the ECGI data indicating an epicardial origin of the arrhythmia, an epicardial mapping and ablation procedure was performed at another center via a subxiphoid puncture. Earliest activation of ventricular ectopic activity with a morphology similar to that of VT was identified in a region of low voltage (<1.45 mV) at the LV apex overlying the region of endocardial abnormality (Figure 3C). Cryolesions (−70°C) were placed in the low-voltage area. Close proximity to the phrenic nerve, assessed by capture during pacing, precluded performing a complete ablation of the region. After the procedure, VT recurred.
Discussion
We describe the first case in which ECGI has been used in a real clinical scenario to assist in the diagnosis and therapy of a patient with a tachyarrhythmia, in this case a VT. Noninvasively, and before any invasive EP study, ECGI generated a map of the epicardial activation sequence during a single PVC. This map guided the following invasive EP studies by indicating the origin of the tachycardia. Furthermore, the map generated by the ECGI correlated precisely with the invasive epicardial maps created using standard EP mapping techniques. Thus, this example describes the first case in which ECGI provided important information regarding the origin of a patient's clinical arrhythmia before embarking on an invasive EP study and attempting therapeutic ablation. It serves also as a harbinger of the possible use of this technique to assist in the management of both simple and complex cardiac arrhythmias.
Footnotes
EDITOR'S NOTE: Although case reports are limited to four authors, we made an exception in this case because of its complexity and the need for collaboration among multiple experts.
References
- 1.Ramanathan C, Ghanem RN, Jia P, Ryu K, Rudy Y. Noninvasive electrocardiographic imaging for cardiac electrophysiology and arrhythmia. Nat Med. 2004;10:422–428. doi: 10.1038/nm1011. [DOI] [PMC free article] [PubMed] [Google Scholar]
- 2.Rudy Y, Burnes JE. Noninvasive electrocardiographic imaging (ECGI) Ann Noninvas Electrocardiol. 1999;4:340–359. [Google Scholar]
- 3.Taccardi B, Punske B. Body surface potential mapping. In: Zipes DP, Jalife J, editors. Cardiac electrophysiology: from cell to bedside. WB Saunders; Philadelphia: 2004. pp. 803–811. [Google Scholar]
- 4.Gulrajani RM. The forward and inverse problems of Electrocardiography. IEEE Eng Med Biol Mag. 1998;17:84–101. doi: 10.1109/51.715491. [DOI] [PubMed] [Google Scholar]
- 5.Oster HS, Taccardi B, Lux RL, Ershler PR, Rudy Y. Noninvasive electrocardiographic imaging: reconstruction of epicardial potentials, electrograms, and isochrones and localization of single and multiple electrocardic events. Circulation. 1997;96:1012–1024. doi: 10.1161/01.cir.96.3.1012. [DOI] [PubMed] [Google Scholar]
- 6.Oster HS, Taccardi B, Lux RL, Ershler PR, Rudy Y. Electrocardiographic imaging: noninvasive characterization of intramural myocardial activation from inverse-reconstructed epicardial potentials and electrograms. Circulation. 1998;97:1496–1507. doi: 10.1161/01.cir.97.15.1496. [DOI] [PubMed] [Google Scholar]
- 7.Burnes JE, Taccardi B, MacLeod RS, Rudy Y. Noninvasive ECG imaging of electrophysiologically abnormal substrates in infarcted hearts: a model study. Circulation. 2000;101:533–540. doi: 10.1161/01.cir.101.5.533. [DOI] [PubMed] [Google Scholar]
- 8.Burnes JE, Taccardi B, Rudy Y. A noninvasive imaging modality for cardiac arrhythmias. Circulation. 2000;102:2152–2158. doi: 10.1161/01.cir.102.17.2152. [DOI] [PMC free article] [PubMed] [Google Scholar]
- 9.Ramanathan C, Rudy Y. Electrocardiographic imaging. II. Effect of torso inhomogeneities on the noninvasive reconstruction of epicardial potentials, electrograms and isochrones. J Cardiovasc Electrophysiol. 2001;12:241–252. doi: 10.1046/j.1540-8167.2001.00241.x. [DOI] [PubMed] [Google Scholar]
- 10.Ghanem RN, Burnes JE, Waldo AL, Rudy Y. Imaging dispersion of myocardial repolarization. II. Noninvasive reconstruction of epicardial measures. Circulation. 2001;104:1306–1312. doi: 10.1161/hc3601.094277. [DOI] [PubMed] [Google Scholar]
- 11.Burnes JE, Taccardi B, Ershler P, Rudy Y. Noninvasive ECG imaging of substrate and intramural ventricular tachycardia in infarcted hearts. J Am College Cardiol. 2001;38:2071–2207. doi: 10.1016/s0735-1097(01)01653-9. [DOI] [PMC free article] [PubMed] [Google Scholar]
- 12.Ghanem RN, Jia P, Ramanathan C, Ryu K, Markowitz A, Rudy Y. Noninvasive electrocardiographic imaging (ECGI): comparison to intraoperative mapping in patients. Heart Rhythm. 2005;2:339–354. doi: 10.1016/j.hrthm.2004.12.022. [DOI] [PMC free article] [PubMed] [Google Scholar]
- 13.Ghosh S, Rudy Y. Accuracy of quadratic versus linear interpolation in noninvasive electrocardiographic imaging (ECGI) Ann Biomed Eng. 2005;33:1187–1201. doi: 10.1007/s10439-005-5537-x. [DOI] [PMC free article] [PubMed] [Google Scholar]


