

Abstract
In the US, the increase in methamphetamine (METH) use has been associated with increased human immunodeficiency virus (HIV-1) infection. Dendritic cells (DC) are the first line of defense against HIV-1. DC play a critical role in harboring HIV-1 and facilitate the infection of neighboring T cells. However, the role of METH on HIV-1 infectivity and the expression of the proteome of immature dendritic cells (IDC) has not been elucidated. We hypothesize that METH modulates the expression of a number of proteins by IDC that foster the immunopathogenesis of HIV-1 infection. We utilized LTR amplification, p24 antigen assay and the proteomic method of difference gel electrophoresis (DIGE) combined with protein identification through high performance liquid chromatography-tandem mass spectrometry (HPLC-MS/MS) to analyze the effects of METH on HIV-1 infectivity (HIV-1 IIIB; CXCR4-tropic, X4 strain) and the proteomic profile of IDC. Our results demonstrate that METH potentiates HIV-1 replication in IDC. Furthermore, METH significantly differentially regulates the expression of several proteins including CXCR3, protein disulfide isomerase, procathepsin B, peroxiredoxin and galectin-1. Identification of unique, METH-induced proteins may help to develop novel markers for diagnostic, preventive and therapeutic targeting in METH using subjects.
Keywords: methamphetamine, immature dendritic cells (IDC), Difference Gel Electrophoresis (DIGE), HPLC-MS/MS
Introduction
Methamphetamine (METH) use is associated with a high risk of contracting human immunodeficiency virus (HIV-1) infection as a result of sharing contaminated needles and increased, risky, sexual behavior [1–7]. In 2005, an estimated 10.4 million Americans aged 12 and above tried METH at least once in their lifetime [2]. In the US METH used as a recreational drug has surpassed cocaine as of July 2005 [8]. Little is known about METH’s effects on the host’s immune response and the immunopathogenesis of HIV-1 infections.
Dendritic cells (DC) are antigen presenting cells that are the first line of defense against all pathogens including HIV-1 [9–15]. Immature DC (IDC) specialize in capturing and processing antigens. Interaction of IDC with an antigen results in cellular activation or maturation and migration to regional lymphoid tissues where the processed antigens are presented to naive CD4+ T cells, subsequently enabling T cell activation [13, 15]. Although the ability of DC to present antigen and stimulate naïve T cells has been shown in vitro, a better understanding of the immunoregulatory activities of DC on the immune system and their role in HIV-1 infection remains to be determined. A number of proteins induced by drugs of abuse have been implicated in susceptibility to HIV-1 infection and progression of the disease [16, 17]. There exists substantial literature on the psychosocial aspects of METH abuse and susceptibility to infection with HIV-1. However it is further suggested that exposure to METH also may have a biological effect on increased susceptibility to and progression of HIV-1 infections [4–7, 18]. These studies support our premise that METH has a direct effect on the ability of HIV-1 to infect its primary target, IDC. Furthermore we investigated the pathophysiologic mechanisms underlying this effect by examining METH-induced differences in protein profiling of IDC cultures using LTR amplification, p24 antigen assay and the proteomic method of difference gel electrophoresis (DIGE). The identification of unique, METH-responsive proteins by proteomic analyses may distinguish novel biomarkers for the prevention, diagnosis and treatment of HIV-1 infections of METH-using patients.
METHODS
Isolation and generation of DC
Blood donors were apprised of this study and consents were obtained consistent with the policies of the appropriate local institutions and the National Institutes of Health. Peripheral blood samples from healthy, HIV-1 negative individuals were drawn into a syringe containing heparin (20 units/ml). DC were prepared as described [19–22]. Briefly, human peripheral blood mononuclear cells (PBMC) were isolated by density gradient centrifugation on Ficoll-Paque (Amersham Pharmacia Biotech, Piscataway, NJ). CD14+ monocytes were separated from PBMCs using plastic adherence; the purity of monocyteswas >90%, verified using flow cytometry for CD14 (data not shown). To prepare immature DC (IDC), monocytes were cultured in RPMI 1640 medium with 1% human, AB serum, 500 U/ml of recombinant human interleukin-4 (IL-4; R&D Systems, Minneapolis, MN), and 1,000 U/ml of recombinant human granulocyte-macrophage colony-stimulating factor (GMCSF, Immunex) for 48 hr. Mature DC (MDC) were prepared by culturing IDC for an additional 2 days in the presence of interlekin-1 β (IL-1β, 10 ng/ml, R&D Systems, Minneapolis, MN), interleukin-6 (IL-6, 1000 U/ml, R&D Systems), tumor necrosis factor (TNF, 10 ng/ml, R&D Systems) and prostaglandin E2 (PGE2, 1 μg/ml, Sigma-Aldrich, St. Louis, Mo.).
Both IDC and MDC were washed in FACS buffer (e-Bioscience, San Diego, CA), incubated with nonspecific human IgG (20 μg/ml) for 10 min at 4°C to block Fc receptors, stained with specific antibodies for DC surface markers and analyzed by flow cytometry. Both MDC and IDC express CD80, CD86, and CD83 at different levels (Fig. 1). However, MDC predominantly express CD83 as described [23]. IDC were used for all experiments since earlier studies have shown that IDC are more susceptible to HIV-1 infection than MDC [24, 25]. IDC were >98% viable by trypan blue exclusion criteria.
FIGURE 1.

Constitutive expression of biomarkers on mature (MDC) and immature (IDC) dendritic cells as measured by FACS analysis. Statistical significance was determined by Student’s t-test (n = 3 independent experiments).
Drug Treatment
IDC were treated with METH (Sigma-Aldrich) at 50, 100 and 250 μM for 24 hr. The concentrations of METH used were based on previous dose response studies (1 to 250 μM) that produced a maximum biological response without causing toxicity to the target cells and also were based on published in vitro studies [26, 27]. These concentrations are similar to levels found in blood, urine or tissue samples of METH users that range from ≤2 μM to 600 μM [28–31]. METH was dissolved in sterile distilled water and was subsequently diluted in media to the required concentrations. For all experiments, cells treated with vehicle alone (media) were used as the untreated control.
Infection of human IDC with HIV-1
IDC (1×10⁵ cells/ml) were treated with METH (100 μM) for 24 hr and infected with native HIV-1 IIIB (CXCR4-tropic, X4 strain; NIH AIDS Research and Reference Reagent Program, Cat# 398) overnight at a concentration of 103.0 TCID50/ml cells, and washed 3 times with Hank’s balanced salt solution (Invitrogen, Grand Island, NY) before being returned to culture. A post infection period of 48 hr was used to amplify the LTR-R/U5 region that represents early stages of reverse transcription of HIV-1 [32]. In separate experiments, IDC were treated with METH for 24 hr, infected with HIV-1 IIIB overnight and washed and cultured for 15 days. The culture supernates were assayed for p24 antigen using a p24 ELISA kit (ZeptoMetrix Corporation, Buffalo, NY) on day 15.
RNA extraction and real time, quantitative PCR (Q-PCR)
IDC treated with and without METH (100 μM, 24 hr) were washed with 1X PBS (Invitrogen) and cytoplasmic RNA was extracted using an acid guanidinium-thiocyanate-phenol-chloroform method [33]. The final RNA pellet was dried and resuspended in diethyl pyrocarbonate (DEPC) water and the concentration of RNA was determined using a spectrophotometer at 260 nm. Any DNA contamination in the RNA preparation was removed by treating the RNA with DNAse (1 IU/μg of RNA, Promega, Madison WI) for 2 hr at 37°C, followed by proteinase K digestion at 37°C for 15 min and subsequent extraction with phenol/chloroform and NH4OAc/ETOH precipitation. The isolated RNA was stored at −70°C until used. DNA contamination of the RNA preparation was checked by including a control in which reverse transcriptase enzyme was not added to the PCR amplification procedure. Gene expression for HIV-1 LTR RU/5, filamin 1, talin 1, CXCR3, HSPA8, PDI, enolase, thioredoxin, nuclear ribonucleoprotein A2/B1, aldolase A, cathepsin X, inorganic pyrophosphatase, cathepsin B, galectin-1, calreticulin, pyruvate dehydrogenase, pyruvate kinase, coronin actin binding protein 1A, tyrosine 3/tryptophan 5-monooxygenase activation protein, zeta polypeptide, HSPA5, peroxiredoxin, 18s (Ambion, Austin, TX) and β-actin were quantitated using real time Q-PCR (Table 1). Relative abundance of each mRNA species was assessed using the SYBR green master mix from Stratagene (La Jolla, CA) to perform Q-PCR using the ABI Prism 5700 instrument that detects and plots the increase in fluorescence versus PCR cycle number to produce a continuous measure of PCR amplification. To provide precise quantification of initial target in each PCR reaction, the amplification plot is examined at a point during the early log phase of product accumulation. This is accomplished by assigning a fluorescence threshold above background and determining the time point at which each sample’s amplification plot reaches the threshold (defined as the threshold cycle number or CT). Differences in threshold cycle number are used to quantify the relative amount of PCR target contained within each tube [34]. Relative mRNA species expression was quantitated and expressed as transcript accumulation index (TAI = 2−(ΔΔCT)), calculated using the comparative CT method [35]. All data were controlled for quantity of RNA input by performing measurements on an endogenous reference gene, β-actin. In addition, results on RNA from treated samples were normalized to results obtained on RNA from the control, untreated sample.
Table 1.
Primer sequences for Real Time Q-PCR
| Primer | Primer sequences |
|---|---|
| β-actin | 5′, 5′-TGA CGG GGT CAC CCA CAC TGT GCC CAT CTA-3′
3′, 5-AGT CAT AGT CCG CCTA GAA GCA TTT GCG GT-3′ |
| HIV-1 LTR RU/5 | 5′ 5′-TCT CTC TGG TTA GAC CAG ATC TG-3′
3′ 5′-ACT GCT AGA GAT TTT CCA CAC TG-3′ |
| filamin 1 | 5′ 5′-AAG TGA CCG CCA ATA ACG AC-3′
3′ 5′-GGC GTC ACC CTG TGA CTT AT-3′ |
| talin 1 | 5′ 5′-CAC CAT GGT TGC ACT TTC AC-3′
3′ 5′-CCC ATT TCG GAG CAT GTA GT-3′ |
| CXCR3 | 5′, 5′-GCC CTC TAC AGC CTC CTC TT-3′
3′ 5′-ACA GCT AGG TGG AGC AGG AA-3′ |
| HSPA8 | 5′, 5′-GGA GGT GGC ACT TTT GAT GT-3′
3′ 5′-AGC AGT ACG GAG GCG TCT TA-3′ |
| PDI | 5′, 5′-AGC GTC CAT CAC TGC TTT CT-3′
3′ 5′-GAT GTC CTC GTG GTC TTG GT-3′ |
| Enolase | 5′, 5′-ATA AAG AAG GCC TGG AGC TGC TGA -3′
3′, 5′-TGC CCA GCT CCT CTT CAA TTC TGA-3′ |
| thioredoxin | 5′ 5′-TAT TAC GGG GTC TGG CTC TG-3′
3′ 5′-TGA GGC AGG AGA CCT CAT CT-3′ |
| nuclear ribonucleoprotein A2/B1 | 5′ 5′-GGC TAC GGA GGT GGT TAT GA-3′
3′, 5-ATA ACC CCC ACT TCC TCC AC-3′ |
| aldolase A | 5′, 5′-AAC ATG ACC CAC CTG TCC ATG CTA-3′
3′, 5′-TGG ATA TTG GTA GGG CAT GGT GCT-3′ |
| Cathepsin X | 5′ 5′-CCG CAG TAA TGA CAC CCT TT-3′
3′, 5-GCA CCC ACA GAG CTA AAA GC-3′ |
| inorganic pyrophosphatase | 5′ 5′-ACT ATG GTG CCA TCC CTC AG-3′
3′, 5-TCC CCT TCG TCA ATC ATA GC-3′ |
| Cathepsin B | 5′ 5′-CAC TGA CTG GGG TGA CAA TG-3′
3′, 5-AAC CAC AGG CTG GGA TGT AG-3′ |
| galectin-1 | 5′ 5′-CTC TCG GGT GGA GTC TTC TG-3′
3′, 5-GAA GGC ACT CTC CAG GTT TG-3′ |
| calreticulin | 5′ 5′-TCT CAG TTC CGG CAA GTT CT-3′
3′, 5-GTT GCT GAA AGG CTC GAA AC-3′ |
| pyruvate dehydrogenase | 5′ 5′-AGA ACT TCT ACG GGG GCA AT-3′
3′, 5-CGA ATA TCT GGC CCT GGT TA-3′ |
| Pyruvate kinase | 5′ 5′-ATC GTC CTC ACC AAG TCT GG-3′
3′, 5-GAA GAT GCC ACG GTA CAG GT-3′ |
| coronin actin binding protein 1A | 5′ 5′-CTC CAG CTC CTT CCT CCT CT-3′
3′, 5-GAG ACG CGC ACA TCT TCA TA-3′ |
| tyrosine 3/tryptophan 5-monooxygenase activation protein, zeta polypeptide | 5′ 5′-TTC TTG ATC CCC AAT GCT TC-3′
3′ 5′-AGT TAA GGG CCA GAC CCA GT-3′ |
| HSPA5 | 5′ 5′-TAG CGT ATG GTG CTG CTG TC-3′
3′ 5′-TTT GTC AGG GGT CTT TCA CC-3′ |
| peroxiredoxin | 5′ 5′-GTG TCC TTC GCC AGA TCA CT-3′
3′ 5′-ACG TTG GGC TTA ATC GTG TC-3′ |
Calculation of transcript accumulation index (TAI) or relative expression
For each sample, a difference in CT values (ΔCT) was calculated for each mRNA by taking the mean CT of duplicate tubes and subtracting the mean CT of the duplicate tubes for the reference RNA (β-actin) measured on an aliquot from the same RT reaction.
The ΔCT for the treated sample was then subtracted from the ΔCT for the untreated control sample to generate a ΔΔCT.
The mean of these ΔΔCT measurements was then used to calculate expression of the test gene relative to the reference gene and normalized to the untreated control as follows:
This calculation assumes that all PCR reactions are working with 100% efficiency. All PCR efficiencies were found to be >95%; therefore, this assumption introduces minimal error into the calculations [34, 35].
2 Dimensional (2D) difference gel electrophoresis (DIGE)
The Ettan DIGE technique (Amersham Pharmacia Biotech) was used to detect differences in protein abundance between normal and experimental samples [36–38]. The Ettan DIGE system uses three CyDye DIGE fluors (Cy2, Cy3, Cy5), each with a unique fluorescent wavelength, matched for mass and charge. CyDyes form a covalent bond with the free epsilon amino group on lysine residues from the sample proteins. CyDyes label approximately 2% of the lysine residues. This system allows for two experimental samples and an internal standard to be simultaneously separated on the same gel. The internal standard is comprised a pool of an equal amount of all the experimental samples. The use of an internal standard facilitates accurate inter-gel matching of spots, and allows for data normalization between gels to minimize gel to gel experimental variability [36–38].
Sample preparation
After stimulation, cells were washed 2 times with 1X PBS (Invitrogen). Total protein was extracted using standard cell lysis buffer [30 mM TrisCl; 8 M Urea; 4% (w/v) 3-[(3-Cholamidopropyl) dimethylammonio]-1-propanesulfonate (CHAPS), adjusted to pH 8.5] for 10 min on ice. Cell lysate was centrifuged at 4°C for 10 min at 12000 g and the lysate was further purified by precipitation with chloroform/methanol as described [39]. Cell lysates were resuspended in standard cell lysis buffer. Final cell lysate protein concentrations were determined with Coomassie Protein Reagent (Bio-Rad, Hercules, CA) and used for protein separation by DIGE analysis.
Sample labeling
All reagents used were from GE Healthcare. Briefly, 50 μg of cell lysate was labeled with 400 pmol of either Cy3 or Cy5 or Cy2 (Cy 2 was used to label the internal standard) on ice for 30 min and then quenched with a 50-fold molar excess of free lysine. Cy3, Cy5, Cy2 labeled samples and unlabeled protein (500–800 μg) were combined. An equal volume of 2X sample buffer was added [8 M Urea; 2% (v/v) Pharmalytes 3–10; 2% (w/v) dithiothreitol (DTT); 4% (w/v) CHAPS] incubated on ice for 10 min. The total volume of sample was adjusted to 450 μl with rehydration buffer [4% (w/v) CHAPS; 8 M Urea; 1% (v/v) Pharmalytes 3–10 nonlinear (NL); 13 mM DTT].
DIGE
Samples were applied to immobilized pH gradient (IPG) strips (24cm, pH 3–10 NL), and absorbed by active rehydration at 30 V for 13 hr. Isoelectric focusing was carried out using an IPGphor IEF system with a three phase program; first phase at 500 V for 1 hr, second phase at 1000 V for 1 hr, and third phase (linear gradient) 8000 V to 64000 V for 2hr (50 μA maximum per strip). Prior to separation in the second dimension, strips were equilibrated for 15 min in equilibration buffer I [50 mM Tris-HCl, 6 M Urea, 30% (v/v) glycerol, 2% (w/v) SDS, 0.5% (w/v) DTT]. The strips were again equilibrated for 15 min in the equilibration buffer II [50 mM Tris-HCl, 6 M Urea, 30% (v/v) glycerol, 2% (w/v) SDS, 4.5% (w/v) iodoacetamide] and transferred onto 18 × 20 cm, 12.5% uniform polyacrylamide gels poured between low fluorescence glass plates. Gels were bonded to inner plates using Bind-Silane solution according to the manufacturer’s protocol. Strips were overlaid with 0.9% agarose in 1X running buffer containing bromophenol blue and were run for 16 h (1.8W per gel, overnight) at 15ºC, in the Ettan DALT electrophoresis system.
Image acquisition
Fluorescent images of each CyDye (Cy3, Cy5, Cy2) were acquired using a Typhoon 9410 variable mode imager. After scanning, gels were fixed in 30% (v/v) methanol, 7.5% (v/v) acetic acid for 3 hr and then stained with SYPRO-Ruby dye (Molecular Probes, Eugene, OR) overnight at room temperature. Gels were de-stained in water and then scanned using the Typhoon 9410 scanner.
Image analysis
Images were processed in ImageQuant v5.2 software, and then imported into DeCyder differential in-gel analysis (DIA) software v5.0 from GE Healthcare for spot detection, and normalization of spot intensities within each gel. Intergel matching was done using the biological variation analysis (BVA) component of DeCyder for cross-gel statistical analysis. Standardized protein abundance was calculated by dividing each Cy3 or Cy5 spot volume with the corresponding Cy2 standard spot volume (internal control) within each gel, and the difference in standardized abundance between control and METH-treated IDC was expressed as the average volume ratio. A Kolmogorov-Smirnov test (KS-test) was applied to all data to test for a normal distribution. Statistical analysis (Student’s t-test) was then performed on normally distributed data. Protein spots that showed statically significant differences between the control and METH-treated samples were picked using the Ettan Spot Picker [36–38].
High performance liquid chromatography-tandem mass spectrometry (HPLC-MS/MS)
Excised spots were sent for analysis to the Proteomic Analysis Laboratory at the University of Arizona. In gel digestion and HPLC-MS/MS were performed as described by Breci et al. 2005 [40]. Briefly, gel slices were de-stained [40–42] and digested with trypsin [43]. The tryptic peptides were extracted with 5% formic acid/50% CH3CN. HPLC was performed using a microbore system (Surveyor, ThermoFinnigan, San Jose, CA). The HPLC column eluate was directed into a ThermoFinnigan LCQ Deca XP Plus ion trap mass spectrometer. Automated peak recognition, dynamic exclusion, and daughter ion scanning of the top two most intense ions were performed using Xcalibur software [44, 45]. Spectra were scanned over the range 400–1400 mass units. MS/MS data were analyzed using SEQUEST, a computer program that allows the correlation of experimental data with theoretical spectra generated from known protein sequences. A preliminary positive peptide identification for a doubly charged peptide was based upon a correlation factor (Xcorr) greater than 2.5, a delta cross-correlation factor (dCn) greater than 0.1 (indicating a significant difference between the best match reported and the next best match), a high preliminary scoring, and a minimum of one tryptic peptide terminus. For triply charged peptides the correlation factor threshold was set at 3.5. All matched peptides were confirmed by visual examination of the spectra, and all spectra were searched against the latest version of the public, non-redundant protein database of the National Center for Biotechnology Information (NCBI) [40].
Western blots
Briefly, 40 μg of protein was separated by electrophoresis using 4–20% Tris-glycine Express gels (ISC Bioexpress, Kaysville, UT) and transferred to polyvinylidene fluoride (PVDF) membranes (Sigma-Aldrich). Membranes were blocked for 2 hr with 5% nonfat dry milk in Tris-buffered saline with Tween 20 [150 mM NaCl, 20 mM Tris, pH 7.5, 0.1% Tween 20] and then incubated with primary antibodies overnight at 4ºC with gentle rocking. The primary antibodies used were anti-filamin 1 mouse monoclonal antibody, anti-CXCR3 goat polyclonal antibody, anti-enolase rabbit polyclonal antibody, anti-aldolase goat polyclonal antibody, anti-actin goat polyclonal antibody (Santa Cruz Biotech, Santa Cruz CA), anti-protein disulfide isomerase rabbit polyclonal antibody (Sigma-Aldrich) and anti-coronin 3 goat polyclonal antibody (Abcam, Cambridge, MA). Antibody concentrations used were based on the manufacturer’s specifications. After incubation with primary antibodies, membranes were washed and incubated with an appropriate biotin-conjugated secondary antibody (goat anti-mouse IgG or donkey anti-goat IgG or goat anti-rabbit IgG, Santa Cruz Biotech). After secondary antibody incubations, the membranes were washed 3 times, for 10 min each, in 1X TBS with 0.5% Tween 20 and then incubated for another 30 min with a streptavidin-alkaline phosphatase conjugate (Invitrogen) followed by colorimetric detection using NBT/BCIP reagent (Roche, Indianapolis, IN). Densitometry analyses were done using a Syngene Image Analyzer with Gene Tools Analysis Software version 3.02.00 (Syngene, Frederick, MD). Data were normalized to protein expression levels of β-actin.
Statistics
For western blot analyses and gene expression data, statistical significance was determined using a Student’s t-test or Mann-Whitney Rank Sum Test (SigmaStat, SPSS Inc.).
Results
Data presented in Figure 1 show basal levels of expression of different co-stimulatory molecules on both IDC and MDC as quantitated by flow cytometry. CD80, CD86 and CD83 are expressed at higher levels on MDC compared to IDC, consistent with previous reports [23].
METH enhances HIV-1 replication in IDC
Data presented in Fig. 2 show the stimulatory effects of METH on HIV-1 replication in IDC. IDC were treated with and without METH for 24 hr, infected with HIV-1 IIIB (CXCR4-tropic; X4 strain) overnight and washed before being returned to culture. A post infection period of 48 hr was used in the study to amplify the LTR-R/U5 region of the HIV-1 genome that represents early stages of reverse transcription of HIV-1. The HIV-1 LTR-R/U5 region was amplified by Q-PCR using primers (Table 1) specific for a 180 bp fragment of the region as described [32]. Data shown in Fig. 2A demonstrate that METH at 50 (TAI = 1.61, p = 0.01), 100 (TAI = 1.99, p = 0.001) and 250 μM (TAI = 2.39, p = 0.008) significantly up-regulated the expression of the HIV-1 LTR-R/U5 region compared to the untreated HIV-1 infected control culture (TAI = 1.0).
FIGURE 2.
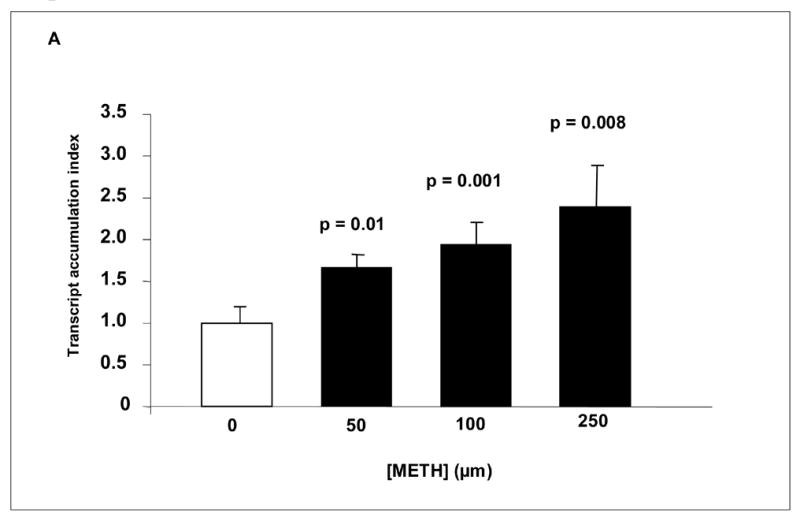

Effect of METH on HIV-1 replication in IDC. (A) IDC were treated with or without METH, infected with HIV-1 IIIB overnight, washed and cultured for 48 hr. RNA was extracted and reverse transcribed followed by quantitative, real time PCR using primers specific for the LTR-R/U5 region of the HIV-1 genome. Differences in threshold cycle number are used to quantitate the relative amount of PCR target contained within each tube. Relative mRNA species expression was quantitated and expressed as transcript accumulation index (TAI), calculated using the comparative CT method All data were controlled for quantity of RNA input by performing measurements on an endogenous reference gene, β-actin. (B) IDC were treated with or without METH, infected with HIV-1 IIIB overnight, washed and then cultured for 15 days. The culture supernatants were quantitated for p24 antigen using an ELISA method with a minimum detection range of 1 pg of p24 antigen/ml.
All data are presented as the mean ± SD of 3 independent experiments. Statistical significance was calculated by Student’s t-test
In subsequent experiments, IDC were treated with and without METH for 24 hr, infected with HIV-1 IIIB (CXCR4-tropic; X4 strain) overnight, washed and returned to culture for 15 days when levels of p24 antigen were measured. Data presented in Fig. 2B show the levels of p24 antigen in the culture supernatants of IDC infected with HIV-1 IIIB in the presence or absence of 100 μM METH. IDC infected with HIV-1 IIIB in the absence of METH produced 3.0 ng/ml of p24 antigen whereas IDC infected with HIV-1 IIIB in the presence of 100 μM METH significantly up-regulated the production of p24 antigen (15.7 ng/ml, p = 0.001). The production of p24 antigen was significantly up-regulated by METH and is consistent with the LTR amplification as presented in Fig. 2A.
METH differentially induces the expression of proteins in IDC as measured by proteomic analysis
Figure 3 is a representative 2D gel image of SYPRO Ruby stained proteins from a lysate of unifected IDC from a normal donor. Comparing standardized protein abundance data generated from the Cy3, Cy5 and Cy2 images (DeCYDER software) several proteins spots were differentially expressed between METH treated and untreated IDC cultures. The protein spots were excised from the SYPRO Ruby stained gel and identified by HPLC-MS/MS. These spots are shown on Figure 2 and indicated by arbitrary numbers that point to the outlines of the total stained protein spots. The respective identified proteins are listed in Table 2. Proteins showing increased expression levels in IDC treated with METH compared to the untreated control are: filamin 1, talin 1, CXCR3, Hsp70, protein 8 isoform 1 (HSPA8), protein disulfide isomerase (PDI), enolase 1, thioredoxin, nuclear ribonucleoprotein A2/B1, aldolase A, cathepsin X, inorganic pyrophosphatase, galectin-1 and procathepsin B. The following proteins showed decreased levels of expression in IDC treated with METH compared to the untreated control: calreticulin precursor, pyruvate dehydrogenase alpha 1, pyruvate kinase, coronin actin binding protein 1A, tyrosine 3, tryptophan 5-monooxygenase activation protein, zeta polypeptide, HSPA5, and peroxiredoxin.
FIGURE 3.
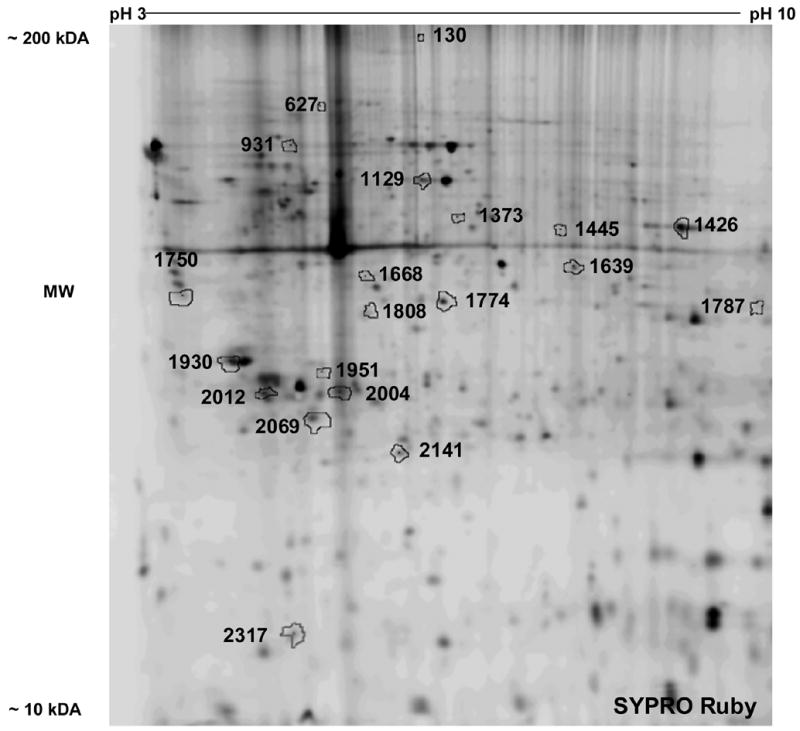
Representative 2-D gel image of IDC cell lysate. IDC were treated with 100 μM METH for 24 hr. Total protein was isolated and subjected to DIGE analysis as described in methods. Representative 2-D gel image of proteins stained with SYPRO Ruby. Arbitrary numbers point to (arrows) the outline of statistically significant, differentially expressed proteins between control and METH treated IDC. Identity of each protein is shown in Table 2. Three separate experiments gave similar results.
Table 2.
IDC were cultured with and without METH (100 μM) for 24 hr (n = 3 independent experiments). Protein was extracted and subjected to DIGE as described in methods section. Data represent statistically significant differentially expressed proteins (Student’s t-test) that were identified using HPLC-MS/MS. Data are represented as protein name, gene accession number (Gi No.), average ratio, significance, % sequence coverage, theoretical mass, theoretical isoelectric point (pI), and molecular function (http://au.expasy.org/sprot/).
| Spot# | Protein Name | Accession (Gi No.) | Average ratio | P value | % sequence coverage | Theoretical Mass | Theoretical pI | Molecular Function |
|---|---|---|---|---|---|---|---|---|
| 130 | filamin 1 | gi|4503745| | 1.46 | 0.02 | 4.7 | 280761.06 | 5.73 | actin-binding protein |
| 130 | talin 1 | gi|14916725| | 1.46 | 0.02 | 2.4 | 296717.94 | 5.72 | actin-binding protein |
| 627 | CXCR3 | gi|20984919| | 1.76 | 0.001 | 28 | 88851.26 | 5.14 | chemokine receptor |
| 931 | Hsp70, protein 8 isoform 1 (HSPA8) | gi|5729877| | 1.70 | 0.04 | 5.4 | 70898.09 | 5.37 | molecular chaperone |
| 1129 | protein disulfide isomerase (PDI) | gi|7437388| | 1.53 | 0.014 | 30 | 56796.11 | 5.98 | protein disulfide reduction |
| 1426 | enolase | gi|4503571| | 1.38 | 0.01 | 43 | 47168.96 | 7.01 | glycolysis |
| 1668 | thioredoxin | gi|14249134| | 1.33 | 0.001 | 4.7 | 31361.01 | 4.93 | protein disulfide reduction |
| 1774 | unidentified | 1.64 | 0.05 | |||||
| 1787 | nuclear ribonucleoprotein A2/B1 | gi|7949053| | 1.25 | 0.01 | 22 | 35992.98 | 8.67 | Ribonucleoprotein nucleotide binding |
| 1787 | aldolase A | gi|229674| | 1.25 | 0.01 | 6.41 | 39288.83 | 8.39 | glycolysis |
| 1808 | cathepsin X | gi|7546545| | 1.33 | 0.05 | 36 | 27149.11 | 5.48 | cysteine-type peptidase activity |
| 1808 | inorganic pyrophosphatase | gi|11056044| | 1.33 | 0.05 | 20 | 32660.04 | 5.54 | hydrolase activity |
| 1951 | procathepsin B | gi|2982152| | 1.28 | 0.03 | 15 | 35167.57 | 5.89 | protease |
| 2317 | galectin 1 | gi|4504981| | 1.45 | 11 | 14715.70 | 5.33 | beta-galactoside-binding protein | |
| 1373 | coronin actin binding protein 1A | gi|5902134| | −1.49 | 0.04 | 5.9 | 51026.25 | 6.25 | actin binding |
| 1445 | pyruvate dehydrogenase alpha 1 | gi|4505685| | −1.63 | 0.04 | 6.1 | 43295.63 | 8.35 | oxidoreductase activity |
| 1639 | pyruvate kinase | gi|4505839| | −1.74 | 0.02 | 23 | 57913.85 | 7.95 | glycolysis |
| 1750 | calreticulin | gi|4757900| | −1.36 | 0.03 | 39 | 48141.56 | 4.29 | Ca(2+)-binding protein |
| 1930 | unidentified | −1.77 | 0.05 | |||||
| 2004 | tyrosine 3/tryptophan 5 - monooxygenase activation protein, zeta polypeptide | gi|4507953| | −1.78 | 0.004 | 31 | 27745.10 | 4.73 | signal transduction |
| 2012 | unidentified | −2.47 | 0.001 | |||||
| 2069 | dnaK-type molecular chaperone (HSPA5) | gi|87528| | −1.63 | 0.03 | 13 | 72115.65 | 5.03 | molecular chaperone |
| 2141 | peroxiredoxin | gi|2507169| | −1.42 | 0.03 | 29 | 21891.92 | 5.66 | antioxidant activity |
The expression of specific proteins was confirmed and quantitated by western blots and densitometry (Fig. 4). Protein expression for β-actin was unchanged in untreated versus METH treated IDC (data not shown). An increase in protein expression for filamin 1 (152.6 ± 9.96, p<0.001, 52.6% up-regulation), CXCR3 (181.30 ± 13.83, p<0.001, 81.3% up-regulation), PDI (150.23 ± 10.56, p<0.001, 50.23% up-regulation), enolase (151.82 ± 5.96, p<0.001, 51.82% up-regulation) and aldolase (144.59 ± 2.59, p<0.001, 44.59% up-regulation) was induced by treatment of IDC with METH compared to the control. While, a decrease in protein expression for coronin (55.09 ± 2.91, p<0.001, 44.90% down-regulation) and peroxiredoxin (59.47 ± 3.8, p<0.001, 40.53% down-regulation) was induced by treatment of IDC with METH compared to the control. These results are consistent with the effects of METH on protein expression by IDC as determined by DIGE (Table 2).
FIGURE 4.

Western blot analysis of the effect of METH on the differential expression of proteins by IDC. IDC were treated with 100 μM METH for 24 hr. Total protein was isolated and subjected to western blots. Densitometry analyses were done using a Syngene Image Analyzer with Gene Tools Analysis Software. Data were normalized to protein expression levels of β-actin (data not shown). The graphs show the % change in OD as measured by densitometry of bands from western blots. Statistical significance was determined by Student’s t-test (n = 3 independent experiments.
METH differentially modulates gene expression
To associate the differential expression of METH-induced protein modulation with respective mRNA expression, the effect of METH on mRNA levels by Q-PCR analysis was investigated (Table 3). IDC were cultured for 24 hr with 100 μM METH, RNA was extracted, reverse transcribed and cDNA was amplified using real time, Q-PCR (primer sequences shown in Table 1). The following genes showed increased expression levels (Table 3) in IDC treated with METH compared to control: filamin 1, talin 1, CXCR3, HSPA8, PDI, enolase, thioredoxin, nuclear ribonucleoprotein A2/B1, aldolase A, cathepsin X, inorganic pyrophosphatase, galectin-1 and procathepsin B. By contrast these genes showed decreased expression by METH treated IDC compared to untreated controls: calreticulin, pyruvate dehydrogenase, pyruvate kinase, coronin actin binding protein 1A, tyrosine 3/tryptophan 5-monooxygenase activation protein zeta polypeptide, HSPA5, and peroxiredoxin. METH treatment had no effect on 18s control RNA gene expression that was used as an internal control (data not shown).
Table 3.
METH modulation of gene expression. IDC were treated with 100 μM METH for 24 hr. Relative mRNA species expression was quantitated and expressed as transcript accumulation index (TAI), calculated using the comparative CT method.
| Up-regulated Genes | ||
|---|---|---|
| Gene name | TAI | p value |
| filamin 1 | 1.52 ± 0.13 | 0.002 |
| talin 1 | 1.72 ± 0.23 | 0.001 |
| CXCR3 | 1.71 ± 0.24 | 0.006 |
| HSPA8 | 1.57 ± 0.23 | 0.015 |
| PDI | 1.32 ± 0.06 | 0.013 |
| Enolase | 1.49 ± 0.37 | 0.084 (NS) |
| Thioredoxin | 1.49 ± 0.05 | 0.001 |
| nuclear ribonucleoprotein A2/B1 | 1.45 ± 0.28 | 0.018 |
| aldolase A | 1.30 ± 0.12 | 0.029 * |
| cathepsin X | 1.60 ± 0.24 | 0.029 * |
| inorganic pyrophosphatase | 1.47 ± 0.18 | 0.011 |
| cathepsin B | 1.60 ± 0.39 | 0.029 * |
| galectin-1 | 1.39 ± 0.21 | 0.010 |
| Down-regulated Genes | ||
| Gene name | TAI | p value |
| Calreticulin | 0.42 ± 0.21 | 0.029 * |
| pyruvate dehydrogenase | 0.56 ± 0.19 | 0.004 |
| pyruvate kinase | 0.54 ± 0.22 | 0.007 |
| coronin actin binding protein 1A | 0.48 ± 0.09 | 0.029 * |
| tyrosine 3/tryptophan 5 - monooxygenase activation protein, zeta polypeptide | 0.53 ± 0.16 | 0.029 * |
| HSPA5 | 0.46 ± 0.11 | 0.001 |
| peroxiredoxin | 0.66 ± 0.08 | 0.002 |
Statistical significance was calculated by Student’s t-test or Mann-Whitney Rank Sum Test* (n = 3–4).
Discussion
Recent studies show a high prevalence of HIV-1 infection among METH users [1–8]. A trend toward new HIV-1 mutations that are associated with METH use is occurring. Markowitz et al. [18] identified a dual tropic, multi-drug resistant viral strain from a METH user. This patient had rapid HIV-1 seroconversion with progression to symptomatic AIDS in 4–20 months [18]. Ellis et al. [46] demonstrated that HIV-1 positive METH users who were receiving HAART therapy had higher viral loads than HIV-1 positive METH users who were not receiving therapy. These findings by Markowitz and Ellis demonstrate the potentially deleterious effects of METH on the HIV-1 epidemic and a need to further understand the effects of METH on the immune system.
Previous studies have shown that drugs of abuse such as cocaine enhance the replication of HIV-1 in vitro [47–51] supporting the hypothesis that drug abuse is a cofactor in the pathogenesis of HIV-1 disease. Studies by Gavrilin et al. [52] demonstrate that METH significantly increases feline immunodeficiency virus (FIV, X4) replication in astrocytes [52]. Since METH potentiates FIV replication in vitro [52], we sought to determine the effects of METH on the replication of a CXCR4-tropic virus (HIV-1 IIIB) in IDC. HIV-1 IIIB has been shown to remain infectious for several days in METH solutions [53]. The current study demonstrates that pretreatment of IDC with METH prior to infection with HIV-1 IIIB (X4) enhances viral replication. The LTR-R/U5 region represents early stages of reverse transcription of HIV-1 [32]. We found a significant increase in LTR–R/U5 gene expression in IDC that were pretreated with METH prior to infection compared to untreated IDC control cells infected with HIV-1 IIIB. Furthermore, METH pretreatment significantly enhances p24 antigen levels in IDC infected with HIV-1 IIIB compared to untreated control cells. These studies demonstrate that METH potentiates the replication of the CXCR4-tropic virus, HIV-1 IIIB, in IDC and supports our premise that METH is a co-factor in the pathogenesis of HIV-1 infections.
The mechanisms and the role of drug abuse underlying the pathogenesis of HIV-1 infections remain undetermined. As IDC can be infected with HIV-1 (HIV-1 IIIB, CXCR4-tropic virus), which is potentiated by METH, and several proteins are known to foster the pathogenesis of HIV-1, we examined the affects of METH on IDC using proteomic analyses. Specifically we sought to determine if treatment of IDC with METH affected the expression of proteins that could facilitate infection by HIV-1. The expression of several proteins in IDC was differentially regulated by treatment with METH. These proteins were detected by 2D-DIGE and identified by HPLC-MS/MS. The potential relevance of the differential expression of various METH-regulated proteins on HIV-1 infection of IDC is discussed below.
The expression of several proteins that promote viral adhesion, entry, replication and propagation were increased in IDC following METH treatment. These proteins include galectin-1, PDI, and the actin binding proteins, filamin 1 and talin 1. Galectin-1 is a member of a family of lectins with an affinity to β-galactosidase that is defined by a shared amino acid sequence in their carbohydrate-recognizing domain. Galectin-1 is located both extracellularly and intracellularly and is widely expressed in mammals in the lung, brain, heart, spleen and lymph nodes [54]. Galectin-1 modulates cell proliferation, apoptosis, cell cycle arrest, cell-matrix adhesion and cell-to-cell adhesion [54–56]. Regarding viral adhesion and replication, galectins are soluble adhesion molecules that mediate direct cell-pathogen interactions [54]. Galectin-1 enhances HIV-1 infectivity and replication by allowing efficient binding of virus particles to target cells [57]. Previous studies demonstrate that galectin-1 acts as a soluble HIV-1 binding protein that can stabilize virus-cell interactions and promote virus replication in PBMC and CD4+ T cells [57]. Galectin-1 may increase the capture of mature virions by DC, the primary targets of HIV-1 [57]. Thus increased expression of galectin-1 in IDC induced by METH may enhance capture of HIV-1 subsequently increasing infectivity of IDC. By reduction of disulfide bonds, PDI induces a major conformational change in gp120 thereby facilitating HIV-1 entry into target cells via the CD4 receptor [58]. Inhibition of PDI prevents activation of gp41, HIV-1 entry, and envelope-mediated cell-to-cell fusion [58–63]. Thus we postulate that, in addition to other effects, METH facilitates HIV-1 infections by up-regulating the expression of PDI and enhancing viral entry into target cells. Receptor engagement by the viral envelope glycoprotein (Env) requires actin-dependent recruitment of HIV-1 receptors to produce a junction for HIV-1 to infect neighboring target cells [64]. Filamin 1 crosslinks actin filaments into a three-dimensional structure and regulates the reorganization of the actin cytoskeleton [65] while talin 1 plays a significant role in the assembly of actin filaments [66]. Our findings suggest that the increased expression of filamin 1 and talin 1 may reorganize the actin cytoskeleton and recruit HIV-1 receptors permitting infection of neighboring cells.
This study found that the expression of peroxiredoxin, a protein with anti-viral capabilities was decreased following METH treatment of IDC. Peroxiredoxins are a family of antioxidant proteins [67] that are capable of inhibiting HIV-1 infection. Members of the peroxiredoxin family, NKEF-A or NKEF-B inhibit HIV-1 replication in CD8+ T cells. It is proposed that peroxiredoxins are up-regulated in these cells during HIV-1 infection and manifest antiviral activity [68]. Our studies suggest that a decrease in the expression of peroxiredoxins may lead to an increase in HIV-1 replication; therefore METH may enhance the susceptibility of IDC to HIV-1 infection by decreasing these antioxidant proteins. In summary, we were able to identify several proteins in IDC that affect infection with HIV-1 whose expression was differentially regulated by treatment with METH. These studies provide a molecular mechanism for the role of METH abuse as a co-factor in infection with HIV-1. The identified proteins may subsequently serve as biomarkers of disease progression but more importantly may serve as targets for therapies yet to be developed.
Supplementary Material
Abbreviations
- (HSPA8)
Hsp70, protein 8 isoform 1
- (IDC)
immature dendritic cells
- (MDC)
mature dendritic cells
- (PDI)
protein disulfide isomerase
- (HSPA5)
dnaK-type molecular chaperone
Footnotes
NIDA:RO1-DA15628, RO1-DA12366, RO-DA14218, 1F32DA02153501, Kaleida Health Foundation
Publisher's Disclaimer: This is a PDF file of an unedited manuscript that has been accepted for publication. As a service to our customers we are providing this early version of the manuscript. The manuscript will undergo copyediting, typesetting, and review of the resulting proof before it is published in its final citable form. Please note that during the production process errors may be discovered which could affect the content, and all legal disclaimers that apply to the journal pertain.
References
- 1.National Drug Threat Assessment (NDTA) Summary Report. 2005 Methamphetamine, www.usdoj.gov/ndic/pubs11/13846/meth.htm.
- 2.Substance Abuse and Mental Health Services Administration. Results from the 2005 National Survey on Drug Use and Health. National Findings, September 2006. [Google Scholar]
- 3.Frosch D, Shoptaw S, Huber A, Rawson RA, Ling W. Sexual HIV risk among gay and bisexual male methamphetamine abusers. J Subst Abuse Treat. 1996;13:483–486. doi: 10.1016/s0740-5472(96)00098-0. [DOI] [PubMed] [Google Scholar]
- 4.Halkitis PN, Parsons JT, Stirratt MJ. A Double Epidemic: Crystal Methamphetamine Drug Use in Relations to HIV Transmission Among Gay Men. J Homosexuality. 2001;41:17–35. doi: 10.1300/J082v41n02_02. [DOI] [PubMed] [Google Scholar]
- 5.Halkitis PN, Fischgrund BN, Parsons JT. Explanations for methamphetamine use among gay and bisexual men in New York City. Subst Use Misuse. 2005;40:1331–1345. doi: 10.1081/JA-200066900. [DOI] [PubMed] [Google Scholar]
- 6.Urbina A, Jones K. Crystal methamphetamine, its analogues, and HIV infection: medical and psychiatric aspects of a new epidemic. Clin Infect Dis. 2004;38:890–894. doi: 10.1086/381975. [DOI] [PubMed] [Google Scholar]
- 7.Boddiger D. Metamphetamine use linked to rising HIV transmission. Lancet. 2005;365:1217–1218. doi: 10.1016/S0140-6736(05)74794-2. [DOI] [PubMed] [Google Scholar]
- 8.http://news.bbc.co.uk.go/pr/fr/-/2/hi/americas/4654503
- 9.Baribaud F, Pohlmann S, Sparwasser T, Kimata MT, Choi YK, Haggarty BS, Ahmad N, Macfarlan T, Edwards TG, Leslie GJ, Arnason J, Reinhart TA, Kimata JT, Littman DR, Hoxie JA, Doms RW. Functional and antigenic characterization of human, rhesus macaque, pigtailed macaque, and murine DC-SIGN. J Virol. 2001;75:10281–10289. doi: 10.1128/JVI.75.21.10281-10289.2001. [DOI] [PMC free article] [PubMed] [Google Scholar]
- 10.Geijtenbeek TB, van Kooyk Y. DC-SIGN: a novel HIV receptor on DCs that mediates HIV-1 transmission. Curr Top Microbiol Immunol. 2003;276:31–54. doi: 10.1007/978-3-662-06508-2_2. [DOI] [PubMed] [Google Scholar]
- 11.Pohlmann S, Leslie GJ, Edwards TG, Macfarlan T, Reeves JD, Hiebenthal-Millow K, Kirchhoff F, Baribaud F, Doms RW. DC-SIGN interactions with human immunodeficiency virus: virus binding and transfer are dissociable functions. J Virol. 2001;75:10523–10526. doi: 10.1128/JVI.75.21.10523-10526.2001. [DOI] [PMC free article] [PubMed] [Google Scholar]
- 12.Pohlmann S, Baribaud F, Doms RW. DC-SIGN and DC-SIGNR: helping hands for HIV. Trends Immunol. 2001;22:643–646. doi: 10.1016/s1471-4906(01)02081-6. [DOI] [PubMed] [Google Scholar]
- 13.Hart DN. Dendritic cells: unique leukocyte populations which control the primary immune response. Blood. 1997;90:3245–3287. [PubMed] [Google Scholar]
- 14.Steinman RM, Germain RN. Antigen presentation and related immunological aspects of HIV-1 vaccines. AIDS. 1998;12SA:S97–112. [PubMed] [Google Scholar]
- 15.Banchereau J, Steinman RM. DC and the control of immunity. Nature. 1998;392:245–252. doi: 10.1038/32588. [DOI] [PubMed] [Google Scholar]
- 16.Nath A, Maragos WF, Avison MJ, Schmitt FA, Berger JR. Acceleration of HIV dementia with methamphetamine and cocaine. J Neurovirol. 2001;7:66–71. doi: 10.1080/135502801300069737. [DOI] [PubMed] [Google Scholar]
- 17.Nath A, Hauser KF, Wojna V, Booze RM, Maragos W, Prendergast M, Cass W, Turchan JT. Molecular basis for interactions of HIV and drugs of abuse. J Acquir Immune Defic Syndr. 2002;31S2:S62–69. doi: 10.1097/00126334-200210012-00006. [DOI] [PubMed] [Google Scholar]
- 18.Markowitz M, Mohri H, Mehandru S, Shet A, Berry L, Kalyanaraman R, Kim A, Chung C, Jean-Pierre P, Horowitz A, La Mar M, Wrin T, Parkin N, Poles M, Petropoulos C, Mullen M, Boden D, Ho DD. Infection with multidrug resistant, dual-tropic HIV-1 and rapid progression to AIDS: a case report. Lancet. 2005:1031–1038. doi: 10.1016/S0140-6736(05)71139-9. [DOI] [PubMed] [Google Scholar]
- 19.Nair MP, Mahajan SD, Schwartz SA, Reynolds J, Whitney R, Bernstein Z, Chawda RP, Sykes D, Hewitt R, Hsiao CB. Cocaine Modulates Dendritic Cell-Specific C Type Intercellular Adhesion Molecule-3-Grabbing Nonintegrin Expression by Dendritic Cells in HIV-1 Patients. J Immunol. 2005;174:6617–6626. doi: 10.4049/jimmunol.174.11.6617. [DOI] [PubMed] [Google Scholar]
- 20.Dauer MB, Obermaier J, Herten C, Haerle K, Pohl S, Rothenfusser M, Schnurr S, Endres S, Eigler A. Mature dendritic cells derived from human monocytes within 48 hours: a novel strategy for dendritic cell differentiation from blood precursors. J Immunol. 2003;170:4069–4076. doi: 10.4049/jimmunol.170.8.4069. [DOI] [PubMed] [Google Scholar]
- 21.Dauer M, Pohl K, Obermaier B, Meskendahl T, Robe J, Schnurr M, Endres S, Eigler A. Interferon-alpha disables dendritic cell precursors: dendritic cells derived from interferon-alpha-treated monocytes are defective in maturation and T-cell stimulation. Immunology. 2003;110:38–47. doi: 10.1046/j.1365-2567.2003.01702.x. [DOI] [PMC free article] [PubMed] [Google Scholar]
- 22.Bender AM, Sapp G, Schuler R, Steinman RM, Bhardwaj N. Improved methods for the generation of dendritic cells from nonproliferating progenitors in human blood. J Immunol Methods. 1996;196:121–35. doi: 10.1016/0022-1759(96)00079-8. [DOI] [PubMed] [Google Scholar]
- 23.Turville SG, Cameron PU, Handley A, Lin G, Pöhlmann S, Doms RW, Cunningham AL. Diversity of receptors binding HIV on dendritic cell subsets. Nat Immunol. 2002;3:975–983. doi: 10.1038/ni841. [DOI] [PubMed] [Google Scholar]
- 24.Frank L, Kacani H, Stoiber H, Stossel M, Spruth F, Steindl N, Romani MP. Dierich Human immunodeficiency virus type 1 derived from cocultures of immature dendritic cells with autologous T cells carries T-cell-specific molecules on its surface and is highly infectious. J Virol. 1999;73:3449–54. doi: 10.1128/jvi.73.4.3449-3454.1999. [DOI] [PMC free article] [PubMed] [Google Scholar]
- 25.Cameron P, Pope M, Granelli-Piperno A, Steinman RM. Dendritic cells and the replication of HIV-1. J Leukoc Biol. 1996;59:158–71. doi: 10.1002/jlb.59.2.158. [DOI] [PubMed] [Google Scholar]
- 26.Theodore S, Cass WA, Nath A, Steiner J, Young K, Maragos WF. Inhibition of tumor necrosis factor-alpha signaling prevents human immunodeficiency virus-1 protein Tat and methamphetamine interaction. Neurobiol Dis. 2006;23:663–668. doi: 10.1016/j.nbd.2006.05.005. [DOI] [PubMed] [Google Scholar]
- 27.Lee YW, Hennig B, Yao J, Toborek M. Methamphetamine induces AP-1 and NF-kappa B binding and transactivation in human brain endothelial cells. J Neurosci Res. 2001;15:583–591. doi: 10.1002/jnr.1248. [DOI] [PubMed] [Google Scholar]
- 28.Kalasinsky KS, Bosy TZ, Schmunk GA, Reiber G, Anthony RM, Furukawa Y, Guttman M, Kish SJ. Regional distribution of methamphetamine in autopsied brain of chronic human methamphetamine users. Forensic Sci Int. 2001;116:163–169. doi: 10.1016/s0379-0738(00)00368-6. [DOI] [PubMed] [Google Scholar]
- 29.Klette KL, Kettle AR, Jamerson MH. Prevalence of use study for amphetamine (AMP), methamphetamine (MAMP), 3,4-methylenedioxy-amphetamine (MDA), 3,4-methylenedioxy-methamphetamine (MDMA), and 3,4-methylenedioxy-ethylamphetamine (MDEA) in military entrance processing stations (MEPS) specimens. J Anal Toxicol. 2006;30:319–322. doi: 10.1093/jat/30.5.319. [DOI] [PubMed] [Google Scholar]
- 30.Takayasu T, Ohshima T, Nishigami J, Kondo T, Nagaon T T. Screening and determination of methamphetamine and amphetamine in the blood, urine and stomach contents in emergency medical care and autopsy cases. J Clin Forensic Med. 1995;2:25–33. doi: 10.1016/1353-1131(95)90036-5. [DOI] [PubMed] [Google Scholar]
- 31.Schepers RJF, Oyler JM, Joseph RE, Cone EJ, Moolchan ET, Huestis MA. Methamphetamine and amphetamine pharmacokinetics in oral fluid and plasma after controlled oral methamphetamine administration to human volunteers. Clin Chem. 2003;49:121–132. doi: 10.1373/49.1.121. [DOI] [PubMed] [Google Scholar]
- 32.Secchiero P, Zella D, Curreli S, Mirandola P, Capitani S, Gallo RC, Zauli G. Engagement of CD28 modulates CXC chemokine receptor 4 surface expression in both resting and CD3-stimulated CD4+ T cells. J Immunol. 2000;164:4018–4024. doi: 10.4049/jimmunol.164.8.4018. [DOI] [PubMed] [Google Scholar]
- 33.Chomczynski P, Sacchi N. Single-step method of RNA isolation by acid guanidinium thiocyanate-phenol-chloroform extraction. Anal Biochem. 1987;162:156–159. doi: 10.1006/abio.1987.9999. [DOI] [PubMed] [Google Scholar]
- 34.Shively L, Chang L, LeBon JM, Liu Q, Riggs AD, Singer-Sam J. Real-time PCR assay for quantitative mismatch detection. Biotechniques. 2003;34:498–502. doi: 10.2144/03343st01. [DOI] [PubMed] [Google Scholar]
- 35.Mahajan S, Schwartz S, Nair MP. Immunological assays for chemokine detection in vitro culture of CNS cells. Biol Proced Online. 2003;5:90–102. doi: 10.1251/bpo50. [DOI] [PMC free article] [PubMed] [Google Scholar]
- 36.http://www1.amershambiosciences.com/aptrix/upp00919.nsf/Content/Proteomics+DI GE +Protocols.
- 37.Tonge R, Shaw J, Middleton B, Rowlinson R, Rayner S, Young J, Pognan F, Hawkins E, Currie I, Davison M. Validation and development of fluorescence two-dimensional differential gel electrophoresis proteomics technology. Proteomics. 2001:377–396. doi: 10.1002/1615-9861(200103)1:3<377::AID-PROT377>3.0.CO;2-6. [DOI] [PubMed] [Google Scholar]
- 38.Lilley KS, Friedman DB. All about DIGE: quantification technology for differential-display 2D-gel proteomics. Expert Rev Proteomics. 2004;1:401–409. doi: 10.1586/14789450.1.4.401. [DOI] [PubMed] [Google Scholar]
- 39.Wessel D, Flugge UI. Method for the quantitative recovery of protein in dilute solution in the presence of detergents and lipids. Anal Biochem. 1984;138:141–143. doi: 10.1016/0003-2697(84)90782-6. [DOI] [PubMed] [Google Scholar]
- 40.Breci L, Hattrup E, Keeler M, Letarte J, Johnson R, Haynes PA. Comprehensive proteomics in yeast using chromatographic fractionation, gas phase fractionation, protein gel electrophoresis, and isoelectric focusing. Proteomics. 2005;5:2018–2028. doi: 10.1002/pmic.200401103. [DOI] [PubMed] [Google Scholar]
- 41.Gharahdaghi F, Weinberg CR, Meagher DA, Imai BS, Mische SM. Mass spectrometric identification of proteins from silver-stained polyacrylamide gel: a method for the removal of silver ions to enhance sensitivity. Electrophoresis. 1999;20:601–605. doi: 10.1002/(SICI)1522-2683(19990301)20:3<601::AID-ELPS601>3.0.CO;2-6. [DOI] [PubMed] [Google Scholar]
- 42.Cooper B, Eckert D, Andon NL, Yates JR, Haynes PA. Investigative proteomics: identification of an unknown plant virus from infected plants using mass spectrometry. J Am Soc Mass Spectrom. 2003;14:736–741. doi: 10.1016/S1044-0305(03)00125-9. [DOI] [PubMed] [Google Scholar]
- 43.Wilm MA, Shevchenko A, Houthaeve T, Breit S, Schweigerer L, Fotsis T, Mann M. Femtomole sequencing of proteins from polyacrylamide gels by nano-electrospray mass spectrometry. Nature. 1996;379:466–469. doi: 10.1038/379466a0. [DOI] [PubMed] [Google Scholar]
- 44.Haynes PA, Gygi SP, Figeys D, Aebersold R. Proteome analysis: biological assay or data archive? Electrophoresis. 1998;19:1862–1871. doi: 10.1002/elps.1150191104. [DOI] [PubMed] [Google Scholar]
- 45.Andon NL, Hollingworth S, Koller A, Greenland AJ, Yates JR, Haynes PA. Proteomic characterization of wheat amyloplasts using identification of proteins by tandem mass spectrometry. Proteomics. 2002;2:1156–1168. doi: 10.1002/1615-9861(200209)2:9<1156::AID-PROT1156>3.0.CO;2-4. [DOI] [PubMed] [Google Scholar]
- 46.Ellis RJ, Childers ME, Cherner M, Lazzaretto D, Letendre S, Grant I. Increased human immunodeficiency virus loads in active methamphetamine users are explained by reduced effectiveness of antiretroviral therapy. J Infect Dis. 2003;188:1820–1826. doi: 10.1086/379894. [DOI] [PubMed] [Google Scholar]
- 47.Bagasra O, Pomerantz RJ. Human immunodeficiency virus type 1 replication in peripheral blood mononuclear cells in the presence of cocaine. J Infect Dis. 1993;168:1157–1164. doi: 10.1093/infdis/168.5.1157. [DOI] [PubMed] [Google Scholar]
- 48.Gekker G, Hu S, Wentland MP, Bidlack JM, Lokensgard JR, Peterson PK. Kappa-opioid receptor ligands inhibit cocaine-induced HIV-1 expression in microglial cells. J Pharmacol Exp Ther. 2004;309:600–606. doi: 10.1124/jpet.103.060160. [DOI] [PubMed] [Google Scholar]
- 49.Peterson PK, Gekker G, Chao CC, Schut R, Molitor TW, Balfour HH., Jr Cocaine potentiates HIV-1 replication in human peripheral blood mononuclear cell cocultures. Involvement of transforming growth factor-beta. J Immunol. 1991;146:81–84. [PubMed] [Google Scholar]
- 50.Peterson PK, Gekker G, Chao CC, Schut R, Verhoef J, Edelman CK, Erice A, Balfour HH., Jr Cocaine amplifies HIV-1 replication in cytomegalovirus-stimulated peripheral blood mononuclear cell cocultures. J Immunol. 1992;149:676–680. [PubMed] [Google Scholar]
- 51.Peterson PK, Gekker G, Schut R, Hu S, Balfour HH, Jr, Chao CC. Enhancement of HIV-1 replication by opiates and cocaine: the cytokine connection. Adv Exp Med Biol. 1993;335:181–188. doi: 10.1007/978-1-4615-2980-4_26. [DOI] [PubMed] [Google Scholar]
- 52.Gavrilin MA, Mathes LE, Podell M. Methamphetamine enhances cell-associated feline immunodeficiency virus replication in astrocytes. J Neurovirol. 2002;8:240–249. doi: 10.1080/13550280290049660. [DOI] [PubMed] [Google Scholar]
- 53.Bobkov AF, Selimova LM, Khanina TA, Zverev SY, Pokrovsky VV, Weber JN, Bobkov EN, Rylkov AV. Human immunodeficiency virus type 1 in illicit-drug solutions used intravenously retains infectivity. J Clin Microbiol. 2005;43:1937–1939. doi: 10.1128/JCM.43.4.1937-1939.2005. [DOI] [PMC free article] [PubMed] [Google Scholar]
- 54.Elola MT, Chiesa ME, Alberti AF, Mordoh J, Fink NE. Galectin-1 receptors in different cell types. J Biomed Sci. 2005;12:13–29. doi: 10.1007/s11373-004-8169-5. [DOI] [PubMed] [Google Scholar]
- 55.Almkvist J, Karlsson A. Galectins as inflammatory mediators. Glycoconj J. 2004;19:575–581. doi: 10.1023/B:GLYC.0000014088.21242.e0. [DOI] [PubMed] [Google Scholar]
- 56.Scott K, Weinberg C. Galectin-1: a bifunctional regulator of cellular proliferation. Glycoconj J. 2004;1:467–477. doi: 10.1023/B:GLYC.0000014076.43288.89. [DOI] [PubMed] [Google Scholar]
- 57.Ouellet M, Mercier S, Pelletier I, Bounou S, Roy J, Hirabayashi J, Sato MJ S. Galectin-1 acts as a soluble host factor that promotes HIV-1 infectivity through stabilization of virus attachment to host cells. J Immunol. 2005;174:4120–4126. doi: 10.4049/jimmunol.174.7.4120. [DOI] [PubMed] [Google Scholar]
- 58.Ryser HJ, Fluckiger R. Progress in targeting HIV-1 entry, Drug Discov. Today. 2005;10:1085–1094. doi: 10.1016/S1359-6446(05)03550-6. [DOI] [PubMed] [Google Scholar]
- 59.Ryser HJ, Levy EM, Mandel R, DiSciullo GJ. Inhibition of human immunodeficiency virus infection by agents that interfere with thiol-disulfide interchange upon virus-receptor interaction. Proc Natl Acad Sci U S A. 1994;91:4559–4563. doi: 10.1073/pnas.91.10.4559. [DOI] [PMC free article] [PubMed] [Google Scholar]
- 60.Barouche R, Lortat-Jacob H, Jones IM, Fenouillet E. Glycosaminoglycans and protein disulfide isomerase-mediated reduction of HIV Env. Mol Pharmacol. 2005;67:1111–1118. doi: 10.1124/mol.104.008276. [DOI] [PubMed] [Google Scholar]
- 61.Markovic I, Stantchev TS, Fields KH, Tiffany LJ, Tomic M, Weiss CD, Broder CC, Strebel K, Clouse KA. Thiol/disulfide exchange is a prerequisite for CXCR4-tropic HIV-1 envelope-mediated T-cell fusion during viral entry. Blood. 2004;103:1586–1594. doi: 10.1182/blood-2003-05-1390. [DOI] [PubMed] [Google Scholar]
- 62.Gallina A, Hanley TM, Mandel R, Trahey M, Broder CC, Viglianti GA, Ryser HJ. Inhibitors of protein-disulfide isomerase prevent cleavage of disulfide bonds in receptor-bound glycoprotein 120 and prevent HIV-1 entry. J Biol Chem. 2002;277:50579–50588. doi: 10.1074/jbc.M204547200. [DOI] [PubMed] [Google Scholar]
- 63.Fenouillet E, Barbouche R, Courageot J, Miquelis R. The catalytic activity of protein disulfide isomerase is involved in human immunodeficiency virus envelope-mediated membrane fusion after CD4 cell binding. J Infect Dis. 2001;183:744–752. doi: 10.1086/318823. [DOI] [PubMed] [Google Scholar]
- 64.Jolly C, Kashefi K, Hollinshead M, Sattentau QJ. HIV-1 cell to cell transfer across an Env-induced, actin-dependent synapse. J Exp Med. 2004:283–293. doi: 10.1084/jem.20030648. [DOI] [PMC free article] [PubMed] [Google Scholar]
- 65.Feng Y, Walsh CA. The many faces of filamin: a versatile molecular scaffold for cell motility and signaling. Nat Cell Biol. 2004;6:1034–1038. doi: 10.1038/ncb1104-1034. [DOI] [PubMed] [Google Scholar]
- 66.Tadokoro S, Shattil SJ, Eto K, Tai V, Liddington RC, de Pereda JM, Ginsberg MH, Calderwood DA. Talin binding to integrin beta tails: a final common step in integrin activation. Science. 2003;302:103–6. doi: 10.1126/science.1086652. [DOI] [PubMed] [Google Scholar]
- 67.Rhee SG, Chae HZ, Kim K. Peroxiredoxins: a historical overview and speculative preview of novel mechanisms and emerging concepts in cell signaling. Free Radic Biol Med. 2005;38:1543–1552. doi: 10.1016/j.freeradbiomed.2005.02.026. [DOI] [PubMed] [Google Scholar]
- 68.Geiben-Lynn R, Kursar M, Brown NV, Addo MM, Shau H, Lieberman J, Luster AD, Walker BD. HIV-1 antiviral activity of recombinant natural killer cell enhancing factors, NKEF-A and NKEF-B, members of the peroxiredoxin family. J Biol Chem. 2003;278:1569–1574. doi: 10.1074/jbc.M209964200. [DOI] [PubMed] [Google Scholar]
Associated Data
This section collects any data citations, data availability statements, or supplementary materials included in this article.