
Figure 5.
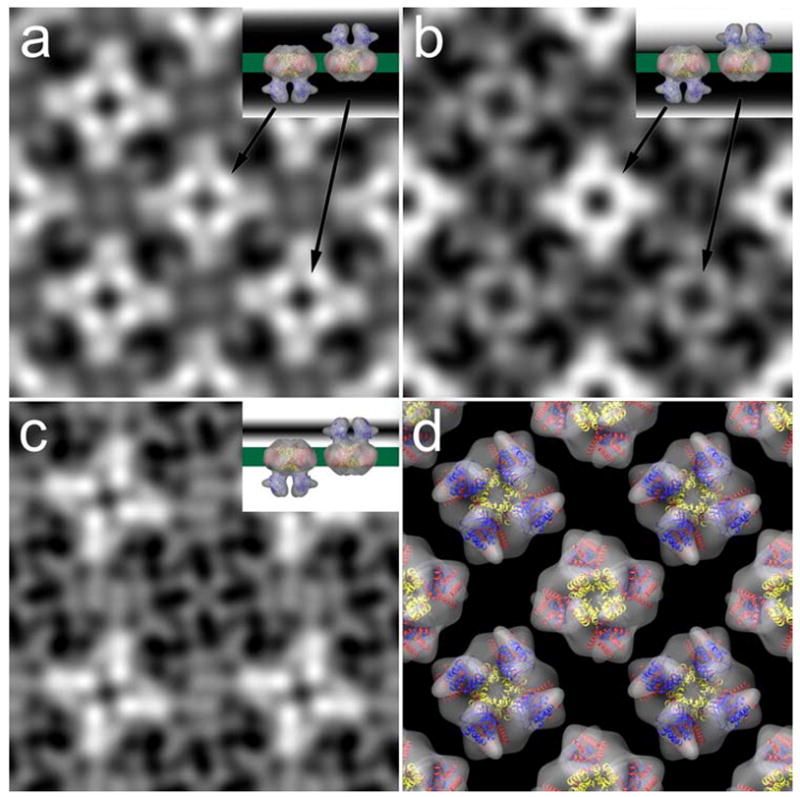
Projection maps of evenly (a) and unevenly (b) stained 2d crystals of MloK1 after image processing. A difference map (c) between the two shows the contours of one surface only. Insets in (a) to (c) are cartoons that depict the staining level. (d) Arrangement of the single particle reconstruction in the 2d crystal-like alternative orientations with overlaid X-ray structures of Kv1.2 (S1-S4, red; S5-S6, yellow) and MloK1 CNBD (blue).