
Figure 6.
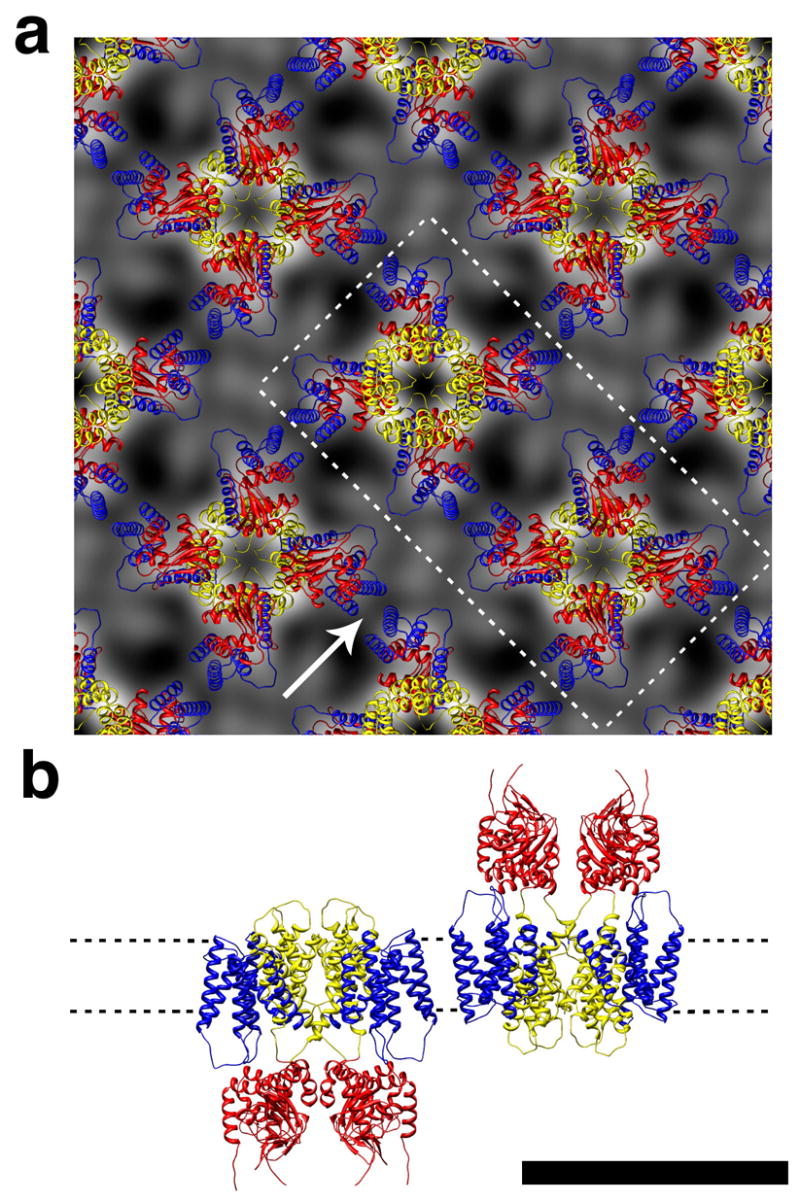
The homology model with “vertically” oriented paddles fit to the 2D crystal projection map. (a) 2×2 unit cell arrangement. Protein is in white. (b) Side view of the two tetramers that are in (a) indicated by the dotted line and seen as indicated by the arrow. Scale bar 10 nm. S1-S4 helices, blue; S5-S6, yellow, CNBD, red.