

Abstract
We propose that double transgenic thy1-CFP(23)/S100-GFP mice whose Schwann cells constitutively express green fluorescent protein (GFP) and axons express cyan fluorescent protein (CFP) can be used to serially evaluate the temporal relationship between nerve regeneration and Schwann cell migration through acellular nerve grafts. Thy1-CFP(23)/S100-GFP and S100-GFP mice received non-fluorescing cold preserved nerve allografts from immunologically disparate donors. In vivo fluorescent imaging of these grafts was then performed at multiple points. The transected sciatic nerve was reconstructed with a 1 cm nerve allograft harvested from a Balb-C mouse and acellularized via 7 weeks of cold preservation prior to transplantation. The presence of regenerated axons and migrating Schwann cells was confirmed with confocal and electron microscopy on fixed tissue. Schwann cells migrated into the acellular graft (163 ± 15 intensity units) from both proximal and distal stumps, and bridged the whole graft within 10 days (388 ± 107 intensity units in the central 4-6 mm segment). Nerve regeneration lagged behind Schwann cell migration with 5 or 6 axons imaged traversing the proximal 4 mm of the graft under confocal microcopy within 10 days, and up to 21 labeled axons crossing the distal coaptation site by 15 days. Corroborative electron and light microscopy 5 mm into the graft demonstrated relatively narrow diameter myelinated (431±31) and unmyelinated (64±9) axons by 28 but not 10 days. Live imaging of the double-transgenic thy1-CFP(23)/S100-GFP murine line enabled serial assessment of Schwann cell-axonal relationships in traumatic nerve injuries reconstructed with acellular nerve allografts.
Keywords: transgenic mouse, nerve allograft, nerve regeneration, Schwann cell migration, cold preservation, live imaging
Introduction
Static imaging, the mainstay for evaluating regenerating nerves after traumatic injury is limited by its inefficiency and inability to capture the dynamism of nerve regeneration and Schwann cell (SC) migration. Static imaging modalities including light or electron microscopy, immunohistochemistry, and retrograde labeling are resource intensive since they mandate the sacrifice of numerous experimental animals at multiple time points to characterize regeneration. Due to discrepant processing techniques, the application of one technique often precludes the use of the other techniques on the same specimen further increasing the number of experimental animals required to obtain quantitative data (Myckatyn, et al., 2004). Further, none of these techniques, in isolation, sufficiently evaluates all of the parameters of regeneration such as rate, pathway sampling, and discrimination of motor versus sensory axons (Redett, et al., 2005, Witzel, et al., 2005). Characterization of regeneration following traumatic nerve injury in experimental models requires a technique capable of quantifying regenerating axons and migrating SCs over time in the same mouse to complement, if not replace, existing static imaging techniques.
Axons and SCs constitutively expressing a fluorescent reporter are key to an evolving methodology designed to track migratory and regenerative processes over time. Recent advances in molecular neurobiology provide us with transgenic mice expressing genes encoding fluorescent proteins under neuron-specific or SC-specific promoters. Thy1-CFP(23) mice, previously used to study axonal retraction in developing and maturing motor endplates express cyan fluorescent protein (CFP) in all motor, and many sensory axons (Feng, et al., 2000, Walsh and Lichtman, 2003). S100-GFP mice are distinguished by SCs that are labeled with green fluorescent protein (GFP) under the control of transcriptional regulatory sequences of the human S100B gene (Zuo, et al., 2004). A double transgenic thy1-CFP(23)/S100-GFP line is referred to in an article reviewing the behavior of terminal SCs (Kang, et al., 2003), but this work is not intended to evaluate regeneration through nerve grafts following traumatic injury. The relationships between SCs and axons during nerve regeneration are of particular interest to clinicians that reconstruct traumatic nerve injuries with grafts.
To advance the study of nerve regeneration and SC-axonal relationships, new models enabling longitudinal imaging of SCs and axons both within the nerve fiber and at the neuromuscular junction are needed. We previously report that mice expressing enhanced yellow fluorescent protein in their axons (hThy1-EYFP) can be serially imaged after traumatic nerve injury but do not provide methods for quantifying regeneration, or use confocal microscopy, and do not simultaneously image SC migration (Myckatyn, et al., 2004). In this paper we compare the rates of SC migration and axonal regeneration into cold preserved, acellular allografts used to reconstruct a sciatic nerve transection injury in live thy1-CFP(23)/S100-GFP transgenic mice. We hypothesize that the thy1-CFP(23)/S100-GFP murine model can be used for serial, quantitative analysis of SC migration and axonal regeneration to study injured nerves repaired with acellularized nerve grafts.
Material and Methods
Transgenic mice
Heterozygous thy1-CFP(23) mice (Jackson, ME) were bred to homozygous S100-GFP mice (“Kosmos” line: gift from Dr. W. Thompson, Austin, TX now commercially available through Jackson, ME). All SCs were diffusely labeled with GFP and the axons of 50% of the progeny were also labeled with CFP. We confirmed integration of the GFP transgene in the S100-GFP line visually by GFP expression in retinal glial cells and cutaneous Langerhans cells (Zuo, et al., 2004). CFP transgene incorporation was confirmed in this heterozygous line using quantitative PCR on DNA extracts from mouse tail using the CFP primers provided by Jackson (forward, CTAGGCCACAGAATTGAAAGATCT- ; reverse , GTAGGTGGAAATTCTAGCATCATCC). The mice were maintained in a central animal housing facility, and all described procedures were performed according to protocols approved by the Division of Comparative Medicine at the Washington University School of Medicine.
Cold preservation of nerve allografts
SC migration and axonal regeneration was studied in interposed, 7 weeks cold preserved allografts, which are immunologically inert (Fox, et al., 2005) and devoid of fluorescing cellular material (Myckatyn, et al., 2004). Aliquots of University of Wisconsin solution (15 ml; NPBI International BV, Emmer Compascuum, The Netherlands) with penicillin G (200,000 U/L), regular insulin (40 U/L), and dexamethasone (16 mg/L) were dispensed into sterile petri dishes. 1.5 cm sciatic nerves from Balb/C mice were transferred into solution directly after harvest and maintained at 4°C for 7 weeks to eliminate any viable antigenic cells (Fox, et al., 2005).
Surgical procedure
The eighteen mice used for this experiment included thy1-CFP(23)/S100-GFP (n=4) and S-100 GFP (n=8) transgenic mice which received nerve allografts and Balb/C mice (n=6) that donated allografts. Animals were anesthetized with a subcutaneous injection of ketamine (75 mg/kg) and medetomidine (100 mg/kg). A skin incision was made parallel and 2 mm posterior to the femur and the sciatic nerve exposed with microsurgical technique to include the sciatic notch proximally and its trifurcation to tibial, peroneal, and sural nerves distally. The sciatic nerve was transected and a 1.0 cm cold preserved nerve allograft from a Balb/C mouse interposed between the transected ends in a reversed orientation with 11-0 microsutures. Imaging was performed, muscle and skin closed in layers with 6-0 and 8-0 nylon sutures (Ethicon, NJ) and mice recovered with Antisedan (Novartis, Canada) on a warming pad.
Live imaging
We serially imaged the nerve grafts at the time of surgery, and 5, 10, 15, and 28 days later using a fluorescence-enabled dissecting microscope (Nikon SMZ 1500 with Applied Scientific Instrumentation Z-stage) (Myckatyn, et al., 2004). To facilitate live imaging, mice were re-anesthetized and the grafted sciatic nerve re-exposed and imaged with the fluorescent dissecting microscope. Images were recorded with a CoolSNAP-ES cooled CCD camera (Photometrics, Tucson, AZ) utilizing MetaMorph version 6.2 (Universal Imaging Corporation, Downingtown, PA) image acquisition software. Specimens were evaluated under GFP (488 nm: SCs) and CFP (450nm: axons) fluorescent cubes, and imaged with a monochromatic CCD and MetaMorph. Images were initially standardized in terms of magnification (40x), exposure time (200 ms), and orientation. The relationship between exposure time and image fluorescent intensity was also standardized to Evicomposite (Evident Technologies, Troy, NY), polymer resin embedded with quantum dots (EviDots) that emitted stable nanocrystalline fluorescence at a wavelength of 493nm.
GFP and CFP fluorescent intensity along the length of the nerve graft was quantified using the “line scanning” technique described below. Following image acquisition, the wound was irrigated with saline, closed with 8–0 nylon in muscle and 6–0 nylon in skin and animals recovered.
Line scanning
A line was drawn to bisect the digitized, 12-bit, monochromatic image of the host nerve and interposed graft thus enabling us to plot distance along the scanning line on the x-axis and the assigned grey-scale value corresponding to fluorescent intensity (0-4095 units) on the y-axis (Fig. 1A-E). Callibrated images of the 1 cm nerve graft were subdivided into five distinct 2 mm segments and mean pixel intensity for GFP fluorescence calculated and plotted against the region of the graft represented by the x-axis (Fig. 1E). This provided a relative assessment of the extent of GFP- labeled SC migration.
Fig 1.
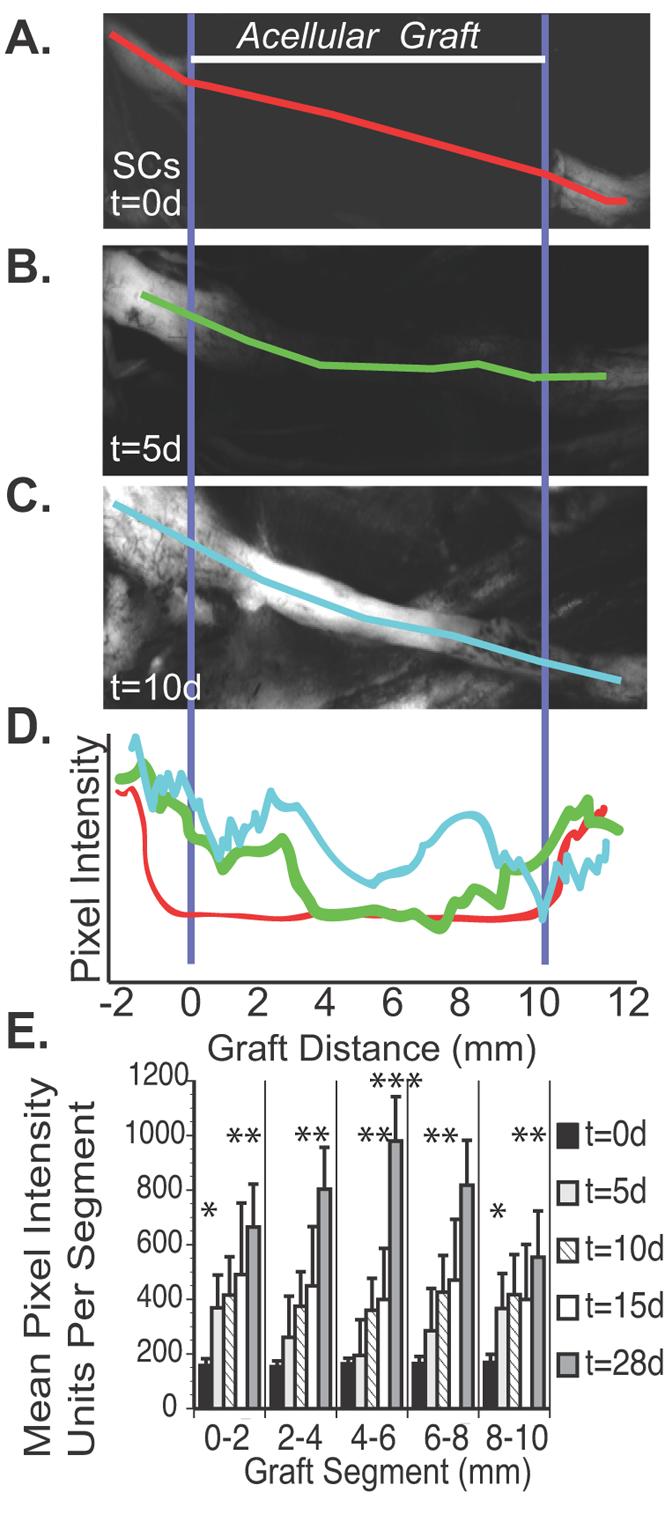
A. Representative sample of a 7 week cold preserved nerve allograft from a non-fluorescing Balb/C mouse transplanted into an S100-GFP mouse (n=8). Initially (t=0), there was no fluorescent emission within the graft, and it appeared black with low pixel intensity as noted by the red line scan. B. Five days later, fluorescent intensity had increased in the proximal and distal graft relative to the graft center represented by the green line. C. By 10 days, fluorescent intensity was noted throughout the graft as measured by the light blue line. D. A representative graph which quantifies fluorescent intensity for this particular mouse at t=0 days (red), t=5 days (green) and t=10 days (light blue) along the 10 mm long graft. A5. Twelve bit digitized images of the cold preserved nerve grafts are then divided into 2 mm segments and mean pixel intensity (0-4095) from these segments calculated up to 28 days post-engraftment. * The proximal and distal edges of the graft are significantly brighter 5 days after engraftment (p<0.05). ** At 28 days, all graft segments are significantly brighter than at 15 days (p<0.05). *** At 28 days, the central segment of the graft is significantly brighter than the graft edges (p<0.01).
Non-biased stereology and morphometric evaluation of electron microscopy
Nerves were harvested 10 and 28 days following engraftment and embedded in Araldite 502 resin to evaluate the density of reinnervating myelinated and unmyelinated fibers. The mid-graft, 5 mm from the suture line was evaluated in 10 and 28 day old grafts. 90 nm sections of nerve grafts were then sectioned with an LKB III microtome and stained with uranyl acetate and lead citrate. For each time point, 15 ultramicrographs were taken with a Zeiss 902 electron microscope (Zeiss Instruments, Chicago, IL) at 4360x magnification, scanned at 400 dots per inch resolution (Epson Perfection 4870 scanner) and evaluated with MicroBright Field Stereo Investigator software (MBF Bioscience StereoInvestigator version 7.0, Williston, Vermont). Using the fractionator technique, a four ray 2D vertical nucleator probe was used to evaluate the number and area of unmyelinated axons in the scanned micrographs. The sampling frame grid, calculated by the software to avoid sampling error, was set to 80 μm2. Axon area (a = πl2), where a was the area estimation and l was the length of intercept (Gundersen, 1988), and diameter (d = 2l) were calculated. Binary image analysis of the same electron micrographs using IA32 software (Leco, St. Joseph, Michigan) was used to calculate the total number of myelinated fibers and their areas and widths as previously described (Brenner, et al., 2004). Stereologic and morphometric data was then imported to Prism (Version 4.0, GraphPad Software Inc.) to calculate frequency distribution while statistical analysis was performed in Statistica Version 7.1 (StatSoft). A Student-Newman-Keuls test was performed post-hoc following a one-way analysis of variance on image intensity of the graft segments at the various time points.
Immunohistochemistry
Upon sacrifice, mice were anesthetized, and perfused transcardially with heparinized 0.01 M phosphate buffered solution (PBS) followed by 4% paraformaldehyde in 0.1 M PBS. The allografts and the tibialis anterior and extensor digitorum longus muscles were harvested and postfixed for one hour. Nerve allografts designated for sectioning were frozen in OCT compound at −80 °C while the remaining nerve and muscle specimens were evaluated as whole mounts. Sections were blocked with 5% normal goat serum and diluted with 0.3% Triton-X in PBS for one hour. To confirm the phenotype of GFP-expressing cells, SCs were co-labeled with rabbit polyclonal anti-S100 antibody diluted 1: 100 (DAKO, Carpinteria, CA) and macrophages labeled with rat monoclonal anti-F4/80 antibody diluted 1: 100 (Serotec, Oxford, UK). The specimens were incubated overnight at 4°C. Secondary antibodies were diluted 1:500 and included Cy3-conjugated goat anti-rabbit antibody diluted for S100 and Cy3-conjugated donkey anti-rat antibody diluted for F4/80 labeled-macrophages (Jackson ImmunoResearch, West Grove, PA). To label muscle fiber motor endplates, whole mounts of tibialis anterior were soaked for 30 minutes in a solution containing Alexa 594 conjugated to alpha-bungarotoxin (BTX; Molecular Probes, Eugene, OR) at a 1:100 dilution.
Sectioned nerves and muscle whole mounts were evaluated with a spectral scanning laser confocal microscope and FV10-ASW software (Fluo View FV1000, Olympus Corporation, Japan). Confocal images were standardized in terms of sensitivity of the photomultiplier tube, laser voltage, and gain. To distinguish CFP fluorescence from GFP fluorescence, lambda scanning, performed by modulating the slit in front of the diffraction grating in front of the photomultiplier tube was performed. Fluorescent emissions were detected over a 5 nm wavelength range in 2 nm incremental steps through an overall emission range of 465 nm to 580 nm. Emission profiles for CFP and GFP were then plotted and a spectral deconvolution algorithm using FV10-ASW software employed to differentiate these fluorophores and assign different channels to them.
Digital unmixing of Schwann cells from macrophages
The S100-GFP line was chosen because SCs are nearly exclusively labeled in nerve tissue relative to other reported founder lines where a far greater percentage of macrophages are also labeled (Zuo, et al., 2004). To further distinguish SCs from macrophages, calibrated confocal images saved in greyscale format were assessed using Leco IA32 software. The few macrophages that expressed GFP had a hypodense cytoplasm and sponge-like morphology and were co-labeled with anti-F4/80 antibody. These cells were digitally isolated and assigned a distinct bit-plane. Thresholding was then applied to numerous images using a pixel density of 36 (0-255 scale), which was specific to all SCs but not macrophages. A Boolean logic was then applied to these SCs to eliminate macrophages. The remaining isolated SCs were then assigned a second distinct bitplane and maintenance of their distinct spindle-shaped morphology confirmed. Area and density measurements were then performed on the bitplanes assigned to SCs and macrophages (Brenner, et al., 2004, Nichols, et al., 2004).
Results
In Vivo Imaging of Schwann Cell Migration and Axonal Regeneration
By direct observation, the nerve grafts appeared black, with no GFP expression by SCs (Fig. 1A) or CFP expression by axons at the time of engraftment. Significant changes in fluorescent intensity, however, were noted over the following 10 days (Fig. 1B-E). Background fluorescence was measured at 158 ±23 intensity units with minimal variation along the graft (Fig. 1E). Five days later, 1-2 mm of SC migration was noted infiltrating the proximal and distal graft (Fig. 2A) and axons had regenerated along the proximal 1-2 mm of the graft. CFP-expression was attenuated distal to the graft consistent with Wallerian degeneration (Fig. 2B). GFP expression continued to increase throughout the graft from 5 to 10 days (Fig. 2C). Analysis of z-series image stacks was necessary to identify 2 or 3 axons regenerating along the surface of the proximal 4, but not 5 mm of the graft within 10 days of surgery (Fig. 2D). GFP expression became progressively brighter 15 days after surgery (Fig. 1E and Fig. 2E), and at least 5 axons traversed the entire graft surface by 15 days when image stacks were analyzed (Fig. 2F). GFP expression was most intense in the central graft (4-6 mm segment) 28 days after surgery (Fig. 1E). The central segment (4-6 mm) was significantly brighter (991±153 units) than the proximal (0-2 mm; 681±173) and the distal (8-10 mm; 571±185) segments at the 28 day time point (p<0.01), and all segments at the 28 day time point were significantly brighter than the preceding (15 day) time point (p<0.05). By serial fluorescent imaging, it was clear that SCs repopulated the 1 cm cold preserved allografts more rapidly than the majority of axons did.
Fig 2.
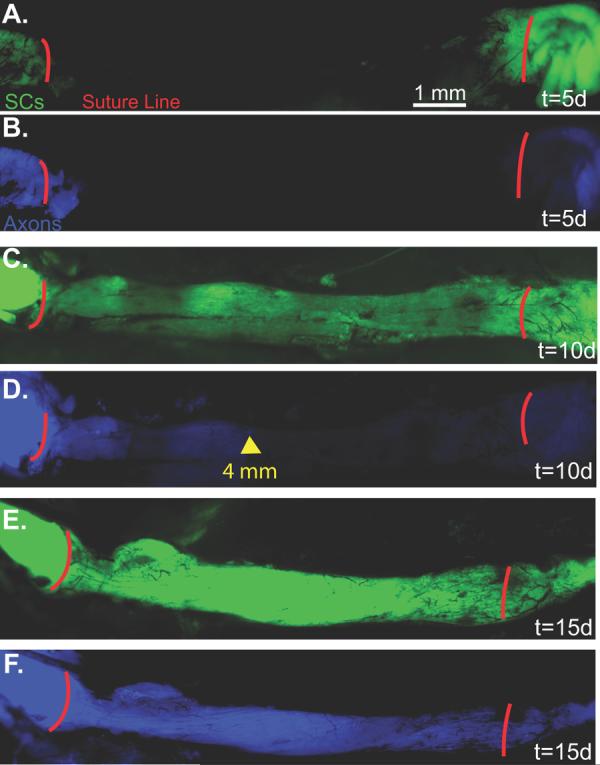
A. Live image 5 days post-engraftment with SCs pseudocolored green. B. Axons are pseudocolored blue. C. Live image 10 days post-engraftment shows that GFP-labeled SCs are present throughout the graft. D. Axons have not yet reached the mid-graft level. The distal-most axons are marked by the yellow arrow at 4 mm. E. By 15 days, the graft demonstrates increased intensity and confluence of GFP-labeling. F. Axons have traversed the length of the graft (D2).
Confocal Imaging of Nerve Grafts and Neuromuscular Junctions
Some overlap between the emission profiles of CFP and GFP made it difficult to discriminate between axons and SCs with in vivo analysis alone. To corroborate and further quantify data obtained from live imaging we performed confocal and electron microscopy, non-biased stereology, and histomorphometry on perfused specimens. Confocal imaging confirmed minimal migration of GFP-labeled SCs 5 days post-engraftment (Fig. 3A), but within 10 days, migrating SCs traversed the entire 1 cm graft (Figs. 3B&C), becoming more confluent 15 days later (Figs. 3D&E). Axonal regeneration lagged behind SC migration. In some specimens, axons were noted crossing 1-2 mm past the proximal suture line at 5 days (Fig. 4A), and 5 or 6 axons traversed a maximum of 4 mm of the graft at 10 days (Fig. 2B). By 15 days, axons were noted in every segment of the nerve graft (Fig. 4C). A large number of axons, too densely clustered to count in a longitudinal orientation were noted in the proximal graft (Fig. 4D), and the mid-graft was also densely populated (Fig. 4E). In the distal graft, individual axons could be discriminated and up to 21 axons approached (Fig. 4F) and traversed (Fig. 4G) the distal suture line. Significant Wallerian degeneration, characterized by the presence of ovoid bodies(Feng, et al., 2000, Pan, et al., 2003), were still present in the injured nerve distal to the graft 15 days after surgery (Fig. 4G).
Fig 3.

A. Confocal microscopy was performed on additional fixed specimens (n=4) to provide higher resolution and confirm findings performed with live fluorescent microscopy. Five days post-engraftment, very few SCs cross the sutured proximal coaptation marked in red. B. By 10 days, SCs are noted throughout the graft as shown in this montage. C. A magnified view at 10 days suggests robust SC proliferation at the proximal coaptation site. D. By 15 days SC distribution is more uniform in both the proximal component of the graft, E. and in the mid-graft.
Fig 4.
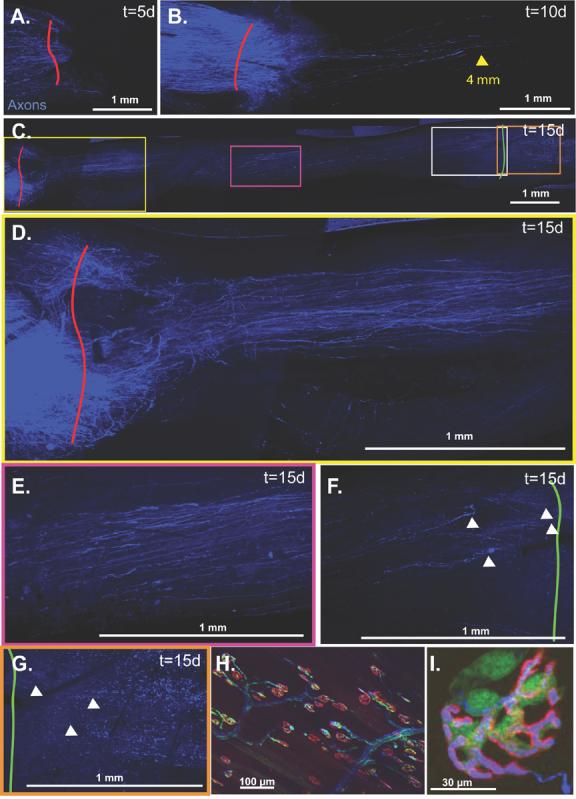
A. Minimal nerve regeneration is noted at 5 days. B. Axons have traveled up to 4 mm into the graft by 10 days. C. Axons have traversed the graft by 15 days with progressively fewer axons noted from proximally to distally as demonstrated in the following magnified panels. D. Regeneration through the proximal graft. E. Regeneration at the mid-graft level. F. Regeneration through the distal graft. G. Regeneration past the distal graft suture line. Multiple ovoid bodies remain in the distal injured nerve signifying ongoing Wallerian degeneration. White arrowheads identify regenerating axons. H&I. To visualize the motor endplates of the tibialis anterior, the muscle must be everted thus precluding reliable serial imaging.
Confocal imaging of neuromuscular junctions in whole mounts of tibialis anterior and extensor digitorum longus muscles demonstrated our ability to simultaneously image SCs, axons, and motor endplates in fixed specimens. Each BTX-labeled motor endplate was associated with a single CFP-labeled axon (Fig. 4H&I). Terminal SCs assumed a rounder morphology than the spindle-shaped SCs associated with axons. There were 2-3 terminal SCs per motor endplate, and these were usually positioned opposite to where the CFP-labeled axons entered the synaptic cleft (Fig. 4I). Serial imaging of motor endplates in living mice did not provide useful data in this model since repeat exposures of the deep surface of the tibilais anterior muscle caused significant scar formation that impaired clear, reproducible imaging.
Histomorphometry and Non-Biased Stereologic Assessment of Nerve Cross Sections
Evaluation of cross sections through the center (5 mm) of the nerve graft confirmed the absence of unmyelinated and myelinated axons 10 days after surgery (Fig. 5A), but a few denervated SCs and degenerating myelin was noted (Fig. 5B). Robust regeneration through the center of the graft was confirmed 28 days after surgery (Fig. C-F). By 28 days, the mean number of unmyelinated axons per Remak bundle was 1.7 ± 0.4 with a range of 1 to 6 unmyelinated axons per SC. Unmyelinated (64±9) and myelinated axons (431±31) were noted. Myelinating SCs (Fig. 5C), were characterized by a double basement membrane basal lamina (Fig. 5D).. There was a tendency towards relatively small diameter unmyelinated axons as 82% were ≤2μm (Fig. 5E) and 90% of myelinated axons were ≤4 μm (Fig. 5F).
Fig 5.

A. Electron micrograph of central graft cross-section 10 days after surgery confirms the absence of viable axons although SCs (SC), migrating into the acellular allografts are noted. B. A magnified view of the inset from panel A. reveals degenerated myelin (DM) and no viable axons. C. By 28 days, both myelinated and unmyelinated axons are noted. D. By 28 days, however, intact, myelinated axons are noted and an intact basal lamina (BL), characterized by double basement membranes are seen in this magnified inset from panel C.. E. Quantification and stratification of unmyelinated axons according to width reveals a strong bias towards small diameter axons (82% ≤ 2 μm). F. Similarly, only 1% of axons were >5 μm in diameter 28 days after surgery.
Distinguishing Schwann cells from macrophages
At high magnification, multiple spindle-shaped host SCs were observed. To confirm their lineage, the constitutively labeled SCs were co-labeled with anti-S100 immunostaining (Fig. 6A&B). Most constitutively labeled SCs were double-labeled, but some GFP-labeled cells maintained a disparate sponge-like morphology with decreased fluorescent intensity, and were not co-labeled with S100 (Fig. 6C). These sponge-like cells were co-labeled with anti-F4/80 immunostaining, suggesting that they were macrophages or macrophages that had phagocytosed GFP-labeled host SCs (Fig. 6D).
Fig 6.

A1. Middle of a cold preserved nerve allograft 28 days after harvest, perfusion, and laser scanning confocal microscopy. In this view, only constitutive GFP expression is shown. SCs are long, and spindle-shaped. A2. To confirm presence of GFP-labeled SCs, anti-S100 antibody was applied to label the membranes of SCs shown here as magenta-labeled cells. A3. The presence of CFP-labeled axons is confirmed. A4. Merged figure confirms colocalization of constitutive GFP-expression and anti-S100 antibody marked with Cy3-conjugated secondary antibody to confirm that spindle-shaped forms are SCs. B. Magnified view confirms colocalization and demonstrates that axons are intimately associated with SCs. C1. Some of the GFP-labeled forms, however, are known to be macrophages and assume a sponge-like, rather than a spindle-shaped morphology. C2. Anti F4/80 labels the membranes of a few macrophages within the same specimen, and C3. Colocalization of constitutive GFP-expression and anti-F4/80 labeling confirms that sponge-like forms are macrophages. D. Some macrophages are only labeled with F4/80 (*)while others are colocalized with constitutive GFP expression (**).All scale bars 100 μm.
Macrophages represented 9.4 ± 5.5% of the constitutively labeled cells that had migrated into cold preserved nerve allografts, or 6.7 ± 1.1% of the field area (Fig. 7A-D). SCs represented the remaining GFP-labeled cells. Only the minority of macrophages were labeled with GFP since, by immunohistochemistry, many macrophages labeled with F4/80 were not constitutively labeled with GFP. Qualitatively, SCs were also considerably brighter than macrophages, and this was confirmed by calculating fluorescent intensity in regions of interest in macrophages and comparing this intensity to SCs (Fig. 7C). Specifically, macrophages were 31.1 ± 7.3% as bright as peripheral SCs.
Fig 7.
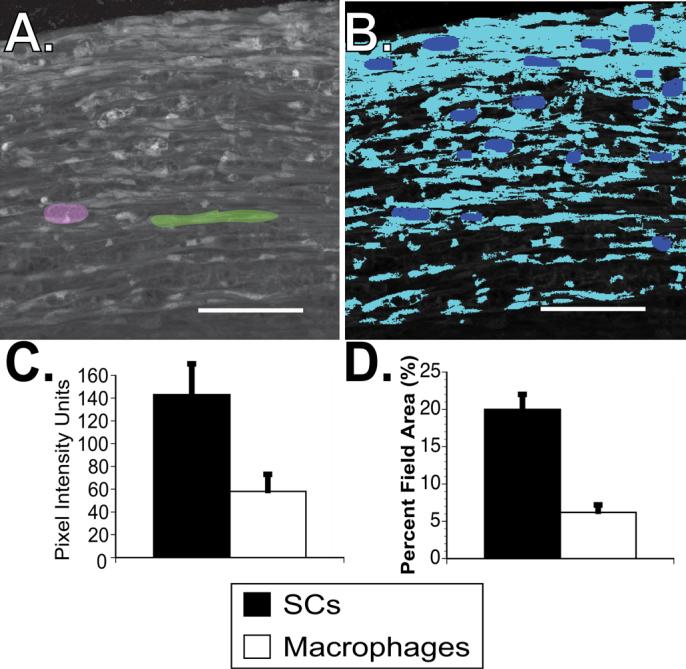
A. Digitized images obtained through confocal microscopy are imported into Leco metallurgical software. Based on morphology and confirmed through immunohistochemistry, the macrophages and SCs are independently isolated (single pink macrophage and green SC are identified here). B. These cell types are each assigned a bitplane and pseudocolor to enable digital isolation. Here, the macrophages are blue and SCs turquoise. C. The mean pixel intensity of macrophages and SCs are independently measured, and D., the percentage of the total viewed field occupied by SCs compared to macrophages calculated. SCs are more abundant and more strongly express GFP than macrophages. Scale bars 100 μm.
Discussion
Using previously described advances in live imaging and transgenic techniques, we present a novel method for the independent and serial study of SC migration and axonal regeneration in a surgically-relevant nerve graft model (Feng, et al., 2000, Nguyen, et al., 2002, Pan, et al., 2003). We indirectly monitored constitutively-labeled axons and SCs by evaluating the rate of change of fluorescent intensity over various components of the nerve graft. Moreover, the rate of regeneration was not uniform enabling us to distinguish and track the course of a few sentinel, rapidly regenerating axons that were not clearly identified proximally due to overlap with more slowly regenerating fibers. Freshly cold preserved, acellular nerve allografts were noted to have 163±15 units of background intensity based on a 0-4095 unit scale for 12-bit images. Ten days post-engraftment, 388±107 intensity units were noted in the central 4-6 mm segment of the nerve allograft when the GFP filter was applied, representing a significant (p<0.05) increase in SC-derived signal intensity. Signal intensity continued to increase significantly (p<0.05) along the entire graft up to the 28 day experimental endpoint. While SCs had bridged the 1 cm graft within 10 days, at the same time only a few axons had traversed the proximal 4 mm. By 15 days, up to 21 axons were noted by confocal microscopy to have crossed the distal neurorrhaphy site and were encountered by persistent Wallerian degeneration. While no axons were noted during cross-sectional assessment of myelinated and unmyelinated axons at the 5 mm mid-portion of the graft at 10 days, a few denervatd SCs were observed. By 28 days, 431 ± 31 myelinated and 64 ±9 unmyelinated axons were noted by morphometric assessment of midgraft cross-sections. These axons were still relatively immature as evidenced by a leftward shift towards small diameter unmyelinated and myelinated axons (Fig. 5E&5F) and relatively few axons per Remak bundle (1.7 ± 0.4, range: 1 to 6 axons/bundle) relative to uninjured sciatic nerves (Taveggia, et al., 2005).
Surgically reconstructed nerves present a number of unique challenges for live fluorescent imaging not encountered in developmental or crush injury models (Myckatyn, et al., 2004, Nguyen, et al., 2002, Walsh and Lichtman, 2003). In the mouse, only large nerves like the sciatic and its branches are amenable to surgical manipulation (Myckatyn and MacKinnon, 2004). The lower magnification required to image the entire sciatic nerve affords increased depth of field and shorter imaging times, but compromises resolution. Alternatively, highly magnified images require the generation of numerous z-stacks to accommodate depth of field and a narrower field of view that is complicated by motion artifact, desiccation of the nerve, and prolonged anesthesia (Myckatyn, et al., 2004).
It is unclear whether the processes associated with nerve regeneration after traumatic nerve injuries recapitulate those of developing nerves. During development, the axon-based ligand Type III Neuregulin-1 (NRG-1) binds ErbB family receptors to provide a critical maturation signal to neural crest cells (Garratt, et al., 2000, Jessen and Mirsky, 2005) that is also instrumental in SC proliferation, survival (Dong, et al., 1995), migration (Lyons, et al., 2005), and myelin regulation (Taveggia, et al., 2005) (Michailov, et al., 2004). Both intact and injured axons rely upon the paracrine trophic support afforded them by local SCs (Hayworth, et al., 2006, Mirsky, et al., 2002, Yin, et al., 2001, Zhu, et al., 2003), but following traumatic nerve injury, axons can traverse short distances through acellular synthetic conduits (Ahmed, et al., 2003, Hadlock, et al., 1998, Mosahebi, et al., 2003), vein grafts (Chiu and Strauch, 1990, Tseng, et al., 2003, Ulkur, et al., 2003, Weber and Mackinnon, 2005), and muscle tissue without clear evidence of SC support (Fornaro, et al., 2001, Varejao, et al., 2003). Moreover, denervated but mature SCs can survive for prolonged periods without axon-based signals before reinnervation occurs (Dedkov, et al., 2002, Sulaiman and Gordon, 2002, Sulaiman, et al., 2002). These observations suggest that alternative signaling programs or diffusible factors may support restoration of nerve regeneration and normal SC-axonal relationships following nerve injury (Snider, et al., 2002).
SCs traverse the graft within 10 days, migrating from both proximal and distal coaptation sites and within 28 days, GFP-expression is maximal in the central component of the graft. This finding is most likely due to the cumulative effect of both proximally and distally migrated SCs meeting in the center of the graft, thus creating an additive effect on GFP pixel intensity. By live imaging, an increased density of blood vessels, confirmed by real time visualization of transilluminated erythrocytes passing through the larger vascular arbors was also noted. This finding, most prominent at the proximal and distal graft coaptation sites but not the graft center 15 days after surgery, may have also been related to scar tissue in response to suture material and surgical microtrauma. Nerve grafts are affected by both an intrinsic blood supply originating from the vaso nervorum of the host nerve that preferentially revascularizes the graft edges as seen at the 15 day timepoint, as well as an extrinsic blood supply providing a more uniform distribution of blood supply to the entire graft (Best, et al., 1999, Best, et al., 1999, Breidenbach and Terzis, 1986, Hobson, 2002, Lundborg, 1988, Ozcan, et al., 1991, Seckel, et al., 1986, Terzis, et al., 1995). A modest inflammatory reaction related to surgical repair and the presence of suture material at both the proximal and distal coaptations also contributes to increased vascularity. Non-fluorescing blood vessels obscure underlying migrating SCs, causing a reduction in measured fluorescent emission and pixel intensity.
Several factors merit careful consideration in the analysis of our data. In Zuo et al.'s (2004) original description of S100-GFP mice, GFP was noted not only in SCs but also dendritic cells (Langerhan's cells), astrocytes, central microglia, and in lower levels in adipocytes (Zuo, et al., 2004). A few macrophages also expressed GFP in this line (Zuo, et al., 2004), although this finding was almost imperceptible in uninjured nerves. Macrophage recruitment is increased in traumatized nerves, and so we expected that there would be a concomitant increase in the absolute number of macrophages expressing GFP in our nerve graft reconstructions (Dailey, et al., 1998, Perry, et al., 1987, Reichert, et al., 1994). The in vivo imaging presented herein does not have sufficient resolution to distinguish macrophages from SCs morphologically. Therefore, we used immunohistochemistry and confocal microscopy on fixed specimens to determine what percentage of GFP expression came from contaminating macrophages instead of SCs. Based on bit-plane analysis, only 10% of the forms expressing GFP were shown to be macrophages, and were only 30% as bright as SCs, suggesting that ∼3% of the total fluorescent intensity was attributable to macrophages. Based on this quantitative analysis, we surmised that only a small (∼3%) percentage of the GFP intensity noted with live imaging was attributable to macrophages and that the remainder resulted from SC migration. Macrophages can be further distinguished from SCs based on staining characteristics and a sponge-like morphology that is clearly different from the spindle shape of SCs.
Other factors affect data acquisition in this model of SC migration and nerve regeneration. Serial imaging provides an indirect measure of axonal regeneration but relies upon assessment of fixed cross-sections to provide direct quantification. In addition to motion artifact, a number of factors affect the intensity of the image captured by the digital camera during live imaging. These parameters include background light, the setting of the camera, the region within the camera's field of view where the image is captured, the strength of the fluorescent light source, and degree of chromophore expression within the cells of interest. In order to account for these variables we now use Evicomposite Quantum Dot Composites to provide stable fluorescent emissions at 493 nm. Since the degree of emission is always constant from the quantum dot composite, we can standardize our imaging emission data under various imaging conditions, and over time, to this constant fluorescent output. Finally, endplate reinnervation cannot be serially assessed in the relatively large nerves of adult mice that are amenable to surgical manipulation. These muscles are innervated on their deep surface, and must be everted to facilitate imaging. This eversion disrupts normal muscle function and physiology and leads to excessive scar tissue that compromises the clarity of further imaging.
The thy1-CFP(23)/S100-GFP and GFP-S100 transgenic mouse lines are powerful tools for peripheral nerve research. They will prove to be useful tools for morphologically and quantitatively studying the behavior and relationships of SCs and axons particularly in vivo. The live imaging system continues to evolve, and quantitative methodologies that correlate with fixed specimens have now been established.
Acknowledgements
This work was funded by the C. James Carrico Faculty Research Fellowship (2005-2007) from the American College of Surgeons, and the John E. Hoopes Academic Scholar (2006-2008) from the American Association of Plastic Surgeons both awarded to Dr. Terence Myckatyn. It was also funded by RO1-NS033406-12 awarded to Dr. Mackinnon and RO1-NS042794 awarded to Dr.Alexander Parsadanian by the National Institutes of Health.
Footnotes
Publisher's Disclaimer: This is a PDF file of an unedited manuscript that has been accepted for publication. As a service to our customers we are providing this early version of the manuscript. The manuscript will undergo copyediting, typesetting, and review of the resulting proof before it is published in its final citable form. Please note that during the production process errors may be discovered which could affect the content, and all legal disclaimers that apply to the journal pertain.
References
- 1.Ahmed Z, Underwood S, Brown RA. Nerve guide material made from fibronectin: assessment of in vitro properties. Tissue Engineering. 2003 Apr;9(2):219–31. doi: 10.1089/107632703764664693. 2003. [DOI] [PubMed] [Google Scholar]
- 2.Best TJ, Mackinnon SE, Evans PJ, Hunter D, Midha R. Peripheral nerve revascularization: histomorphometric study of small- and large-caliber grafts. J Reconstr Microsurg. 1999;15:183–190. doi: 10.1055/s-2007-1000090. [DOI] [PubMed] [Google Scholar]
- 3.Best TJ, Mackinnon SE, Midha R, Hunter DA, Evans PJ. Revascularization of peripheral nerve autografts and allografts. Plastic and Reconstructive Surgery. 1999;104:152–160. [PubMed] [Google Scholar]
- 4.Breidenbach WC, Terzis JK. The blood supply of vascularized nerve grafts. J Reconstr Microsurg. 1986;3:43–58. doi: 10.1055/s-2007-1007038. [DOI] [PubMed] [Google Scholar]
- 5.Brenner MJ, Tung TH, Mackinnon SE, Myckatyn TM, Hunter DA, Mohanakumar T. Anti-CD40 ligand monoclonal antibody induces a permissive state, but not tolerance, for murine peripheral nerve allografts. Exp Neurol. 2004;186:59–69. doi: 10.1016/j.expneurol.2003.10.002. [DOI] [PubMed] [Google Scholar]
- 6.Chiu DT, Strauch B. A prospective clinical evaluation of autogenous vein grafts used as a nerve conduit for distal sensory nerve defects of 3 cm or less. Plast Reconstr Surg. 1990;86:928–934. doi: 10.1097/00006534-199011000-00015. [DOI] [PubMed] [Google Scholar]
- 7.Dailey AT, Avellino AM, Benthem L, Silver J, Kliot M. Complement depletion reduces macrophage infiltration and activation during Wallerian degeneration and axonal regeneration. J Neurosci. 1998;18:6713–6722. doi: 10.1523/JNEUROSCI.18-17-06713.1998. [DOI] [PMC free article] [PubMed] [Google Scholar]
- 8.Dedkov EI, Kostrominova TY, Borisov AB, Carlson BM. Survival of Schwann cells in chronically denervated skeletal muscles. Acta Neuropathol (Berl) 2002;103:565–574. doi: 10.1007/s00401-001-0504-6. [DOI] [PubMed] [Google Scholar]
- 9.Dong Z, Brennan A, Liu N, Yarden Y, Lefkowitz G, Mirsky R, Jessen KR. Neu differentiation factor is a neuron-glia signal and regulates survival, proliferation, and maturation of rat Schwann cell precursors. Neuron. 1995;15:585–596. doi: 10.1016/0896-6273(95)90147-7. [DOI] [PubMed] [Google Scholar]
- 10.Feng G, Mellor RH, Bernstein M, Keller-Peck C, Nguyen QT, Wallace M, Nerbonne JM, Lichtman JW, Sanes JR. Imaging neuronal subsets in transgenic mice expressing multiple spectral variants of GFP. Neuron. 2000;28:41–51. doi: 10.1016/s0896-6273(00)00084-2. [DOI] [PubMed] [Google Scholar]
- 11.Fornaro M, Tos P, Geuna S, Giacobini-Robecchi MG, Battiston B. Confocal imaging of Schwann-cell migration along muscle-vein combined grafts used to bridge nerve defects in the rat. Microsurgery. 2001;21:153–155. doi: 10.1002/micr.1029. [DOI] [PubMed] [Google Scholar]
- 12.Fox IK, Jaramillo A, Hunter DA, Rickman SR, Mohanakumar T, Mackinnon SE. Prolonged cold-preservation of nerve allografts. Muscle Nerve. 2005;31:59–69. doi: 10.1002/mus.20231. [DOI] [PubMed] [Google Scholar]
- 13.Garratt AN, Britsch S, Birchmeier C. Neuregulin, a factor with many functions in the life of a schwann cell. Bioessays. 2000;22:987–996. doi: 10.1002/1521-1878(200011)22:11<987::AID-BIES5>3.0.CO;2-5. [DOI] [PubMed] [Google Scholar]
- 14.Gundersen HJ. The nucleator. J Microsc. 1988;151:3–21. doi: 10.1111/j.1365-2818.1988.tb04609.x. [DOI] [PubMed] [Google Scholar]
- 15.Hadlock T, Elisseeff J, Langer R, Vacanti J, Cheney M. A tissue-engineered conduit for peripheral nerve repair. Arch Otolaryngol Head Neck Surg. 1998;124:1081–1086. doi: 10.1001/archotol.124.10.1081. [DOI] [PubMed] [Google Scholar]
- 16.Hayworth CR, Moody SE, Chodosh LA, Krieg P, Rimer M, Thompson WJ. Induction of neuregulin signaling in mouse schwann cells in vivo mimics responses to denervation. J Neurosci. 2006;26:6873–6884. doi: 10.1523/JNEUROSCI.1086-06.2006. [DOI] [PMC free article] [PubMed] [Google Scholar]
- 17.Hobson MI. Increased vascularisation enhances axonal regeneration within an acellular nerve conduit. Ann R Coll Surg Engl. 2002;84:47–53. [PMC free article] [PubMed] [Google Scholar]
- 18.Jessen KR, Mirsky R. The origin and development of glial cells in peripheral nerves. Nat Rev Neurosci. 2005;6:671–682. doi: 10.1038/nrn1746. [DOI] [PubMed] [Google Scholar]
- 19.Kang H, Tian L, Thompson W. Terminal Schwann cells guide the reinnervation of muscle after nerve injury. J Neurocytol. 2003;32:975–985. doi: 10.1023/B:NEUR.0000020636.27222.2d. [DOI] [PubMed] [Google Scholar]
- 20.Lundborg G. Intraneural microcirculation. Orthop Clin North Am. 1988;19:1–12. [PubMed] [Google Scholar]
- 21.Lyons DA, Pogoda HM, Voas MG, Woods IG, Diamond B, Nix R, Arana N, Jacobs J, Talbot WS. erbb3 and erbb2 are essential for schwann cell migration and myelination in zebrafish. Curr Biol. 2005;15:513–524. doi: 10.1016/j.cub.2005.02.030. [DOI] [PubMed] [Google Scholar]
- 22.Michailov GV, Sereda MW, Brinkmann BG, Fischer TM, Haug B, Birchmeier C, Role L, Lai C, Schwab MH, Nave KA. Axonal neuregulin-1 regulates myelin sheath thickness. Science. 2004;304:700–703. doi: 10.1126/science.1095862. [DOI] [PubMed] [Google Scholar]
- 23.Mirsky R, Jessen KR, Brennan A, Parkinson D, Dong Z, Meier C, Parmantier E, Lawson D. Schwann cells as regulators of nerve development. J Physiol Paris. 2002;96:17–24. doi: 10.1016/s0928-4257(01)00076-6. [DOI] [PubMed] [Google Scholar]
- 24.Mosahebi A, Wiberg M, Terenghi G. Addition of fibronectin to alginate matrix improves peripheral nerve regeneration in tissue-engineered conduits. Tissue Engineering. 2003 Apr;9(2):209–18. doi: 10.1089/107632703764664684. 2003. [DOI] [PubMed] [Google Scholar]
- 25.Myckatyn TM, MacKinnon SE. A review of research endeavors to optimize peripheral nerve reconstruction. Neurol Res. 2004;26:124–138. doi: 10.1179/016164104225013743. [DOI] [PubMed] [Google Scholar]
- 26.Myckatyn TM, Mackinnon SE, Hunter DA, Brakefield D, Parsadanian A. A novel model for the study of peripheral-nerve regeneration following common nerve injury paradigms. J Reconstr Microsurg. 2004;20:533–544. doi: 10.1055/s-2004-836125. [DOI] [PubMed] [Google Scholar]
- 27.Nguyen QT, Sanes JR, Lichtman JW. Pre-existing pathways promote precise projection patterns. Nat Neurosci. 2002;5:861–867. doi: 10.1038/nn905. [DOI] [PubMed] [Google Scholar]
- 28.Nichols CM, Brenner MJ, Fox IK, Tung TH, Hunter DA, Rickman SR, Mackinnon SE. Effects of motor versus sensory nerve grafts on peripheral nerve regeneration. Exp Neurol. 2004;190:347–355. doi: 10.1016/j.expneurol.2004.08.003. [DOI] [PubMed] [Google Scholar]
- 29.Ozcan G, Shenaq S, Spira M. Study of microcirculation of rat femoral nerve and development of a new vascularized nerve graft model. J Reconstr Microsurg. 1991;7:133–138. doi: 10.1055/s-2007-1006773. [DOI] [PubMed] [Google Scholar]
- 30.Pan YA, Misgeld T, Lichtman JW, Sanes JR. Effects of neurotoxic and neuroprotective agents on peripheral nerve regeneration assayed by time-lapse imaging in vivo. J Neurosci. 2003;23:11479–11488. doi: 10.1523/JNEUROSCI.23-36-11479.2003. [DOI] [PMC free article] [PubMed] [Google Scholar]
- 31.Perry VH, Brown MC, Gordon S. The macrophage response to central and peripheral nerve injury. A possible role for macrophages in regeneration. J Exp Med. 1987;165:1218–1223. doi: 10.1084/jem.165.4.1218. [DOI] [PMC free article] [PubMed] [Google Scholar]
- 32.Redett R, Jari R, Crawford T, Chen YG, Rohde C, Brushart TM. Peripheral pathways regulate motoneuron collateral dynamics. J Neurosci. 2005;25:9406–9412. doi: 10.1523/JNEUROSCI.3105-05.2005. [DOI] [PMC free article] [PubMed] [Google Scholar]
- 33.Reichert F, Saada A, Rotshenker S. Peripheral nerve injury induces Schwann cells to express two macrophage phenotypes: phagocytosis and the galactose-specific lectin MAC-2. J Neurosci. 1994;14:3231–3245. doi: 10.1523/JNEUROSCI.14-05-03231.1994. [DOI] [PMC free article] [PubMed] [Google Scholar]
- 34.Seckel BR, Ryan SE, Simons JE, Gagne RG, Watkins E., Jr. Vascularized versus nonvascularized nerve grafts: an experimental structural comparison. Plast Reconstr Surg. 1986;78:211–220. doi: 10.1097/00006534-198608000-00012. [DOI] [PubMed] [Google Scholar]
- 35.Snider WD, Zhou FQ, Zhong J, Markus A. Signaling the pathway to regeneration. Neuron. 2002;35:13–16. doi: 10.1016/s0896-6273(02)00762-6. [DOI] [PubMed] [Google Scholar]
- 36.Sulaiman OA, Gordon T. Transforming growth factor-beta and forskolin attenuate the adverse effects of long-term Schwann cell denervation on peripheral nerve regeneration in vivo. Glia. 2002;37:206–218. doi: 10.1002/glia.10022. [DOI] [PubMed] [Google Scholar]
- 37.Sulaiman OA, Midha R, Munro CA, Matsuyama T, Al-Majed A, Gordon T. Chronic Schwann cell denervation and the presence of a sensory nerve reduce motor axonal regeneration. Experimental Neurology. 2002;176:342–354. doi: 10.1006/exnr.2002.7928. [DOI] [PubMed] [Google Scholar]
- 38.Taveggia C, Zanazzi G, Petrylak A, Yano H, Rosenbluth J, Einheber S, Xu X, Esper RM, Loeb JA, Shrager P, Chao MV, Falls DL, Role L, Salzer JL. Neuregulin-1 type III determines the ensheathment fate of axons. Neuron. 2005;47:681–694. doi: 10.1016/j.neuron.2005.08.017. [DOI] [PMC free article] [PubMed] [Google Scholar]
- 39.Terzis JK, Skoulis TG, Soucacos PN. Vascularized nerve grafts. A review. Int Angiol. 1995;14:264–277. [PubMed] [Google Scholar]
- 40.Tseng CY, Hu G, Ambron RT, Chiu DT. Histologic analysis of Schwann cell migration and peripheral nerve regeneration in the autogenous venous nerve conduit (AVNC) J Reconstr Microsurg. 2003;19:331–340. doi: 10.1055/s-2003-42502. [DOI] [PubMed] [Google Scholar]
- 41.Ulkur E, Yuksel F, Acikel C, Okar I, Celikoz B. Comparison of functional results of nerve graft, vein graft, and vein filled with muscle graft in end-to-side neurorrhaphy. Microsurgery. 2003;23:40–48. doi: 10.1002/micr.10076. [DOI] [PubMed] [Google Scholar]
- 42.Varejao AS, Cabrita AM, Geuna S, Patricio JA, Azevedo HR, Ferreira AJ, Meek MF. Functional assessment of sciatic nerve recovery: biodegradable poly (DLLA-epsilon-CL) nerve guide filled with fresh skeletal muscle. Microsurgery. 2003;23:346–353. doi: 10.1002/micr.10148. [DOI] [PubMed] [Google Scholar]
- 43.Walsh MK, Lichtman JW. In vivo time-lapse imaging of synaptic takeover associated with naturally occurring synapse elimination. Neuron. 2003;37:67–73. doi: 10.1016/s0896-6273(02)01142-x. [DOI] [PubMed] [Google Scholar]
- 44.Weber RV, Mackinnon SE. Bridging the neural gap. Clin Plast Surg. 2005;32:605–616. doi: 10.1016/j.cps.2005.05.003. viii. [DOI] [PubMed] [Google Scholar]
- 45.Witzel C, Rohde C, Brushart TM. Pathway sampling by regenerating peripheral axons. J Comp Neurol. 2005;485:183–190. doi: 10.1002/cne.20436. [DOI] [PubMed] [Google Scholar]
- 46.Yin Q, Kemp GJ, Yu LG, Wagstaff SC, Frostick SP. Expression of Schwann cell-specific proteins and low-molecular-weight neurofilament protein during regeneration of sciatic nerve treated with neurotrophin-4. Neuroscience. 2001;105:779–783. doi: 10.1016/s0306-4522(01)00216-0. [DOI] [PubMed] [Google Scholar]
- 47.Zhu JY, Huang YT, Zhu QS, Lu R. Expression of adenovirus-mediated neurotrophin-3 gene in Schwann cells of sciatic nerve in rats. Chin J Traumatol. 2003;6:75–80. [PubMed] [Google Scholar]
- 48.Zuo Y, Lubischer JL, Kang H, Tian L, Mikesh M, Marks A, Scofield VL, Maika S, Newman C, Krieg P, Thompson WJ. Fluorescent proteins expressed in mouse transgenic lines mark subsets of glia, neurons, macrophages, and dendritic cells for vital examination. J Neurosci. 2004;24:10999–11009. doi: 10.1523/JNEUROSCI.3934-04.2004. [DOI] [PMC free article] [PubMed] [Google Scholar]