Abstract
Background
Ghrelin is an orexigenic gut peptide produced predominantly by the stomach. Gastric mucosal ghrelin production could be compromised by an infiltrating adenocarcinoma.
Aims
To assess the expression of ghrelin mRNA and peptide in oesophagogastric adenocarcinomas and adjacent non‐neoplastic mucosa.
Methods
10 gastric and 22 oesophageal adenocarcinoma archival samples were randomly selected from a database. The presence of ghrelin‐positive cells was assessed in cancer and corresponding non‐neoplastic mucosa by immunohistochemistry. Quantitative reverse transcriptase polymerase chain reaction (PCR) for ghrelin mRNA was also performed on 24 gastric and 8 oesophageal adenocarcinoma specimens and adjacent non‐neoplastic mucosa.
Results
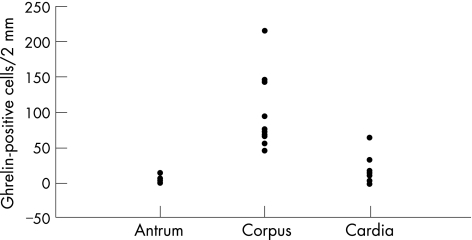
Immunohistochemistry and reverse transcriptase PCR confirm a negligible expression of ghrelin in adenocarcinoma specimens. By contrast, non‐neoplastic gastric mucosa was rich in ghrelin‐positive cells and ghrelin mRNA. The number (median and range) of ghrelin‐positive cells per 2 mm section of non‐neoplastic mucosa was 73 (45–215) in the corpus; this was significantly higher than in cardia mucosa (9 (0–64), p<0.001) and antral mucosa (5 (0–14), p<0.001).
Conclusions
Gastric and oesophageal adenocarcinomas have no ghrelin‐producing cells. The highest level of ghrelin expression was noted in the non‐neoplastic mucosa of the gastric corpus. Disruption of the gastric ghrelin‐producing mechanism may occur during oesophagogastric malignancy.
Anorexia and weight loss occur early in the course of oesophagogastric malignancy. In gastric cancer, dyspepsia is the only symptom that occurs more often than anorexia and weight loss.1 For oesophageal adenocarcinoma, which sometimes extends distally to involve the upper stomach, symptoms like anorexia and weight loss are only exceeded in frequency by dysphagia.2 Late in the disease process when obstructive symptoms occur, poor food intake may accelerate weight loss. During this late phase other mechanisms which subserve cancer cachexia also apply.3,4 These include depression, putative anorexic byproducts of tumourogenesis and a hyper metabolic tumour mass.5,6,7 However, the anorexia and weight loss associated distinctly with the early phase of this cancer are difficult to attribute solely to traditional cancer cachexia mechanisms.
Ghrelin, a 28 amino acid peptide,8 has been implicated in the control of food intake and energy homoeostasis in both humans and rodents9,10,11,12,13 and ghrelin is orexigenic when infused to humans.10 In mammals, most of the circulating ghrelin is produced in the stomach by the enteroendocrine cells of the oxyntic mucosa, probably the X/A‐like cells.14,15,16 Plasma ghrelin concentrations decrease by 65–77% in patients having undergone gastric bypass surgery.17,18 Ghrelin is also one of the most potent stimulators of growth hormone release acting via the type 1a growth hormone secretagogue receptor19,20,21,22,23; however, its orexigenic effects are independent of growth hormone stimulation.
The regulation of gastric ghrelin secretion is poorly understood. Plasma ghrelin concentrations increase before meals and decrease after meals, giving it a distinct meal‐related diurnal profile.24,25 In the rodents, it plays an important role in the regulation of appetite and satiety12,13 and inhibition of ghrelin receptors leads to weight loss.26 There is an increasing evidence that it may play a similar role in humans.
Ghrelin may stimulate appetite by crossing the blood–brain barrier to reach the hypothalamus where it stimulates neuropeptide Y neurones.27 Ghrelin receptors have been detected on gastric vagal afferent neurones suggesting that a paracrine mechanism may exist.28 Thus, acting through this alternative mechanism, ghrelin may exert an effect on the hypothalamic appetite centres via the vagus nerve. Cancers occurring close to the main source of ghrelin in the upper stomach could disrupt this appetite‐regulatory mechanism and contribute to anorexia nervosa. Although there is evidence of ghrelin production by human neuroendocrine tumours,29,30,31,32 only a few studies provide evidence of ghrelin expression by other cancers of the foregut. Furthermore, when these cancers arise from gastric mucosa, the main site of ghrelin production, it is uncertain if they retain the ghrelin‐producing attributes of their parent mucosa. Aydin et al33 using immunohistochemical methods and radioimmunoassay found no ghrelin in stomach cancer tissue and speculated that this may contribute to cancer‐related anorexia nervosa. The objective of our study was to investigate the expression of ghrelin in adenocarcinomas of the stomach and oesophagus that occur close to the centre of ghrelin production. This was done by a retrospective immunohistochemical analysis of archival material and a quantitative assessment of mRNA in freshly resected specimens.
Methods
Immunohistochemistry
Specimens
Archival samples were randomly selected from a database of patients who underwent oesophageal and gastric cancer surgery at our hospital during 1995–7. A total of 10 gastric and 22 oesophageal adenocarcinomas were utilised. Sections of 3 µm thickness were cut from formalin‐fixed, paraffin‐wax‐embedded oesophageal and gastric adenocarcinomas, spanning the tumour margin and adjacent non‐neoplastic mucosa. The adjacent non‐neoplastic mucosa was recorded as of antral, corpus or cardiac type.
Immunohistochemistry
A standard immunohistochemical procedure was followed. Optimal antigen retrieval was found to be via pressure cooking, heat‐induced antigen retrieval in pH 7.8 Tris‐EDTA buffer, for 80 s once pressure was achieved. The detection system used was an immunoperoxidase‐based system (Vector Universal Elite ABC kit Cat PK‐6200, Vector Laboratories, Burlingame, California, USA) with a diaminobenzidine tetrahydrachloride visualisation agent (Menarini Concentrated Substrate Cat IlK 153‐5K, Biogenix Laboratories, San Remon, California, USA). The optimal antibody dilution was determined to be 1 in 800 after serial dilutions (Phoenix Pharmaceuticals Peptides Cat H‐031‐30, Rabbit anti‐ghrelin (human)). Phoenix Pharmaceuticals (Phonenix Europe, Gmbh, Germany) suggested a dilution of 1 in 70, which was found to produce unacceptable levels of background staining. Negative controls, stained by omitting the primary antibody, were carried out with each staining. The adjacent mucosa in each section was utilised as a positive control to allow direct comparison between cancerous and non‐neoplastic tissues. Preabsorption controls were not performed.
Assessment of ghrelin immunoreactivity
This was undertaken by two pathologists working as a team on a double‐headed microscope. The slides were first marked using a marker pen and ruler into four 2 mm‐wide zones, parallel to each other and perpendicular to the luminal surface. The first zone was carcinoma, and the other three zones were classified by measuring 2, 4 and 6 mm in distance, respectively, from the cancer margin, and included the full thickness of the mucosa. Ghrelin‐positive cells were then counted in each of these four zones. To minimise variation, both pathologists evaluated the sections independently and the scores in each case were averaged.
Quantitative mRNA assay
Specimens
In all, 24 gastric adenocarcinoma and eight oesophageal adenocarcinoma specimens were obtained from patients undergoing surgical resection for oesophagogastric cancer. These patients had resectable disease as assessed by CT scanning and endoscopy, and therefore had insignificant preoperative nutritional comorbidity. During surgery, tissue samples from the cancer and adjacent macroscopically normal‐looking tissue were snap‐frozen in liquid nitrogen and stored at −80°C for mRNA assay. For patients undergoing a partial gastrectomy for gastric adenocarcinoma, the normal‐looking non‐neoplastic mucosa was sampled from the upper resection margin which was the gastric corpus and/or cardia in most cases. For oesophageal adenocarcinoma, the normal‐looking non‐neoplastic mucosa was sampled from the upper resection margin which was squamous in all cases.
RNA extraction and cDNA synthesis
Tissue powder was lysed in 175 μl of RNA lysis buffer (4 M GTC, 0.01 M Tris (pH7.5), 0.97% β mercaptoethanol; Promega). RNA was extracted using the Promega SV Total RNA Isolation kit (Promega, Southampton, UK) following the protocol recommended by the manufacturers. Samples were treated with DNAse to digest contaminating genomic DNA. RNA yield and purity were determined using a spectrophotometer at 260 and 280 nm. First strand cDNA synthesis was performed using RNase Reverse Transcriptase (GIBCO BRL, Paisley, UK).
Real‐time reverse transcriptase PCR
Quantitative PCR was performed on a Roche Light Cycler system (Roche Molecular Biochemicals, Manheim, Germany). PCR reactions were carried out in a reaction mixture consisting of 5.0 μl reaction buffer and 2.0 mM MgCl2 (Biogene Ltd, Cambridge, UK), 1.0 μl of each primer (1 ng/μl), 2.5 μl of cDNA and 0.5 μl of Light Cycler DNA Master SYBR Green I (Roche Molecular Biochemicals).
Protocol conditions consisted of denaturation at 95°C for 15 s, followed by 40 cycles at 94°C for 1 s, 58°C for 10 s and 72°C for 15 s, followed by melting curve analysis. For analysis, quantitative amounts of ghrelin gene expression were standardised against the house‐keeping gene β‐actin, as previously described.34 Quantitative data analysis was made possible by the use of ghrelin RNA from serially diluted gastric cDNA. 10 μl of the reaction mixture were subsequently electrophoresed on a 1.6% agarose gel and visualised by ethidium bromide, using a 1 kb DNA ladder (GIBCO BRL) in order to estimate the band sizes. As a negative control for all the reactions, distilled water was used in place of cDNA. The RNA levels were expressed as a ratio, using “delta–delta method” for comparing relative expression results between treatments in real‐time PCR.35
The primers used were Ghrelin: sense 5′‐TGA GCC CTG AAC ACC AGA GAG‐3′, antisense 5′‐AAA GCC AGA TGA GCG CTT CTA‐3′. The expected size for ghrelin is 327 bp; β actin: sense 5′‐AAG AGA GGC ATC CTC ACC CT‐3′, antisense 5′‐TAC ATG GCT GGG GTG TTG AA‐3′. The expected size for actin is 216 bp.
Sequence analysis
The PCR products from the placental samples, used as a positive control, were purified from the 1.6% agarose gel using QIAquick Gel Extraction Kit (QIAGEN, Crawley, West Sussex, UK). PCR products were then sequenced in an automated DNA sequencer and the sequence data were analysed using Blast Nucleic Acid Database Searches from the National Centre for Biotechnology Information, confirming the identity of our product.
Statistics
The Wilcoxon rank sum test was applied for comparison of immunoreactivity between gastric segments using the Analyse‐it statistical package, Leeds University, UK.
Results
Ghrelin immunohistochemistry
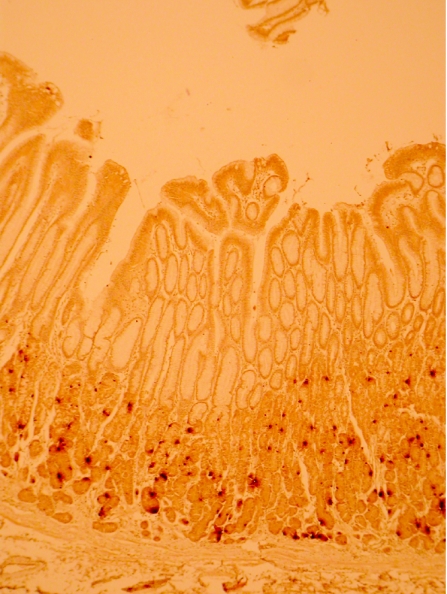
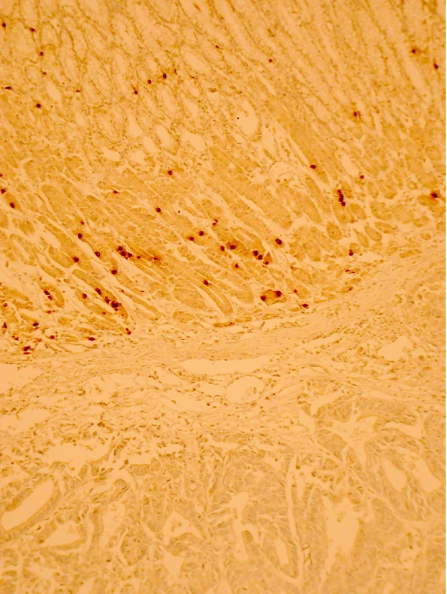
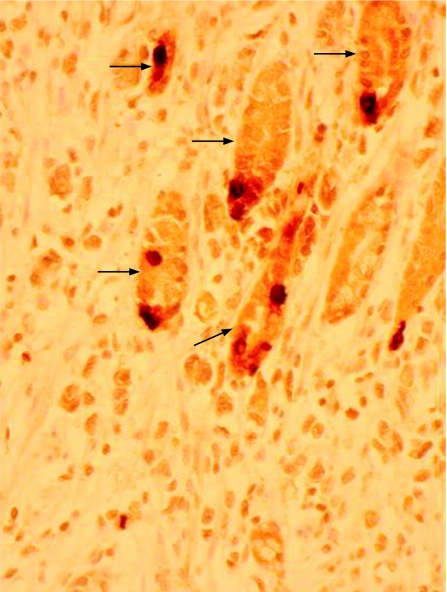
Ghrelin immunoreactivity was confined to a proportion of neuroendocrine cells situated in the neck region of non‐neoplastic gastric mucosa (fig 1). This was confirmed by concurrent immunohistochemical staining with chromogranin A and ghrelin. Ghrelin immunoreactivity was undetectable in either gastric or oesophageal adenocarcinoma tissue (fig 2). Apparent focal positivity was found on close examination to be confined to non‐neoplastic gastric glands entrapped within the infiltrating tumour tissue (fig 3). Within non‐neoplastic mucosa adjacent to tumour, the density of ghrelin‐positive cells did not vary significantly at 2, 4 or 6 mm from the tumour edge. However, the density of ghrelin‐positive cells in adjacent non‐neoplastic mucosa varied according to the anatomical site (fig 4). The median number (range) of ghrelin‐positive cells per 2 mm section of mucosa was 73 (45–215) in the corpus; this was significantly higher than in cardia mucosa (9 (0–64), p<0.001, Wilcoxon rank sum test) and antral mucosa (5 (0–14), p<0.001, Wilcoxon rank sum test).
Figure 1 Normal gastric mucosa showing the distribution of ghrelin‐positive cells in the neck region of the gastric glands (immunohistochemistry for ghrelin, original magnification ×100).
Figure 2 Normal gastric mucosa (upper segment) adjacent to a carcinoma showing scattered ghrelin‐positive cells, with no ghrelin immunoreactivity (lower segment) in the cancer itself (immunohistochemistry for ghrelin, original magnification ×100)
Figure 3 Normal gastric glandular cells (arrows) entrapped within the adenocarcinoma. Some of the normal cells are ghrelin‐positive. The surrounding adenocarcinoma is ghrelin negative (immunohistochemistry for ghrelin, original magnification ×400).
Figure 4 The number of ghrelin‐positive cells in 2 mm zones within sections of non‐neoplastic gastric mucosa recorded as antrum (8 samples), corpus (12 samples) and cardia (9 samples).
Ghrelin mRNA
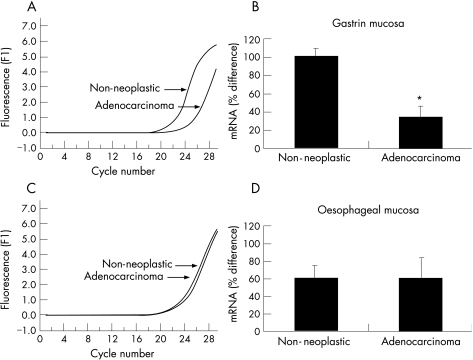
Serial dilutions of ghrelin cDNA provided the template on which a line of best fit was plotted and used as a standard curve to demonstrate accuracy and reproducibility of the analysis (not shown). Melting curve analysis of the PCR products is shown as fluorescence over time (−dF/dT) against temperature (T,oC). The melting curve analysis shows a single melting maximum of 91.80°C for the human ghrelin gene, and a single melting maximum of 90.30°C for the β actin gene; thus confirming product specificity (data not shown). The ghrelin melting peak corresponds to a 327 bp fragment and the β actin peak corresponds to a 216 bp fragment. Quantification data were analysed using the Light Cycler analysis software (Roche Molecular Biochemicals). Background fluorescence was removed by setting a noise band and corrections for the β actin gene mRNA were made. The reverse transcriptase PCR in fig 5(A, B) shows a delay in amplification of ghrelin mRNA in the gastric adenocarcinoma sample when compared with adjacent non‐neoplastic gastric mucosa. This trend was observed in 20 of 24 paired samples examined and is consistent with insignificant quantities of ghrelin mRNA in the cancer specimen. By contrast, fig 5 (C–D), shows synchronous and late amplification of ghrelin mRNA in the oesophageal adenocarcinoma sample and adjacent non‐neoplastic squamous oesophagus. This trend was observed in seven of eight paired samples examined.
Figure 5 Real‐time polymerase chain reaction (PCR) graph shows a significant difference in amplification efficiency between a typical gastric adenocarcinoma sample and adjacent non‐neoplastic gastric mucosa. Y Axis is fluorescence and x axis is cycle number (A). Amplification of ghrelin mRNA in the adenocarcinoma sample is delayed when compared with the non‐neoplastic mucosa suggesting a marked decrease in the cancer sample (*p<0.05; B). Real‐time PCR graph shows no significant difference in amplification efficiency between a typical oesophageal adenocarcinoma sample and adjacent non‐neoplastic squamous oesophagus mucosa (C). No apparent difference was noticed in ghrelin mRNA between the adenocarcinoma sample and the non‐neoplastic squamous oesophageal mucosa (p = not significant; D).
There was no significant difference in ghrelin mRNA expression in gastric and oesophageal adenocarcinoma samples.
Discussion
This study provides evidence of insignificant ghrelin mRNA and peptide expression in oesophagogastric adenocarcinoma. It confirms that ghrelin production is confined to a subpopulation of non‐neoplastic neuroendocrine cells in the gastric mucosal neck region. Many oesophageal or gastric adenocarcinomas show a diffuse pattern of spread that infiltrates lamina propria and then destroys mucosal epithelial and glandular elements. Figure 3 is an example of adenocarcinoma replacing normal gastric mucosa with a few residual non‐neoplastic ghrelin‐positive glands. If an adenocarcinoma successfully replaces most normal ghrelin‐producing mucosa, the capacity of the stomach to secrete ghrelin in response to fasting could be compromised. It has been suggested that the anorexia nervosa and weight loss noted after gastrectomy could also be due to a reduction in the gastric ghrelin cell mass.29 In rodents, there is a suggestion that circulating ghrelin can be replenished from non‐gastric sources if gastric‐ghrelin production is lost.36 This may not be relevant in humans with cancer who generally have a limited life expectancy. As the cancer progresses, gastric compliance is lost and the ability of the stomach to respond to food in its lumen is decreased. Cancer may also distort gastric microanatomy altering the relationship between ghrelin‐producing cells and gastric vagal nerves, thus attenuating any local effects the peptide may have on vagal afferents.27 This latter mechanism may be relevant given the doubt about the role of circulating ghrelin in cancer cachexia. A recent study found that patients with cachetic lung cancer remained anorectic despite having high levels of plasma ghrelin.37
This study confirms that gastric corpus has the highest concentration of ghrelin‐producing cells in humans.14 Cancers arising in the gastric mucosa are therefore more likely to cause early disruption of the ghrelin‐producing mechanism and could lead to patients presenting with anorexia nervosa and weight loss before symptoms owing to luminal obstruction. Similarly, surgical procedures affecting this part of the stomach are likely to impair ghrelin production and function. By contrast, the absence of significant ghrelin production in the oesophagus suggests that cancers restricted to this region are less likely to affect overall ghrelin production. In practice, cancers arising in the distal oesophagus initially present with dysphagia owing to dysmotility and luminal obstruction with anorexia nervosa being a relatively late event.
Take‐home messages
Gastric corpus has the highest concentration of ghrelin‐producing cells in humans.
Disruption of gastric ghrelin producing mechanism may occur during oesophagogastric carcinoma.
Ghrelin expression in oesophagogestric carcinoma is insignificant in comparison with non‐neoplastic types.
An infiltrating adenocarcinoma by replacing normal gastric mucosa could decrease ghrelin production and disrupt local paracrine mechanisms.
There exists a possibility of managing cancer cachexia by using synthetic ghrelin analogues if they become available is the future.
In conclusion, an infiltrating adenocarcinoma by replacing normal gastric mucosa could decrease ghrelin production and disrupt local paracrine mechanisms. Future studies should be directed at determining the role of circulating ghrelin and local mechanisms in the anorexia nervosa of foregut cancer and understanding whether compensatory ghrelin production from non‐gastric sources has any role. The possibility of using synthetic ghrelin agonists for managing cancer cachexia is an intriguing concept which should be examined when they become available.
Abbreviations
PCR - polymerase chain reaction
Footnotes
Competing interests: None.
Ethical considerations: The Coventry Research Ethics Committee gave ethical approval. Patients gave written informed consent for samples collected peri‐operatively.
References
- 1.Liberman D A, Oehike M, Helfand M. Risk factors for Barrett̀s oesophagus in community based practice GORGE consortium. Gastroenterology Outcomes Research Group in Endoscopy. Am J Gastroenterol 1997921293–1297. [PubMed] [Google Scholar]
- 2.Allum W H, Griffin S M, Watson A.et al Guidelines for the management of oesophageal and gastric cancer. Gut 200250(Suppl 5)v1–23. [DOI] [PMC free article] [PubMed] [Google Scholar]
- 3.Grimble R F. Nutritional therapy for cancer cachexia. Gut 2003521391–1392. [DOI] [PMC free article] [PubMed] [Google Scholar]
- 4.Puccio M, Nathanson L. The cancer cachexia syndrome. Semin Oncol 199724277–287. [PubMed] [Google Scholar]
- 5.MacDonald N, Easson A M, Mazurak V C.et al Understanding and managing cancer cachexia. J Am Coll Surg 2003197143–161. [DOI] [PubMed] [Google Scholar]
- 6.Falconer J S, Fearon K C, Plester C E.et al Cytokines, the acute‐phase response, and resting energy expenditure in cachectic patients with pancreatic cancer. Ann Surg 1994219325–331. [DOI] [PMC free article] [PubMed] [Google Scholar]
- 7.Hyltander A, Drott C, Korner U.et al Elevated energy expenditure in cancer patients with solid tumours. Eur J Cancer 1991279–15. [DOI] [PubMed] [Google Scholar]
- 8.Kojima M, Hosoda H, Date Y.et al Ghrelin is a growth‐hormone releasing acylated peptide from stomach. Nature 1999402656–660. [DOI] [PubMed] [Google Scholar]
- 9.Gualillo O, Lago O, Gomez‐Reino J.et al Ghrelin, a widespread hormone: insights into molecular and cellular regulation of its expression and mechanism of action. FEBS Lett 2003552105–109. [DOI] [PubMed] [Google Scholar]
- 10.Wren A M, Seal L J, Cohen M A.et al Ghrelin enhances appetite and increases food intake in humans. J Clin Endocrinol Metab 2001865992–5995. [DOI] [PubMed] [Google Scholar]
- 11.Wren A M, Small C J, Abbott C R.et al Ghrelin causes hyperphagia and obesity in rats. Diabetes 2001502540–2547. [DOI] [PubMed] [Google Scholar]
- 12.Tschop M, Smiley D L, Heiman M L. Ghrelin induces adiposity in rodents. Nature 2000407908–913. [DOI] [PubMed] [Google Scholar]
- 13.Nakazato M, Murakami N, Date Y.et al A role for ghrelin in the central regulation of feeding. Nature 2001409194–198. [DOI] [PubMed] [Google Scholar]
- 14.Date Y, Kojima M, Hosoda H.et al A novel growth hormone‐releasing acylated peptide, is synthesized in a distinct endocrine cell type in the gastrointestinal tracts of rats and humans. Endocrinology 20001414255–4261. [DOI] [PubMed] [Google Scholar]
- 15.Rindi G, Neechi V, Savio A.et al Characterisation of gastric ghrelin cells in man and other mammals: studies in adult and foetal tissues. Histochem Cell Biol 2002117511–519. [DOI] [PubMed] [Google Scholar]
- 16.Sakata I, Nakamura K, Yamazaki M.et al Ghrelin‐producing cells exist as two types of cells, closed‐ and opened‐type cells, in the rat gastrointestinal tract. Peptides 200223531–536. [DOI] [PubMed] [Google Scholar]
- 17.Cummings D E, Weigle D S, Frayo R S.et al Plasma ghrelin levels after diet‐induced weight loss or gastric surgery. N Engl J Med 20023461623–1630. [DOI] [PubMed] [Google Scholar]
- 18.Ariyasu H, Takaya K, Tagami T.et al Stomach is a major source of circulating ghrelin, and feeding state determines plasma ghrelin‐like immunoreactivity levels in humans. J Clin Endocrinol Metab 2001864753–4758. [DOI] [PubMed] [Google Scholar]
- 19.Takaya K, Ariyasu H, Kanamoto N.et al Ghrelin strongly stimulates growth hormone release in humans. J Clin Endocrinol Metab 2000854908–4911. [DOI] [PubMed] [Google Scholar]
- 20.Bowers C Y. Unnatural growth hormone‐releasing peptide begets natural ghrelin. J Clin Endocrinol Metab 2001861464–1469. [DOI] [PubMed] [Google Scholar]
- 21.Arvat E, DiVito L, Broglio F.et al Preliminary evidence that ghrelin the natural GH secretagogue (GHS)‐receptor ligand, strongly stimulates GH secretion in humans. J Endocrinol Invest 200023493–495. [DOI] [PubMed] [Google Scholar]
- 22.Peino R, Baldelli R, Rodriguez‐Garcia J.et al Ghrelin‐induced growth hormone secretion in humans. Eur J Endocrinol 2000143R11–R14. [DOI] [PubMed] [Google Scholar]
- 23.Kojima M, Hosoda H, Matsuo H.et al discovery of the natural endogenous ligand for the growth hormone secretagogue receptor. Trends Endocrinol Metab 200112118–122. [DOI] [PubMed] [Google Scholar]
- 24.Cummings D E, Purnell J Q, Frayo R S.et al A preprandial rise in plasma ghrelin levels suggests a role in meal initiation in humans. Diabetes 2001501714–1719. [DOI] [PubMed] [Google Scholar]
- 25.Tschop M, Wawarta R, Riepl R L.et al Post‐prandial decrease of circulating human ghrelin levels. J Endocrinol Invest 200124RC19–RC21. [DOI] [PubMed] [Google Scholar]
- 26.Asakawa A, Inui A, Kaga T.et al Antagonism of ghrelin receptor reduces food intake and body weight gain in mice. Gut 200352947–952. [DOI] [PMC free article] [PubMed] [Google Scholar]
- 27.Kohno D, Gao H Z, Muroya S.et al Ghrelin directly interacts with neuropeptide‐Y containing neurons in the rat arcuate nucleus: Ca2+ signalling via protein kinase A and N‐type channel‐dependent mechanisms and cross‐talk with leptin and orexin. Diabetes 200352948–956. [DOI] [PubMed] [Google Scholar]
- 28.Date Y, Murakami N, Toshinai K.et al The role of the gastric afferent vagal nerve in ghrelin‐induced feeding and growth hormone secretion in rats. Gastroenterology 20021231120–1128. [DOI] [PubMed] [Google Scholar]
- 29.Korbonits M, Bustin S A, Kojima M.et al The expression of the growth hormone secretagogue receptor ligand ghrelin in normal and abnormal human pituitary and other neuroendocrine tumors. J Clin Endocrinol Metab 200186881–887. [DOI] [PubMed] [Google Scholar]
- 30.Corbetta S, Peracchi M, Cappiello V.et al Circulating ghrelin levels in patients with pancreatic and gastrointestinal neuroendocrine tumors: identification of one pancreatic ghrelinoma. J Clin Endocrinol Metab 2003883117–3120. [DOI] [PubMed] [Google Scholar]
- 31.Papotti M, Cassoni P, Volante M.et al Ghrelin‐producing endocrine tumours of the stomach and intestine. J Clin Endocrinol Metab 2001865052–5059. [DOI] [PubMed] [Google Scholar]
- 32.Rindi G, Savio A, Torsello A.et al Ghrelin expression in gut endocrine growths. Histochem Cell Biol 2002117521–525. [DOI] [PubMed] [Google Scholar]
- 33.Aydin S, Ozercan I H, Dagli F.et al Ghrelin immunohistochemistry of gastric adenocarcinoma and mucoepidermoid carcinoma of the salivary gland. Biotech Histochem 200580163–168. [DOI] [PubMed] [Google Scholar]
- 34.Gualillo O, Caminos J, Blanco M.et al a novel placental‐derived hormona. Endocrinology 2001142788–794. [DOI] [PubMed] [Google Scholar]
- 35.Pfaffl M W. A new mathematical model for relative quantification in real‐time RT‐PCR. Nucleic Acids Res 200129e45. [DOI] [PMC free article] [PubMed] [Google Scholar]
- 36.Suzuki H, Masaoka T, Hosoda H.et al Helicobacter pylori infection modifies gastric and plasma ghrelin dynamics in Mongolian gerbils. Gut 200453187–194. [DOI] [PMC free article] [PubMed] [Google Scholar]
- 37.Shimizu Y, Nagaya N, Isobe T.et al Increased plasma ghrelin level in lung cancer cachexia. Clin Cancer Res 20039774–778. [PubMed] [Google Scholar]


