

Abstract
The sustained negative blood oxygenation level-dependent (BOLD) response in functional MRI is observed universally, but its interpretation is controversial. The origin of the negative response is of fundamental importance because it could provide a measurement of neural deactivation. However, a substantial component of the negative response may be due to a non-neural hemodynamic artifact. To distinguish these possibilities, we have measured evoked BOLD, cerebral blood flow (CBF), and oxygen metabolism responses to a fixed visual stimulus from two different baseline conditions. One is a normal resting baseline and the other is a lower baseline induced by a sustained negative response. For both baseline conditions, CBF and oxygen metabolism responses reach the same peak amplitude. Consequently, evoked responses from the negative baseline are larger than those from the resting baseline. The larger metabolic response from negative baseline presumably reflects a greater neural response that is required to reach the same peak amplitude as that from resting baseline. Furthermore, the ratio of CBF to oxygen metabolism remains approximately the same from both baseline states (∼2:1). This tight coupling between hemodynamic and metabolic components implies that the magnitude of any hemodynamic artifact is inconsequential. We conclude that the negative response is a functionally significant index of neural deactivation in early visual cortex.
Introduction
Functional magnetic resonance imaging (fMRI) allows non-invasive mapping of neural activity in the human and animal brain with high spatial specificity. Neural activation is typically inferred from the coupling between the positive component of the blood oxygenation level dependent (BOLD) response and underlying neural activity (Logothetis et al., 2001). In principle, fMRI measurements may also be sensitive to neural deactivation inferred from negative BOLD responses. Cortical mapping of deactivated neuronal populations using the negative response could provide important insights regarding the functional and anatomical organization of suppressive or inhibitory circuits throughout the cerebral cortex. However, the exact nature of the relationship between the negative response and neural deactivation is complicated by observations of a possible artifactual component that may originate from hemodynamic changes unrelated to local neural activity (Harel et al., 2002; Shmuel et al., 2002; Kannurpatti and Biswal, 2004; Devor et al., 2005; Shmuel et al., 2006). This possibility makes it difficult to interpret the negative response in terms of reduced neural activity. If the negative response originates instead from non-neural factors, its utility in fMRI is severely limited and potentially misleading.
The origin of the negative response has been explored most extensively in the human, macaque, and cat visual systems (Harel et al., 2002; Shmuel et al., 2002; Shmuel et al., 2006). One general observation is that stimulation of part of the visual field evokes a positive response in retinotopic areas of early visual cortex, while negative responses are evoked in surrounding unstimulated cortex (Shmuel et al., 2002; Hansen et al., 2004; Shmuel et al., 2006). Recent work demonstrates that decreases from baseline in oxygen metabolism (Shmuel et al., 2002) and neural activity (Shmuel et al., 2006) can account for a major component (>60%) of these sustained negative responses. However, a substantial contribution from a non-neural component cannot be ruled out. This non-neural component could be due to an artifactual hemodynamic mechanism. For example, “blood steal” may redirect blood flow to the activated region, away from adjacent inactive regions (Woolsey et al., 1996).
The specific basis of the negative response therefore remains unclear. It is important to determine if the remainder of the 60% proportion noted above is due to neural or artifactual factors. If the remaining component can also be accounted for by a neurometabolic origin, then interpretation of the negative response will be greatly simplified. We have therefore quantified the relative contributions of oxygen metabolism and non-neural components by determining the effect of a lowered baseline caused by a negative BOLD response on the positive response evoked within a given cortical region as illustrated in Figure 1. If the negative response has a non-neural origin, then the increment (baseline to peak amplitude) of the neural response to a given stimulus should not differ between the ‘negative (low) baseline’ and the ‘resting (high) baseline’. Larger incremental changes for BOLD and CBF, but not for neural and CMRO2 responses, would reveal an uncoupling of CMRO2 and CBF as depicted in Figure 1B. The uncoupling between metabolic and hemodynamic components could then be used to isolate a non-neural artifactual contribution to the negative response.
Figure 1.
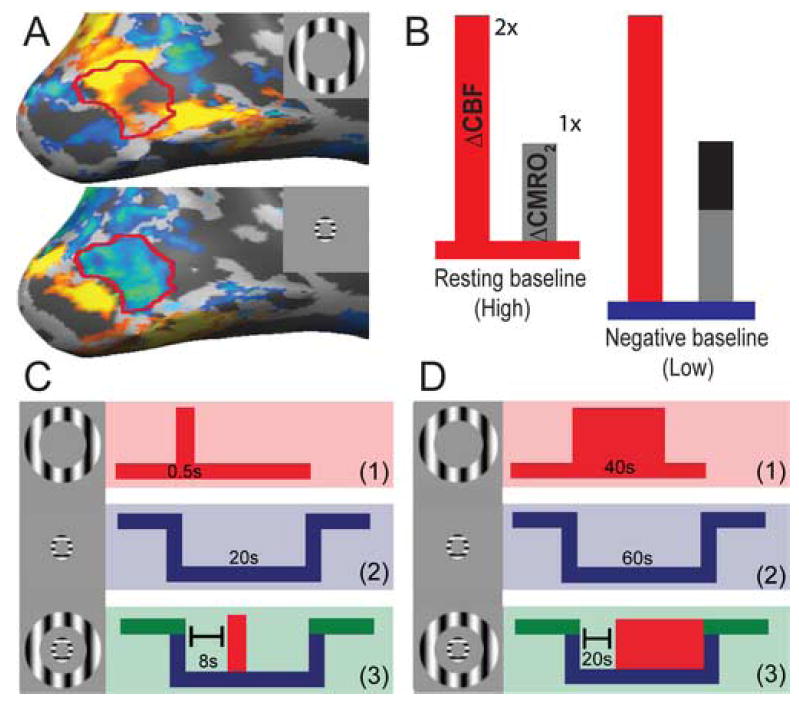
Stimulation protocol and V1 retinotopy of visual stimuli. (A) Annular stimuli generate retinotopic positive and negative responses in V1, shown overlaid on a medial view of an inflated cortical hemisphere. A parafoveal annulus generates a strong negative response in a region of interest (red outline) anterior to the evoked positive response (bottom), while a peripheral annulus evokes a positive response within this same anterior area (top). (B) This diagram represents possible coupling ratios between evoked CBF (red increment) and CMRO2 (gray/black increment) from resting (left) and negative (right) baselines. From resting baseline, evoked CBF and CMRO2 are coupled in a ∼2:1 ratio. From negative baseline, this ratio might increase if the relative CBF response is larger, but the relative CMRO2 response (gray increment) does not differ from resting baseline. Alternatively, the coupling ratio might remain ∼2:1 if CMRO2 also increases (gray + black increment) from negative baseline. While the former outcome would reveal an uncoupling of CBF and CMRO2, presumably related to the non-neural component of the negative response, the latter outcome would reveal that hemodynamic and oxygen metabolism responses remain tightly coupled, indicating a neural origin for the negative response. Δ stands for “change”. (C, D) The initial BOLD (C) and calibrated fMRI (D) experiments contained three conditions: (1) a “positive” condition to induce a positive evoked response in the region (top row), (2) a “negative” condition to induce a steady-state negative response in the same region (middle row), and (3) a “combined” condition to induce a positive response from a negative baseline (bottom row).
On the other hand, if the negative response is due mainly to reduced neural activity, then a larger incremental neural response will be required to reach the same final level of evoked neural activity from the lower negative baseline (Hyder et al., 2002; Uludag et al., 2004). Because of neurometabolic and neurovascular coupling, a larger incremental neural response from the negative baseline should be reflected by larger increments in the cerebral metabolic rate of oxygen consumption (CMRO2), cerebral blood flow (CBF), and BOLD signals. We therefore determined a quantitative coupling ratio for metabolic and hemodynamic components by estimating the ratio of evoked CBF to CMRO2 from both resting and negative baseline states. Our results show that CBF and CMRO2 remain precisely coupled during both baseline states, indicating that the oxygen metabolism component accounts for essentially the entire negative response in early visual cortex.
Materials and Methods
Subjects
Two subjects (19-20 years of age, female) participated in an initial BOLD experiment and six subjects (20-27 years of age, 3 males) participated in the combined BOLD and CBF fMRI experiment [i.e., ‘calibrated fMRI’ (Davis et al., 1998)] that was used to estimate CMRO2. All procedures were approved by the Committee for the Protection of Human Subjects at the University of California, Berkeley.
MRI data acquisition
Briefly, imaging data were acquired with a Varian (Palo Alto, CA) Unity-Inova 4T scanner. T2*-weighted BOLD images were collected with a two-shot echo planar imaging (EPI) sequence and CBF imaging was performed using a flow-sensitive alternating inversion recovery (FAIR) sequence. Systematic errors in CBF quantitation arise with the FAIR technique because the bolus of labeled blood is poorly defined (e.g., due to sensitivity to variable transit delays in the delivery of tagged blood to the imaging slice) (Wong et al., 1997). However, in the context of the current study, potential systematic errors are present across all experimental conditions and are therefore unlikely to bias our results. To collect combined BOLD and CBF data for CMRO2 calculation, BOLD and FAIR runs were interleaved within the same experimental session, using the same imaging slice and resolution.
The parameters for BOLD and FAIR imaging were as follows:
1) Initial BOLD experiment: in-plane resolution = 2 × 2 mm2 , slice thickness = 3mm, field of view [FOV] = 12.8 × 12.8 cm2, matrix size = 64 × 64; TR = 0.5s [1s per volume], TE = 28 ms, flip angle = 20°, 13 oblique axial slices, parallel to the calcarine sulcus;
2) Calibrated fMRI: BOLD: in-plane resolution = 3.125 × 3.125 mm2, slice thickness = 7mm, FOV = 20 × 20 cm2, matrix size = 64 × 64; TR = 2s, TE = 28 ms, flip angle = 20°, 1 axial slice, centered on and parallel to the calcarine sulcus. FAIR: partial k-space, single shot EPI image acquisition, TR = 3s [6s per FAIR image], TI = 1.7s, TE = 11 ms, excitation flip angle = 90°, inversion slice thickness = 20mm. Crusher gradients (b = 0.0382 s/mm2) were applied along the slice selective dimension to minimize large vessel artifacts.
The initial 10-12s of BOLD and FAIR data were discarded to allow longitudinal magnetization to reach steady-state, and an initial volume without phase encoding was acquired for Nyquist ghost correction. Coregistered anatomical images were acquired with a T1-weighted GEMS sequence.
Visual stimulus and task
Stimuli were generated using custom-built software and projected onto a backlit translucent screen mounted above the subject's chest and viewed through a mirror positioned on the head coil above the subject's eyes. To control attention and fixation across the length of the scan, subjects performed a continuous task to detect luminance decrements of a fixation cross presented against a blank gray background.
We measured responses to (1) “positive”, (2) “negative”, and (3) “combined” (positive plus negative) stimulus conditions (Fig 1C, D). A foveally presented annular sinusoidal grating was used as the “negative” stimulus (2-3° eccentricity, drift temporal frequency = 6Hz, spatial frequency = 1 cycle/°, 80% contrast). This stimulus generated a robust, steady-state negative response in an anterior region of V1 (Fig. 1A). To generate a positive evoked response within this same anterior V1 region, we used as our “positive” stimulus a peripheral annular grating (10-11° eccentricity, drift temporal frequency = 6Hz, spatial frequency = 1 cycle/°). Note that this stimulus was presented at 25% contrast in order to avoid saturation effects associated with maximal neural and hemodynamic responses that might confound our measurements of evoked amplitude. The grating orientations of both annuli switched between 0 and 90 degrees once per second in order to minimize neural adaptation, such that the two annuli maintained orthogonal orientations. For the “combined” stimulus condition, we delayed the onset of the positive stimulus relative to that of the negative stimulus, in order to induce a steady-state negative baseline (8s delay for the initial BOLD experiment, 20s delay for calibrated fMRI; Fig. 1C, D). Individual trials were separated by an inter-trial-interval, during which only the fixation cross and the blank gray background were present (13-15s duration for the initial BOLD experiment, 30s for calibrated fMRI). For the initial BOLD experiment, two runs (28 trials per run) were used for localization and response estimation of the positive stimulus, and six runs (2-4 trials per condition per run) were used to estimate responses to the negative and combined conditions. For calibrated fMRI, each run included two repeats of each condition and a total of two BOLD runs were randomly interleaved among 4-5 FAIR runs in order to collect coregistered CBF and BOLD data during the same scan session. An additional calibrated fMRI experiment with a 90s interstimulus interval was run on one subject in order to verify that our baseline measurements were not confounded by the undershoot from the previous trial (see Supplementary Results).
We note that at the eccentricities and stimulus distances used in this study, weak psychophysical and neural center-surround interactions may exist (Walker et al., 1999; Angelucci et al., 2002; Series et al.). Center-surround interactions in the periphery appear to be stronger for parallel compared to orthogonally oriented stimuli (Xing and Heeger, 2000). Although pilot experiments revealed no difference between parallel and orthogonal orientations, we chose to use only orthogonal orientations in order to minimize any potential lateral interactions that might confound our measurements of evoked amplitudes during the combined condition.
Data processing and analysis
Image analysis was performed using custom routines written in Matlab (Mathworks, Inc., Natick, MA). Motion correction was performed with McFLIRT (Jenkinson et al., 2002). FAIR images were constructed as the difference between consecutive slice-selective inversion recovery and non-selective inversion recovery (nsIR) images and then normalized for BOLD contamination by dividing by the nsIR image (which contains T2* contributions even at short TE=11ms). A high pass filter was applied to the BOLD time series at each voxel to remove linear trends resulting from slow signal drift.
The calcarine sulcus was used to delineate primary visual cortex on coregistered anatomical images and fMRI voxels falling within this boundary were selected for further analysis. Regions of interest (ROIs) were constructed by first cross-correlating the voxel time series with the stimulus protocol convolved with a model of the hemodynamic response (Boynton et al., 1996). An initial ‘negative’ ROI was defined to include voxels with a significant negative correlation to the presentation of the foveal annulus, while a ‘positive’ ROI was defined to include voxels with a significant positive correlation to the peripheral annulus. Significance was generally defined at the p<.0001 level for BOLD (p<.01 for FAIR), and varying the threshold provided qualitatively similar results. Final ROIs were constructed from the logical intersection of voxels within the positive and negative ROIs. Our analysis thus included V1 regions that exhibited both positive and negative responses within the same voxel, allowing us to compare these individual responses to the combined response.
For the initial BOLD experiment, voxel time series for repeated trials were converted to percent signal change relative to the baseline period (defined as the 4 seconds preceding the onset of the stimulus), and individual trial responses for each stimulus condition were then averaged together. For each subject, the percent change for the positive response was taken as the average of the maximum amplitudes for each individual voxel within a 3-8 second window following stimulus onset. The maximum amplitude for each voxel was not constrained to a single time point, given that the transient peak of the positive response is likely to vary somewhat across voxels and subjects, Next, the percent change for the steady-state negative response was taken as the mean response during this same temporal window. Because this was a steady-state measurement, the same temporal window was used for all voxels. Analysis of the calibrated fMRI experiment followed a similar procedure with the following modifications: (1) the baseline period for calculating percent signal change was extended to 8 and 12 seconds prior to stimulus onset for BOLD and FAIR, respectively, (2) data points used to calculate steady-state mean responses excluded the first 8 or 12 seconds post-stimulus for BOLD or FAIR, respectively, in order to exclude transient signal changes, and (3) outlier data points whose values fell more than one interquartile range beyond the first and third quartiles were excluded. Note that these outliers were not removed for presentation of the time courses.
CMRO2 calculation and error analysis
BOLD and CBF measurements were used to calculate CMRO2 using the deoxyhemoglobin dilution model (Davis et al., 1998; Hoge et al., 1999). The sensitivity of this model to changes in CMRO2 has been demonstrated directly by use of graded levels of hypercapnia during a range of visual stimulation intensities (Hoge et al., 1999). The model describes a quantitative, steady-state relationship between BOLD, CBF, and CMRO2 as follows:
where the subscript “0” denotes baseline, and α, β, and M are unknown parameters that must be estimated. First, the parameter α is a scaling exponent in a power-law relationship between fractional changes in blood flow and blood volume that was experimentally determined to be 0.38 during steady-state conditions (Grubb et al., 1974; Lee et al., 2001; Kennerley et al., 2005). The second model parameter β is an exponent denoting how the transverse relaxation rate due to deoxyhemogobin depends on the size of the blood vessels within a tissue sample. Numerical simulations for a field strength of 1.5T show this value to be 1.5 (Boxerman et al., 1995). Finally, the parameter M is required to calibrate the fractional BOLD signal change, , against the baseline level of deoxyhemoglobin. The BOLD signal change depends on washout of this deoxyhemoglobin, and so M can be thought of as the maximum BOLD signal change that would result if all deoxyhemoglobin were eliminated from the tissue sample (Davis et al., 1998). Because the proportionality of local deoxyhemoglobin content to the BOLD signal depends on technical MRI parameters such as the pulse sequence, the echo time TE, and the magnetic field, this value is normally determined by a hypercapnia calibration experiment (Davis et al., 1998; Hoge et al., 1999). Alternatively, if a hypercapnia experiment is impractical, an M value of 0.25 extrapolated from previous studies has been shown to accurately model CMRO2 changes at 4T (Uludag et al., 2004). Because of the uncertainty in these three model parameters, we examined the robustness of our CMRO2 estimates by varying these parameters within a wide range of values: (1) α: -1 to 0.4, (2) β: 1 to 1.6, and (3) M: 0.15 to 0.45. We used a range of values based on previously published simulations (i.e., Uludag et al., 2004) and on reasonable physiological assumptions. For the Grubb parameter α, we tested extreme negative values given the observation that CBV can increase while CBF decreases during extreme physiological conditions (see Zaharchuk et al., 1999). For the parameter β, we followed the modeling of Boxerman et. al. (1995). The parameter β is constrained between 1 and 2 and is thought to approach 1 for higher field strengths (4T in the current study) where the BOLD signal has mainly extravascular contributions. Thus, we tested the range 1 to 1.6. Finally, the value of M is thought to be higher at higher field strengths, so the upper range of this parameter was extended to 0.45. M=0.15 is typically used at 1.5T field strength, and this was our lower limit. All possible permutations of the three parameters were computed and then analyzed for potential deviations. Aside from this error analysis, all reported CMRO2 calculations used α = 0.38, β = 1.5, and M = 0.25. Last, to calculate uncertainty in the CBF:CMRO2 ratio, errors were propagated (Bevington, 1969) from standard errors of the mean in the group CBF and CMRO2 data.
Results
Relative positive BOLD amplitude depends on baseline
To determine if the amplitude of the positive BOLD response differs for resting and negative baseline states, we measured responses to (1) “positive”, (2) “negative”, and (3) “combined” (positive plus negative) conditions. Positive and negative responses can be generated in the same overlapping region of primary visual cortex using annular stimuli presented in peripheral and parafoveal visual field regions, respectively (Fig. 1A). We selected visual field eccentricities that maximized the spatial overlap of combined positive and negative responses according to the retinotopic organization of primary visual cortex. First, to estimate the positive BOLD amplitude from ‘resting’ baseline, we presented a peripheral annulus that generated a positive response in an anterior region of interest in primary visual cortex (Fig. 1A, red outline). This ‘positive’ stimulus was preceded by a resting baseline period defined by the presentation of a blank gray screen. Next, to estimate the positive BOLD amplitude from negative baseline, we presented a separate foveal annulus prior to the positive stimulus. This foveal stimulus induced a strong, steady-state negative response that overlapped the positive response (Fig. 1A) and thus provided a measure of evoked amplitude from ‘negative’ baseline. (Fig. 1C). We then analyzed for overlapping pixels both absolute (percent change from resting baseline) and relative positive response amplitudes (percent change from each condition's own respective baseline, i.e., resting or negative levels).
Figure 2a shows the averaged BOLD time courses for positive, negative, and combined stimulus conditions. From the negative baseline, we find evidence for a reduced absolute positive response amplitude, although this difference does not reach significance for the two subjects tested (two-tailed t-test, p<0.15) (Fig. 2B). In contrast, the relative amplitude evoked from the negative baseline is significantly larger (∼36%) than that from the resting baseline (two-tailed t-test, p<0.02) (Fig. 2B).
Figure 2.
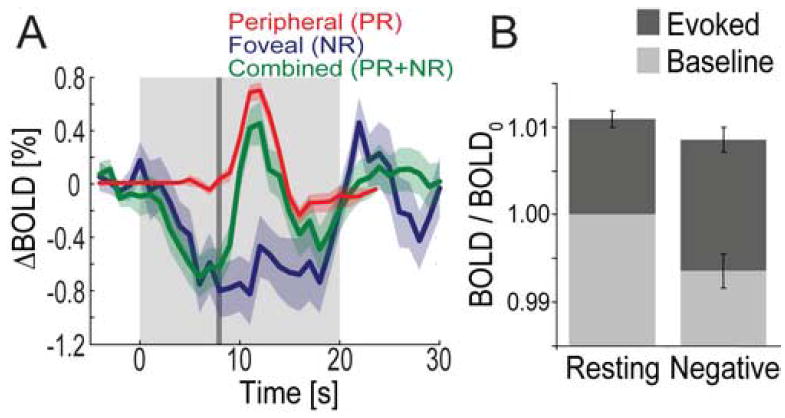
Relative BOLD response amplitude is larger from negative baseline. (A) Group averaged responses in the initial BOLD experiment (N=2). The light gray shaded region indicates the stimulus onset and duration for the foveal stimulus (negative-inducing, NR), and the dark gray region delineates the presentation of the peripheral stimulus (positive-inducing, PR). The shaded curves represent ±1 SEM. (B), Baseline and evoked BOLD signals for resting and negative baseline states. All signals are normalized to the resting state signal. Error bars represent ±1 SEM. See Methods, Data analysis and processing, for differences in the analyses of the mean time course (A) and the mean normalized response (B)
There are two plausible contributions to the larger relative BOLD change from negative baseline (Fig. 1B). First, the additional BOLD increase could originate from a hemodynamic component of the negative response that is eliminated when an overlapping positive response is evoked. For instance, it is thought that a blood steal mechanism may contribute to the negative response by redirecting blood flow to the activated region, away from adjacent inactive regions (Woolsey et al., 1996; Shmuel et al., 2002). However, a positive response evoked simultaneously within the inactive region may disable such a mechanism, thereby eliminating the CBF reduction. In this case, the larger BOLD increase will result from the sum of the usual evoked response and the “removal” of this blood steal component. The second possibility is that the incremental neural response from negative baseline is larger than that from resting baseline. In this case, the larger increment in neural response will be reflected as larger relative CMRO2, CBF, and BOLD responses. This latter mechanism is expected if the negative response is caused by a lower level of neural activity, because a greater incremental change may be required to reach a given intensity of evoked neural activity (Hyder et al., 2002; Uludag et al., 2004).
Relative positive CBF and CMRO2 amplitudes depend on baseline
To obtain estimates of the CBF: CMRO2 ratio, we used an established model of the BOLD signal (Davis et al., 1998; Hoge et al., 1999) (see Materials and Methods). The advantage of this model is that combined fMRI measurements of BOLD and CBF can be made and used to calculate the CMRO2 response. This allowed us to determine if CMRO2 was uncoupled from CBF and BOLD responses as predicted by the blood steal hypothesis, or if CMRO2 exhibited a larger increment from negative baseline as predicted by the neural origin hypothesis.
Figure 3A shows typical positive and negative activation patterns for BOLD and CBF, demonstrating the substantial spatial overlap between the two imaging contrasts, while Figure 3B shows the temporal response for each stimulus condition averaged across all subjects. Figure 3C shows the estimated CMRO2 responses and the mean, steady-state signals obtained from BOLD and CBF measurements. From these data we first examined responses to the negative stimulus. Consistent with previous findings in the visual cortex (Shmuel et al., 2002), BOLD, CBF, and CMRO2 all decreased, and the reduction in CBF (∼ -11%) was larger than that for CMRO2 (∼ -7%). We next compared positive responses evoked from resting and negative baselines. Absolute responses for BOLD, CBF, and CMRO2 were virtually equivalent between the two baseline states (two-tailed paired t-test; BOLD: p>0.30, CBF: p>0.60, CMRO2: p>0.75), although we again observed a strong trend for a reduced absolute BOLD amplitude from negative baseline, similar to our initial BOLD experiment. If absolute amplitudes remain essentially unchanged, it follows that relative amplitudes must increase from the lower negative baseline. This was verified by statistical tests (one-tailed paired t-tests) revealing significantly larger relative signal changes from negative baseline for BOLD (p<0.05), CBF (p < 5 × 10⁻⁵), and CMRO2 (p< 5 × 10⁻⁶).
Figure 3.
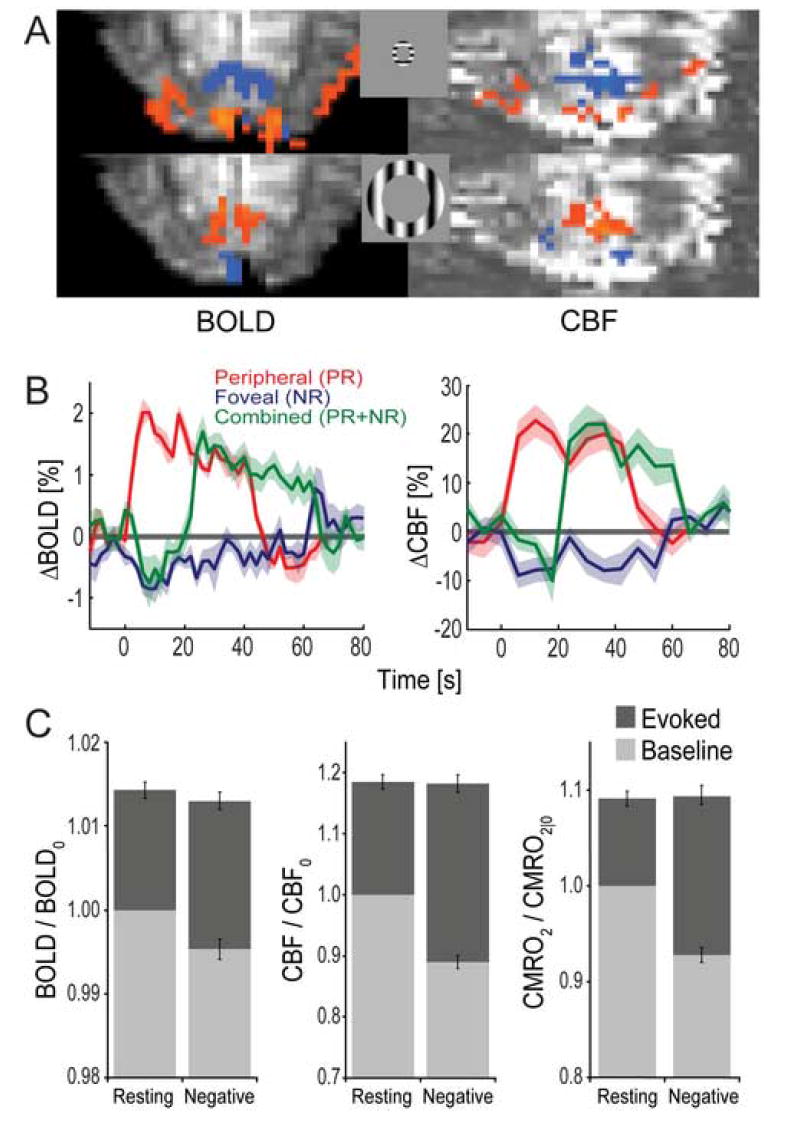
Evoked BOLD, CBF, and CMRO2 responses increase by a larger increment from negative baseline. (A) Positive (orange) and negative (blue) BOLD and CBF activation patterns to the foveal and peripheral annuli for a representative subject. (B) Group averaged responses for BOLD (left) and CBF (right). The shaded curves represent ±1 SEM. (C) Group averaged baseline and evoked BOLD, CBF, and CMRO2 responses for resting and negative baseline states. All responses are normalized to the resting state level. Outlier data points falling more than one interquartile range beyond the first and third quartiles were omitted. The CBF amplitudes including outliers were as follows: 17.7% for the positive response from resting baseline, -5.5% for the negative response, and 17.5% for the positive response from negative baseline. Note that these outliers were not removed for presentation of the time courses in (B). Error bars represent ±1 SEM.
The finding that the incremental CMRO2 response is larger from negative baseline is important in two ways. First, because the intensity of the positive stimulus is the same for both baseline states, the most likely explanation for the greater CMRO2 increase is that the negative response actually reflects a reduction in neural activity. This means that a larger incremental response is required to reach the same final level of evoked activity. Second, despite larger relative changes from negative baseline, the coupling ratio between evoked CBF and CMRO2 remains ∼2:1 from both resting (2.0±0.3 SEM) and negative (1.8±0.2 SEM) baseline states (for reports of similar ratios in visual or motor cortex, see Hoge et al., 1999; Shmuel et al., 2002; Stefanovic et al., 2004). Significantly, in the presence of a substantial non-neural hemodynamic contribution to negative baseline, the CBF:CMRO2 coupling ratio should increase, because an additional part of the CBF response would be uncoupled and independent from local changes in CMRO2. In contrast, our model calculations show that this ratio does not increase for negative baseline (one-tailed paired t-test; p>0.9; 95% confidence interval for the resting – negative ratio difference = [+.11, +.44] ), suggesting that the entire CBF and BOLD increase is accounted for by a neurometabolic origin. Since we observe virtually equivalent coupling ratios for both baselines, the magnitude of a non-neural component is likely to be no greater than the error inherent in our experimental measurements and in the model.
To determine whether this conclusion depends on the uncertainty in the model parameters, we simulated a wide range of physiologically plausible values (see Materials and Methods). For every permutation, the coupling ratio either remained equivalent between baselines or even decreased for the negative baseline. A lower value for the CBF: CMRO2 ratio indicates that the relative CBF component is actually smaller, which is inconsistent with an extraneous CBF contribution to negative baseline. Thus, varying the model parameters across a wide range fails to reveal the presence of a non-neural CBF component to the negative response. We also considered the possibility that the relationship between blood flow and blood volume is altered during the negative response. In the framework of the present model, blood volume is not measured directly, but rather derived from measurements of CBF according to Grubb's relationship: CBV = CBFα (Grubb et al., 1974). Across a wide range of methodologies, a value of 0.38 for α has been found to accurately describe the flow-volume relationship (Grubb et al., 1974; Zaharchuk et al., 1999; Lee et al., 2001; Kennerley et al., 2005). However, Zaharchuk et. al. (1999) showed that during mild and severe hemorrhagic hypotension, CBF decreases are accompanied by an increase in total blood volume that is more accurately described by an α value of ∼ -0.3. Based on the possibility that the flow-volume relationship exhibits a similar mismatch during the negative baseline, we repeated our error analysis allowing α to change during the negative response, with values ranging down to an extreme of -1 (e.g., blood volume increases by ∼11% when CBF decreases by 10%). In the current model, negative values for α have the effect of amplifying the estimated CMRO2 decrease during the negative response (see the model equation in Materials and Methods), leaving even less room for a non-neural CBF component. Accordingly, this additional analysis revealed only cases where the CBF: CMRO2 coupling ratio was lower for negative baseline, a result that is inconsistent with an extraneous non-neural CBF component. Given these observations and the insensitivity of our results to uncertainty in the model, our data therefore imply that putative artifactual components to the negative response in early visual cortex do not substantially contribute to measured fMRI responses.
Discussion
The exact relationship between the sustained negative fMRI response and underlying neural activity has remained controversial. Previous work has considered both neurometabolic (Shmuel et al., 2002; Shmuel et al., 2006) and hemodynamic (Harel et al., 2002; Shmuel et al., 2002; Devor et al., 2005) contributions to the negative response. In this study, we distinguished between these two components by characterizing the effects of a negative baseline on spatially overlapping positive responses. We find that the relative positive response amplitude is larger from negative baseline compared to resting baseline and that this increase is fully accounted for by a larger evoked CMRO2 response. The tight coupling between evoked CBF and CMRO2 during negative baseline further establishes the negative response as a functionally significant index of neural deactivation in early visual cortex.
Our results indicate that the coupling of evoked CBF and CMRO2 responses does not change if induced from a steady-state negative baseline condition. Instead the CBF: CMRO2 ratio remains ∼2:1 for both baselines (see also Hoge et al., 1999; Uludag et al., 2004), whereas it should increase in the presence of a significant non-neural CBF contribution. Our comparison of ratios between baselines is valid if the relationship between CBF and BOLD increments is approximately linear from both baseline states (see Hoge et al., 1999). On the other hand, the negative baseline CBF:CMRO2 ratio could be underestimated if the relationship between positive BOLD-CBF responses is altered during negative baseline (i.e., if a larger BOLD increment results from the same change in CMRO2 and CBF). However, we explicitly used a low contrast positive stimulus to insure that evoked responses remained within the expected linear regime in the BOLD-CBF relationship (Hoge et al., 1999) in order to avoid nonlinear BOLD saturation or expansion effects. Accordingly, the positive and negative percent changes observed in the current study (Table 1) are well within the linear regime of BOLD, CBF, CMRO2 and neural responses observed during combined fMRI and neural recordings (Hyder et al., 2002; Smith et al., 2002). Our data therefore imply that the entire CBF increase is accounted for by the CMRO2 increase, leaving essentially no room for a non-neural CBF contribution, such as “blood steal”. Importantly, this result complements conservative estimates of the neural component (>60%) that are based on comparing the ratios of positive and negative BOLD amplitudes to the associated changes in neural activity (Shmuel et al., 2006). In our study, we compared ratios of positive CBF/CMRO2 changes from two different baselines. Our estimate of the neural component thus avoids uncertainty in whether the positive and negative responses possess the same coupling to underlying neural activity.
Table 1.
Percent signal changes for single subjects in the BOLD/CBF fMRI experiment. ‘Pos’ denotes the positive evoked % signal change from resting baseline, ‘Cmb’ denotes the positive % signal change from negative baseline during the ‘Combined’ condition, and ‘Neg’ denotes the negative response itself. All percent signal changes are absolute (i.e., calculated relative to the resting baseline signal level), except ‘relCmb’, which is the relative % signal change calculated with respect to the negative baseline.
| BOLD | CBF | CMRO2 | ||||||||||
|---|---|---|---|---|---|---|---|---|---|---|---|---|
| Subject | Cmb | relCmb | Pos | Neg | Cmb | relCmb | Pos | Neg | Cmb | relCmb | Pos | Neg |
| S1 | 1.30 | 1.65 | 1.83 | -0.35 | 21.13 | 28.01 | 21.26 | -6.88 | 11.34 | 15.64 | 9.77 | -4.30 |
| S2 | 1.17 | 1.91 | 1.22 | -0.75 | 14.32 | 26.10 | 14.29 | -11.78 | 7.04 | 14.17 | 6.85 | -7.13 |
| S3 | 1.28 | 2.15 | 1.29 | -0.87 | 22.35 | 34.11 | 21.14 | -11.76 | 12.24 | 19.06 | 11.40 | -6.82 |
| S4 | 1.37 | 1.87 | 1.57 | -0.51 | 13.44 | 27.43 | 15.55 | -13.98 | 5.83 | 15.27 | 6.68 | -9.44 |
| S5 | 0.97 | 1.18 | 1.20 | -0.21 | 18.89 | 27.66 | 18.11 | -8.76 | 10.82 | 16.93 | 9.58 | -6.10 |
| S6 | 1.71 | 1.85 | 1.45 | -0.13 | 19.12 | 32.11 | 20.64 | -12.99 | 8.69 | 18.23 | 10.55 | -9.54 |
|
|
|
|
|
|||||||||
| Mean | 1.30 | 1.77 | 1.43 | -0.47 | 18.21 | 29.24 | 18.50 | -11.03 | 9.33 | 16.55 | 9.14 | -7.22 |
| SEM | 0.10 | 0.13 | 0.10 | 0.12 | 1.47 | 1.28 | 1.23 | 1.10 | 1.04 | 0.76 | 0.80 | 0.82 |
The finding of greater relative evoked responses from the negative baseline is also consistent with previous studies of the effect of baseline physiology on evoked responses (Hyder et al., 2002; Uludag et al., 2004). These studies compared responses evoked from low and high baselines, using either anesthesia (Hyder et al., 2002) or blocked visual input (Uludag et al., 2004) to reduce neural activity. In both cases, the absolute evoked response was found to obtain the same final level of activation, while the relative evoked response was greater from the lower baseline. In our current study, using a stimulation-induced negative response to lower the baseline, we find that evoked responses follow the same pattern as found in these previous studies. This suggests that the major component of the negative response is due to a reduction of neural activity rather than an artifactual blood flow component. The observation that the evoked response reaches the same peak amplitude regardless of baseline is also consistent with the notion that the absolute level of neural activation, rather than the incremental change, is important for sensory processing (Hyder et al., 2002).
Our results indicate a primarily neural origin for the negative response in early visual cortex. However, the significance of the negative response for the underlying neural circuitry and for visual perception is unclear. Lateral inhibition via the horizontal connections appears insufficient to explain the most distant negative regions (∼12mm from the positive activation locus Shmuel et al., 2006). Alternative mechanisms may include reduced feedforward excitation from the lateral geniculate nucleus, reduced feedback input from extra-striate visual areas, or feedback-mediated inhibition via GABAergic interneurons within V1 (Shmuel et al., 2006). Given the large anatomical divergence of feedback connections (Angelucci et al., 2002), the latter mechanisms appear sufficient to explain even the most distant negative regions. Further work examining the effect of altering feedback from higher level visual areas on negative BOLD (for example, by reversible inactivation) may clarify this possibility.
Finally, it is important to investigate the basis of the negative response in other brain regions and experimental protocols. For example, variations in brain vasculature for different species, brain regions, or abnormal hemodynamic states (e.g., stroke) may produce negative fMRI signals that contain mainly non-neural hemodynamic contributions (Harel et al., 2002; Kannurpatti and Biswal, 2004; Devor et al., 2005). In addition, there is evidence that negative BOLD signals may in some cases result from very low amplitude or spatially restricted positive neural responses (Blankenburg et al., 2003; Thompson et al., 2005; Shmuel et al., 2006), although this explanation awaits further experimental verification. One interpretation is that these weak increases in neural activity still result in CMRO2 increases yet fall below the physiological threshold needed to induce a CBF response. A CMRO2 increase without a concomitant increase in CBF leads to a larger concentration of deoxyhemoglobin, and the net result is a negative BOLD signal. Determination of the full range of conditions for which the negative response directly reflects neural activity is an important requirement for successful functional mapping of suppressive and inhibitory cortical circuits.
Supplementary Material
Footnotes
Publisher's Disclaimer: This is a PDF file of an unedited manuscript that has been accepted for publication. As a service to our customers we are providing this early version of the manuscript. The manuscript will undergo copyediting, typesetting, and review of the resulting proof before it is published in its final citable form. Please note that during the production process errors may be discovered which could affect the content, and all legal disclaimers that apply to the journal pertain.
References
- Angelucci A, Levitt JB, Lund JS. Anatomical origins of the classical receptive field and modulatory surround field of single neurons in macaque visual cortical area V1. Prog Brain Res. 2002;136:373–388. doi: 10.1016/s0079-6123(02)36031-x. [DOI] [PubMed] [Google Scholar]
- Bevington PR. Data Reduction and Error Analysis for the Physical Sciences. New York: McGraw-Hill; 1969. [Google Scholar]
- Blankenburg F, Taskin B, Ruben J, Moosmann M, Ritter P, Curio G, Villringer A. Imperceptible stimuli and sensory processing impediment. Science. 2003;299:1864. doi: 10.1126/science.1080806. [DOI] [PubMed] [Google Scholar]
- Boxerman JL, Bandettini PA, Kwong KK, Baker JR, Davis TL, Rosen BR, Weisskoff RM. The intravascular contribution to fMRI signal change: Monte Carlo modeling and diffusion-weighted studies in vivo. Magn Reson Med. 1995;34:4–10. doi: 10.1002/mrm.1910340103. [DOI] [PubMed] [Google Scholar]
- Boynton GM, Engel SA, Glover GH, Heeger DJ. Linear systems analysis of functional magnetic resonance imaging in human V1. J Neurosci. 1996;16:4207–4221. doi: 10.1523/JNEUROSCI.16-13-04207.1996. [DOI] [PMC free article] [PubMed] [Google Scholar]
- Davis TL, Kwong KK, Weisskoff RM, Rosen BR. Calibrated functional MRI: mapping the dynamics of oxidative metabolism. Proc Natl Acad Sci U S A. 1998;95:1834–1839. doi: 10.1073/pnas.95.4.1834. [DOI] [PMC free article] [PubMed] [Google Scholar]
- Devor A, Ulbert I, Dunn AK, Narayanan SN, Jones SR, Andermann ML, Boas DA, Dale AM. Coupling of the cortical hemodynamic response to cortical and thalamic neuronal activity. Proc Natl Acad Sci U S A. 2005;102:3822–3827. doi: 10.1073/pnas.0407789102. [DOI] [PMC free article] [PubMed] [Google Scholar]
- Grubb RL, Jr, Raichle ME, Eichling JO, Ter-Pogossian MM. The effects of changes in PaCO2 on cerebral blood volume, blood flow, and vascular mean transit time. Stroke. 1974;5:630–639. doi: 10.1161/01.str.5.5.630. [DOI] [PubMed] [Google Scholar]
- Hansen KA, David SV, Gallant JL. Parametric reverse correlation reveals spatial linearity of retinotopic human V1 BOLD response. Neuroimage. 2004;23:233–241. doi: 10.1016/j.neuroimage.2004.05.012. [DOI] [PubMed] [Google Scholar]
- Harel N, Lee SP, Nagaoka T, Kim DS, Kim SG. Origin of negative blood oxygenation level-dependent fMRI signals. J Cereb Blood Flow Metab. 2002;22:908–917. doi: 10.1097/00004647-200208000-00002. [DOI] [PubMed] [Google Scholar]
- Hoge RD, Atkinson J, Gill B, Crelier GR, Marrett S, Pike GB. Investigation of BOLD signal dependence on cerebral blood flow and oxygen consumption: the deoxyhemoglobin dilution model. Magn Reson Med. 1999;42:849–863. doi: 10.1002/(sici)1522-2594(199911)42:5<849::aid-mrm4>3.0.co;2-z. [DOI] [PubMed] [Google Scholar]
- Hyder F, Rothman DL, Shulman RG. Total neuroenergetics support localized brain activity: implications for the interpretation of fMRI. Proc Natl Acad Sci U S A. 2002;99:10771–10776. doi: 10.1073/pnas.132272299. [DOI] [PMC free article] [PubMed] [Google Scholar]
- Jenkinson M, Bannister P, Brady M, Smith S. Improved optimization for the robust and accurate linear registration and motion correction of brain images. Neuroimage. 2002;17:825–841. doi: 10.1016/s1053-8119(02)91132-8. [DOI] [PubMed] [Google Scholar]
- Kannurpatti SS, Biswal BB. Negative functional response to sensory stimulation and its origins. J Cereb Blood Flow Metab. 2004;24:703–712. doi: 10.1097/01.WCB.0000121232.04853.46. [DOI] [PubMed] [Google Scholar]
- Kennerley AJ, Berwick J, Martindale J, Johnston D, Papadakis N, Mayhew JE. Concurrent fMRI and optical measures for the investigation of the hemodynamic response function. Magn Reson Med. 2005;54:354–365. doi: 10.1002/mrm.20511. [DOI] [PubMed] [Google Scholar]
- Lee SP, Duong TQ, Yang G, Iadecola C, Kim SG. Relative changes of cerebral arterial and venous blood volumes during increased cerebral blood flow: implications for BOLD fMRI. Magn Reson Med. 2001;45:791–800. doi: 10.1002/mrm.1107. [DOI] [PubMed] [Google Scholar]
- Logothetis NK, Pauls J, Augath M, Trinath T, Oeltermann A. Neurophysiological investigation of the basis of the fMRI signal. Nature. 2001;412:150–157. doi: 10.1038/35084005. [DOI] [PubMed] [Google Scholar]
- Series P, Lorenceau J, Fregnac Y. The “silent” surround of V1 receptive fields: theory and experiments. J Physiol Paris. 2003;97:453–474. doi: 10.1016/j.jphysparis.2004.01.023. [DOI] [PubMed] [Google Scholar]
- Shmuel A, Augath M, Oeltermann A, Logothetis NK. Negative functional MRI response correlates with decreases in neuronal activity in monkey visual area V1. Nat Neurosci. 2006 doi: 10.1038/nn1675. [DOI] [PubMed] [Google Scholar]
- Shmuel A, Yacoub E, Pfeuffer J, Van de Moortele PF, Adriany G, Hu X, Ugurbil K. Sustained negative BOLD, blood flow and oxygen consumption response and its coupling to the positive response in the human brain. Neuron. 2002;36:1195–1210. doi: 10.1016/s0896-6273(02)01061-9. [DOI] [PubMed] [Google Scholar]
- Smith AJ, Blumenfeld H, Behar KL, Rothman DL, Shulman RG, Hyder F. Cerebral energetics and spiking frequency: the neurophysiological basis of fMRI. Proc Natl Acad Sci U S A. 2002;99:10765–10770. doi: 10.1073/pnas.132272199. [DOI] [PMC free article] [PubMed] [Google Scholar]
- Stefanovic B, Warnking JM, Pike GB. Hemodynamic and metabolic responses to neuronal inhibition. Neuroimage. 2004;22:771–778. doi: 10.1016/j.neuroimage.2004.01.036. [DOI] [PubMed] [Google Scholar]
- Thompson JK, Peterson MR, Freeman RD. Separate spatial scales determine neural activity-dependent changes in tissue oxygen within central visual pathways. J Neurosci. 2005;25:9046–9058. doi: 10.1523/JNEUROSCI.2127-05.2005. [DOI] [PMC free article] [PubMed] [Google Scholar]
- Uludag K, Dubowitz DJ, Yoder EJ, Restom K, Liu TT, Buxton RB. Coupling of cerebral blood flow and oxygen consumption during physiological activation and deactivation measured with fMRI. Neuroimage. 2004;23:148–155. doi: 10.1016/j.neuroimage.2004.05.013. [DOI] [PubMed] [Google Scholar]
- Walker GA, Ohzawa I, Freeman RD. Asymmetric suppression outside the classical receptive field of the visual cortex. J Neurosci. 1999;19:10536–10553. doi: 10.1523/JNEUROSCI.19-23-10536.1999. [DOI] [PMC free article] [PubMed] [Google Scholar]
- Wong EC, Buxton RB, Frank LR. Implementation of quantitative perfusion imaging techniques for functional brain mapping using pulsed arterial spin labeling. NMR Biomed. 1997;10:237–249. doi: 10.1002/(sici)1099-1492(199706/08)10:4/5<237::aid-nbm475>3.0.co;2-x. [DOI] [PubMed] [Google Scholar]
- Woolsey TA, Rovainen CM, Cox SB, Henegar MH, Liang GE, Liu D, Moskalenko YE, Sui J, Wei L. Neuronal units linked to microvascular modules in cerebral cortex: response elements for imaging the brain. Cereb Cortex. 1996;6:647–660. doi: 10.1093/cercor/6.5.647. [DOI] [PubMed] [Google Scholar]
- Xing J, Heeger DJ. Center-surround interactions in foveal and peripheral vision. Vision Res. 2000;40:3065–3072. doi: 10.1016/s0042-6989(00)00152-8. [DOI] [PubMed] [Google Scholar]
- Zaharchuk G, Mandeville JB, Bogdanov AA, Jr, Weissleder R, Rosen BR, Marota JJ. Cerebrovascular dynamics of autoregulation and hypoperfusion. An MRI study of CBF and changes in total and microvascular cerebral blood volume during hemorrhagic hypotension. Stroke. 1999;30:2197–2204. doi: 10.1161/01.str.30.10.2197. discussion 2204-2195. [DOI] [PubMed] [Google Scholar]
Associated Data
This section collects any data citations, data availability statements, or supplementary materials included in this article.