Abstract
Fluorescence of 2-aminopurine (2AP) substituted A site and acrylamide quenching were used to study the interactions of paromomycin and neamine with the decoding region of 16S rRNA. The results reveal that paromomycin binding to the A-site RNA leads to increased exposure of residue A1492. In contrast, neamine has little effect on the solvent accessibility of A1492. Electrospray ionization mass spectrometry was used to compare the affinity of paromomycin with the A-site and 2-AP-substituted A-site RNAs.
Keywords: aminoglycoside, A-site RNA, 2-aminopurine, acrylamide quench
1. Introduction
The ability of small molecules to interact with RNA has been widely recognized over the past decade.1-5 Antibiotics are small molecules that interact with RNA in nature and inhibit prokaryotic ribosomes through a variety of mechanisms.6 Aminoglycosides are one class of antibiotics that have been used clinically to treat bacterial infections for over five decades.7 They interact with many different RNAs, including the hammerhead ribozyme,8 HIV-1 mRNA,9-11 tRNAPhe,12 the T box antiterminator RNA,13 and the 16S bacterial ribosome.14-16 The binding of aminoglycosides to bacterial ribosomes is of particular interest, since this is believed to be the clinically relevant target site. Aminoglycosides bind to the highly conserved decoding region aminoacyl-tRNA site (A site) of 16S rRNA, induce misreading of the genetic code, and inhibit protein synthesis.17, 18 In addition, the aminoglycosides preferentially target prokaryotic ribosomes over eukaryotic ribosomes.2
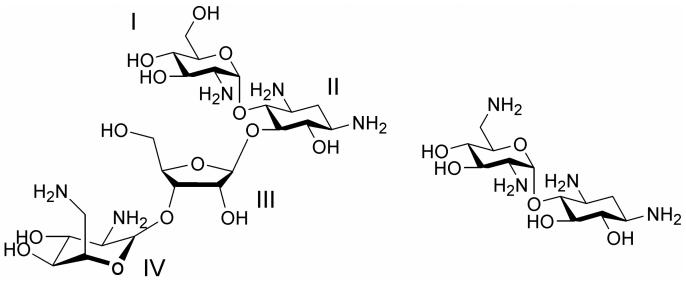
Aminoglycoside antibiotics are composed of amino sugars linked to a deoxystreptamine ring (ring II).7 The 2-deoxystreptamine-containing aminoglycosides have common functional groups on rings I and II. The chemical structures of two examples, paromomycin and neamine, are shown in Figure 1. Recent studies suggested that the minimal motif for specific binding of aminoglycosides to the A site of the ribosome is ring I and ring II (neamine core).15 In fact, several analogues based on the neamine core have comparable or better binding affinities and antimicrobial activities than the parent aminoglycosides.19, 20 Aminoglycosides interact directly with the conserved regions of ribosomal RNA. Therefore, the roles of the additional rings could increase affinity and specificity for the bacterial ribosomes. These rings and their uniquely positioned functional groups could assist in the correct orientation of rings I and II in the drug-RNA complex.14
Figure 1.
The chemical structures of paromomycin (left) and neamine (right) are shown.
High-resolution structures of the A-site RNA in the context of model systems or 30 S ribosome, free or bound to paromomycin, have been determined by X-ray crystallography and NMR spectroscopy.14-16, 21, 22 The NMR and X-ray structures all show that the binding of aminoglycosides to the 16S A-site RNA induces destacking of A1492 and A1493 (E. coli. numbering, Figure 2).14-16, 21-23 In the NMR structure of paromomycin bound to an A-site RNA fragment, A1408 is base paired with A1493. In that structure, A1493 and A1492 are slightly dislocated, but still remain partially stacked within the helix.14 In contrast, the crystal structures show these two bases flipped out of the A-site RNA helix in the presence of paromomycin.22, 24
Figure 2.
Models of the decoding region A-site RNA are shown. The RNAs are numbered based on E. coli 16S rRNA. AS is a duplex variant of the A-site RNA in which A1492 is replaced with 2-aminopurine (2AP). The region that defines the A site is boxed.26 DS is a mutant in which an additional U residue is added to pair with 2AP1492. SS is one strand of the A-site RNA. AS-hp is a hairpin variant of the A-site RNA. 2AP-AS-hp is substituted with 2AP1492.
In order to further investigate the aminoglycoside-induced A-site RNA conformational changes in solution, we incorporated 2-aminopurine (2-AP) into the RNA.25, 26 The 2-AP analogue is similar in structure to adenine, and has been widely used to investigate the conformational changes in nucleic acids due to its fluorescent properties.27, 28 It has the ability to form Watson-Crick base pairs with thymine/uridine with minimal perturbation to the helix. Acrylamide quenches fluorescence of 2-AP through a collisional mechanism and can be used to determine the level of 2-AP exposure to solvent.29, 30 In this study, acrylamide quenching was employed to observe the solvent accessibility of 2-AP at position 1492, and to investigate whether this residue is flipped out or just dislocated upon binding to aminoglycosides in solution. Stern-Volmer plots reveal that the solvent exposure of 2-AP differs in the presence of paromomycin and neamine, and the quantitative degree of solvent accessibility of 2-AP varies. Our results indicate that the binding modes of paromomycin and neamine to the 16S rRNA A site are different. It is necessary to understand how the aminoglycosides induce conformational changes upon binding to RNA to be able to discover novel antibiotics.31
2. Results and discussion
2.1 Aminoglycoside-induced conformational changes in 16S rRNA monitored by fluorescence quenching
In order to determine the solvent accessibility of 2-AP at position 1492 of the A-site RNA in the absence or presence of aminoglycosides, fluorescence emission intensities were measured in the presence of different concentrations of acrylamide. Acrylamide quenching occurs through a collisional mechanism and can provide information about the solvent exposure of 2-AP.30 First, we used Stern-Volmer plots of F0/F versus acrylamide concentration, in which F0 is the fluorescence intensity in the absence of acrylamide and F is the intensity in the presence of acrylamide. When the value of the slope is higher, 2-AP is believed to be more solvent exposed. The single–stranded (SS) oligonucleotide is very sensitive to acrylamide quenching compared to a double-stranded (DS) oligonucleotide (Figure 3A). Although there is some slight deviation from linearity in the Stern-Volmer plot for the SS RNA, these results are consistent with prior reports in which SS DNAs were used.30 Similarly, the A-site RNA (AS) with a bulge motif between A1408, A1492 and A1493 is also sensitive to acrylamide quenching (Figure 3A). The result reveals that there is more solvent exposure of 2-AP in the single-stranded oligonucleotide than in the A-site (AS) RNA. In contrast, there is no quenching observed in the double-stranded (DS) RNA due to the fact that 2-AP is base paired with uridine. To examine the specificity of aminoglycosides, control experiments were done by addition of 10 μM paromomycin to SS and DS (Figure 3B). The Stern-Volmer plots show that in the presence or absence of paromomycin, the solvent accessibility of 2-AP in the SS or DS RNAs does not change.
Figure 3.
(A) Stern-Volmer plots of F0/F versus [acrylamide] for single-stranded (SS, diamonds), double-stranded (DS, squares) and A-site (AS, circles) RNAs. (B) Stern-Volmer plots for SS and DS in the absence (closed symbols) and presence (open symbols) of 10 μM paromomycin. All experiments were carried out in triplicate. The Ksv values, determined by using Equation 1 (experimental section), are given in Table 1.
2.2 Paromomycin binding leads to A1492 base flipping and increased exposure towards acrylamide quenching
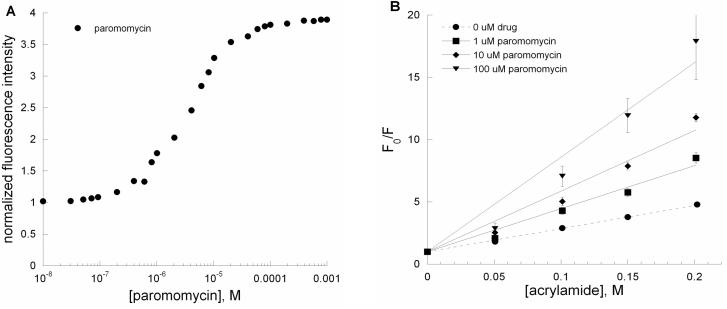
According to several recent X-ray structures, a 1:1 distribution of A1492 is oriented inside and outside of the RNA helix and A1492 is stacked on A1493 upon binding to paromomycin.22, 24, 26 In contrast, NMR results show that A1492 is just dislocated and A1493 and A1408 form hydrogen bonds upon binding to paromomycin.24 Steady-state fluorescence measurements (Figure 4A) indicate that paromomycin induces a change in the A-site structure. A significant increase (350%) in the 2-AP fluorescence intensity of the A-site (AS) RNA is observed in the presence of 0.1 to 10 μM paromomycin. If residue 1492 was just slightly dislocated, but still within the helix upon binding to paromomycin, then the Stern-Volmer plots generated from acrylamide quenching studies are expected to be similar for the A-site (AS) RNA in the presence or absence of paromomycin. The Stern-Volmer plots (Figure 4B) show that paromomycin addition at different concentrations (1, 10, 100 μM) leads to increased exposure of 2-AP relative to free AS RNA. The slight upward curvature of the Stern-Volmer plot at high paromomycin concentration indicates some heterogeneity in the system, perhaps due to secondary binding modes of paromomycin. At 100 μM concentration of paromomycin, ∼98% saturation has been reached; therefore, no adjustments were made to account for the presence of free A-site RNA. We have determined the quantitative collisional Stern-Volmer constants (Ksv) (Table 1) for AS RNA in the presence of aminoglycosides and acrylamide quencher. A larger collisional Stern-Volmer constant would indicate that 2-AP is more solvent accessible. The collisional Stern-Volmer constants for the paromomycin-rRNA complexes are 18.6 ± 0.5 M−1 (0 μM paromomycin), 34.6 ± 1.6 M−1 (1 μM paromomycin), 48.7 ± 0.2 M−1 (10 μM paromomycin), and 75.9 ± 10.7 M−1 (100 μM paromomycin). The plot shown in Figure 4B suggests that when paromomycin binds to the A-site RNA, it leads to increased exposure of A1492 (or in this case 2-AP1492), consistent with a base-flipping model.
Figure 4.
(A) A plot of normalized fluorescence at 370 nm versus [paromomycin] for AS RNA. (B) Stern-Volmer plots for F0/F versus [acrylamide] for AS RNA in the presence of paromomycin (•, ■, ◆, and ▼; 0, 1, 10 and 100 μM, respectively). The Ksv values are given in Table 1.
Table 1.
Stern-Volmer constants for single-stranded (SS), double-stranded (DS), A-site (AS) RNAs and with paromomycin and neamine.
| RNA | aminoglycoside | Ksv (M−1) |
|---|---|---|
| SS | none | 32.1 ± 2.0 |
| DS | none | 4.2 ± 0.5 |
| none | 18.6 ± 0.5 | |
| 1 μM paromomycin | 34.6 ± 1.6 | |
| AS | 10 μM paromomycin | 48.7 ± 0.2 |
| 100 μM paromomycin | 75.9 ± 10.7 | |
| 10 μM neamine | 15.6 ± 0.8 | |
| AS | 100 μM neamine | 15.3 ± 1.3 |
| 1 μM neamine | 11.7 ± 1.7 |
2.3 Neamine binding does not lead to significant A1492 base flipping
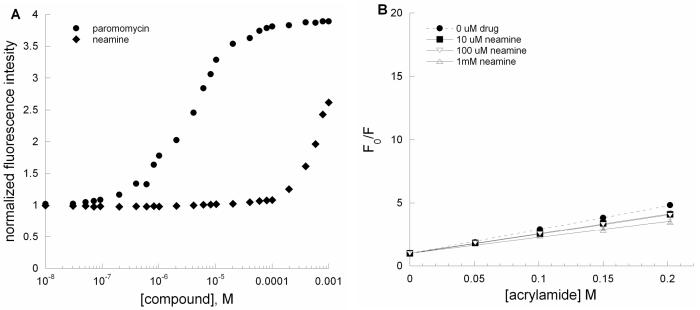
All aminoglycosides contain a neamine core; however, neamine is a poor antibiotic. Fluorescence intensity of the 2-aminopurine-modified A-site RNA increases upon binding to neamine; however, neamine does not lead to significant increases in the fluorescence intensity at low micromolar concentrations (Figure 5A). Compared to paromomycin, much higher concentrations of neamine are needed to induce a marked increase in the fluorescence intensity of AS RNA. Furthermore, the emission wavelength maxima for 2-AP are red shifted upon addition of high concentrations (>100 μM) of neamine (data not shown). Acrylamide quenching was applied to investigate whether neamine binds to the A-site model RNA in the same manner as paromomycin. Figure 5B shows the Stern-Volmer plot of the A-site RNA upon binding to different concentrations of neamine. At concentrations of 10 and 100 μM, neamine does not lead to increased solvent accessibility of 2-AP at position 1492. The collisional Stern-Volmer constants (Ksv) for the neamine-rRNA complexes are 15.6 ± 0.8 M−1 (10 μM neamine) and 15.3 ± 1.3 M−1 (100 μM neamine) and 11.7 ± 1.7 M−1 (1 mM neamine).
Figure 5.
(A) Plots of normalized fluorescence at 370 nm versus [compound] for AS RNA (•, paromomycin; ◆, neamine) of A-site RNA (AS) upon binding to paromomycin and neamine. (B) Stern-Volmer plots for F0/F versus [acrylamide] for AS RNA in the presence of neamine (•, □, ▽, and △; 0, 10, 100 and 1000 μM, respectively). The Ksv values are given in Table 1.
2.4 Comparison of paromomycin binding to A-site and 2-aminopurine A-site RNAs
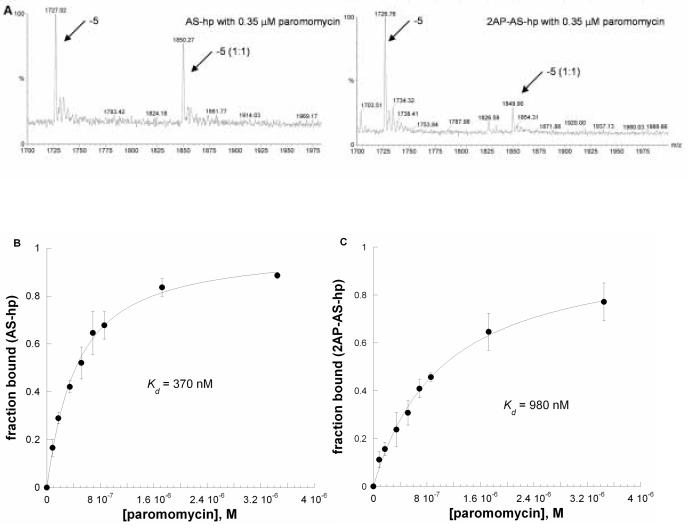
An X-ray crystal structure shows that 2AP-labeled AS RNA closely resembles the unlabeled RNA in the free RNA form, but the structure of the 2AP-RNA-antibiotic complex was not determined.26 In this study, we used electrospray ionization mass spectrometry (ESI-MS) to determine whether the 2AP-labeled RNA has a similar binding behavior as unlabeled RNA. We generated two related RNAs, AS-hp and 2AP-AS-hp, in which a hairpin A-site RNA (Figure 2) contained A1492 or 2AP-1492. The concentrations of RNAs (AS-hp and 2AP-AS-hp) were 1 μM. Each RNA was titrated with paromomycin from 85 nM to 0.35 μM. Only 1:1 binding was observed up to 800 nM of paromomycin; after addition of higher concentrations of paromomycin (> 1 μM), a small amount of 2:1 complex was observed. Two charge states (−5 and −6) of the free RNA and RNA complexes were observed over the mass range 1200−2500 m/z, and 95% of the RNA signals come from these two charge states. The peak areas for both the free RNA and the RNA complexes (plus cation adducts) were calculated. It was assumed that the free RNA and RNA complexes have similar ionization efficiencies. Equation 2 (see experimental section) was applied to obtain the apparent Kd values for each RNA and paromomycin. Figure 6A shows the spectra of AS-hp and 2AP-AS-hp with 0.35 μM paromomycin in the −5 charge state. The apparent Kds for the formation of the AS-hp or 2AP-AS-hp complexes with paromomycin are 370 ± 42 nM and 980 ± 130 nM, respectively (Figures 6B and 6C). The apparent Kd for the AS-hp with paromomycin is consistent other reported values obtained from SPR and fluorescence measurements, although different buffer conditions were used in those experiments.32, 33 From the spectra, it is clear that the 2-aminopurine-containing RNA (2AP-AS-hp) displays weaker binding to paromomycin compared to AS with adenine at position 1492 (Figure 6A). The apparent Kd values obtained from both experiments reveal that AS-hp has 2.6-fold stronger binding to paromomycin than 2AP-AS-hp.
Figure 6.
(A) ESI-MS spectra in the m/z range of 1700−2000 of for AS-hp (upper) or 2AP-AS-hp (lower) in the presence of 0.35 μM paromomycin. The 5− charge state is shown for the free RNA (−5) and complexed RNA (−5 (1:1)). (B) The results of curve fitting of A-site RNA (AS-hp) titrated with paromomycin (fraction bound versus [paromomycin]). (C) The results of curve fitting of 2AP-AS-hp titrated with paromomycin. The curves (average of three separate experiments) were fit with Equation 2.
3. Conclusions
In this study, we demonstrate that 2-aminopurine and acrylamide can be used to detect and characterize the conformational changes and solvent accessibility at position A1492 of the A-site RNA. These data indicate that the A-site RNA with the internal loop motif between A1408, A1492 and A1493 is sensitive to acrylamide and shows more solvent accessibility than the corresponding double-stranded RNA (DS). These results suggest that position A1492 of the A site is in equilibrium between extrahelical and intrahelical conformations in the absence of aminoglycosides. Upon binding to 10 μM paromomycin, the 2AP-labeled RNA shows specific changes in acrylamide accessibility at the internal loop motif. These results reveal increased exposure of A1492 upon binding by paromomycin, which is consistent with the base-flipping model.21-23 In the paromomycin and neamine comparison studies, neamine binding had little effect on acrylamide accessibility. Neamine is the core structure of all aminoglycoside antibiotics; however, neamine itself is a poor antibiotic. The Stern-Volmer constants (Ksv) indicate that paromomycin binding to the A-site RNA leads to more solvent exposure of position A1492; whereas, neamine binding has little effect. These results indicate that the binding mode of neamine is different from that of paromomycin, and also indicate that antibiotic-induced conformational changes on the A site of 16S rRNA are likely an important factor for the design of novel antibiotics. These results are consistent with other reports that show the importance of RNA dynamics and structural changes in drug targeting.31 The mass spectral results suggest that paromomycin can still bind to 2-aminopurine modified RNA, but with 2.6-fold weaker affinity compared to the natural A-site sequence. Thus, although 2AP-modified RNAs are good models for understanding RNA conformational changes upon drug binding, they may not provide accurate estimates of binding affinities.
4. Experimental section
4.1 Preparation of RNAs
All oligonucleotides were chemically synthesized by Dharmacon Research, Inc. (Lafayette, CO). The sequences of the RNAs are as follows: 5’-CAGCGUCA1408CACCACCC-3’ (A1408), 5’-CAGCGUCA1408UCACCACCC-3’ (Mod A1408), 5’-GGUGGUG(2AP1492)AGUCGCUGG-3’ (SS), 5’-GGCGUCA1408CACCUUCGGGUGA1492AGUCGCC-3’ (AS-hp) and 5’-GGCGUCA1408CACCUUCGGGUG(2AP1492)AGUCGCC-3’ (2APAS-hp), where 2AP is 2-aminopurine. The A1408 sequence is complementary to SS to form AS and Mod A1408 is complementary to SS to form DS (Figure 2A). The RNAs were purified by electrophoresis on 20% denaturing polyacrylamide gels, followed by electroelution with ½× TBE (45 mM Tris-HCl, 45 mM boric acid, 1.25 mM Na2EDTA, pH 8.3) in an Amicon centrilutor and desalted with Centricon 3 (Amicon, Billerica, MA) filtration units. The RNAs were stored in 10 mM HEPES, pH 7.4, 150 mM NaCl, 3 mM Na2EDTA. Double-stranded RNAs (AS and DS) were obtained by heating equimolar (150 μM) concentrations of complementary oligonucleotides at 75–85 °C for 1 min and snap cooling on ice. The formation of double-stranded RNA was confirmed by gel electrophoresis.
4.2 Fluorescence measurements
Fluorescence measurements were performed on an RF-5301PC spectrofluorometer (Shimadzu, Columbia, MD) at room temperature. Fluorescence emission spectra were obtained at 1 μM RNA concentration in a quartz cuvette (Starna Cells, Inc, Atascadero, CA) with 0.5 cm path length, and acquired from 330 to 450 nm with excitation at 310 nm. Slit widths of 3 nm were used in all experiments. RNA solutions were prepared in 10 mM HEPES, pH 7.4, 150 NaCl, 3 mM Na2EDTA. Aliquots of aminoglycosides were added sequentially and equilibrated with RNA for 2 min before each fluorescence measurement was taken. Fluorescence values were corrected for volume changes at each titration point.
4.3 Acrylamide titrations
Acrylamide, aminoglycosides and derivatives solutions were prepared in buffer containing 10 mM HEPES, pH 7.4, 150 mM NaCl, and 3 mM Na2EDTA. Fluorescence quenching experiments with acrylamide were carried out by addition of 8.5 M acrylamide (Molecular Biology Grade, Aldrich, St. Louis, MO) stock solutions up to a total concentration of 200 mM with 50 mM per increment. RNAs were allowed to equilibrate with acrylamide for 10 min before each measurement. For those experiments with RNA in the presence of aminoglycosides, RNA was incubated with aminoglycoside for 2 min before adding acrylamide stock solution. Fluorescence was not observed in control titrations with buffer and paromomycin or acrylamide. Changes in fluorescence were not observed upon titration of RNA (AS, DS, or SS) with buffer only.
Fluorescence quenching data were analyzed by using the Stern-Volmer equation (Equation 1),34
| 1 |
where [Q] is the acrylamide concentration, Ksv is the collisional Stern-Volmer constant, and F0 and F are the corrected fluorescence intensities of RNA in the absence and presence of acrylamide, respectively.
4.4 Mass spectrometry
All experiments were performed on a Quattro LC tandem quadrupole mass spectrometer equipped with an electrospray ionization in the negative ion mode (Micromass, Manchester, UK). The capillary voltage was 2.50 kV, cone voltage was 50 V, and extractor voltage was 2 V, a RF lens voltage was 0.6 V, source block temperature was 100 °C, and desolvation temperatures were 120 °C. The sample flow rate was 6 μL/min for all experiments via a Harvard 11 syringe pump. The mass spectra were collected from 1200−2500 m/z and 60−70 spectra were averaged for each measurement.
The 27-nucleotide decoding region RNAs, AS-hp and 2-aminopurine incorporated (2AP-AS-hp) oligonucleotides (Figure 2B), were purchased from Dharmacon Research, Inc. (Lafayette, CO) and purified by electrophoresis and electroelution. The RNAs were desalted by ethanol precipitations and stored in 100 mM ammonium acetate (Aldrich, St. Louis, MO). All RNAs were renatured by heating to 95 °C for 5 min in a heat block and slowly cooling to room temperature. The mass experiment conditions were 1 μM RNA in 150 mM ammonium acetate, 50% (v/v) isopropyl alcohol solution, and RNAs were allowed to equilibrate with paromomycin for 10 min before each measurement. The mass spectrometry data were analyzed by using the following equation (Equation 2) for simple binding,35
| 2 |
where [RL] is the concentration of 1:1 RNA complex, [R]0 is the concentration of the free RNA, [L]0 is the free paromomycin concentration and Kd is the dissociation constant.
Acknowledgements
We thank Dr. Dana Spence for use of the RF-5301PC spectrofluorometer and Dr. Shahriar Mobashery, Dr. Dusan Hesek, and Dr. Samy Meroueh for helpful discussion and supplying neamine. This research is supported by NIH (AI055496).
Footnotes
Publisher's Disclaimer: This is a PDF file of an unedited manuscript that has been accepted for publication. As a service to our customers we are providing this early version of the manuscript. The manuscript will undergo copyediting, typesetting, and review of the resulting proof before it is published in its final citable form. Please note that during the production process errors may be discovered which could affect the content, and all legal disclaimers that apply to the journal pertain.
References
- 1.Chow CS, Bogdan FM. Chem Rev. 1997;97:1489. doi: 10.1021/cr960415w. [DOI] [PubMed] [Google Scholar]
- 2.Hermann T. Angew Chem Int Ed Engl. 2000;39:1890. doi: 10.1002/1521-3773(20000602)39:11<1890::aid-anie1890>3.0.co;2-d. [DOI] [PubMed] [Google Scholar]
- 3.Hermann T. Biochimie. 2002;84:869. doi: 10.1016/s0300-9084(02)01460-8. [DOI] [PubMed] [Google Scholar]
- 4.Sucheck SJ, Wong CH. Curr Opin Chem Biol. 2000;4:678. doi: 10.1016/s1367-5931(00)00142-3. [DOI] [PubMed] [Google Scholar]
- 5.Walter F, Vicens Q, Westhof E. Curr Opin Chem Biol. 1999;3:694. doi: 10.1016/s1367-5931(99)00028-9. [DOI] [PubMed] [Google Scholar]
- 6.Xavier KA, Eder PS, Giordano T. Trends Biotechnol. 2000;18:349. doi: 10.1016/s0167-7799(00)01464-5. [DOI] [PubMed] [Google Scholar]
- 7.Wright GD, Berghuis AM, Mobashery S. Adv Exp Med Biol. 1998;456:27. [PubMed] [Google Scholar]
- 8.Tor Y, Hermann T, Westhof E. Chem Biol. 1998;5:R277. doi: 10.1016/s1074-5521(98)90286-1. [DOI] [PubMed] [Google Scholar]
- 9.Cho J, Rando RR. Biochemistry. 1999;38:8548. doi: 10.1021/bi990273a. [DOI] [PubMed] [Google Scholar]
- 10.Tok JB-H, Dunn LJ, Des Jean RC. Bioorg Med Chem Lett. 2001;11:1127. doi: 10.1016/s0960-894x(01)00149-4. [DOI] [PubMed] [Google Scholar]
- 11.Wang Y, Hamasaki K, Rando RR. Biochemistry. 1997;36:768. doi: 10.1021/bi962095g. [DOI] [PubMed] [Google Scholar]
- 12.Kirk SR, Tor Y. Bioorg Med Chem. 1999;7:1979. doi: 10.1016/s0968-0896(99)00170-4. [DOI] [PubMed] [Google Scholar]
- 13.Means JA, Hines JV. Bioorg Med Chem Lett. 2005;15:2169. doi: 10.1016/j.bmcl.2005.02.007. [DOI] [PubMed] [Google Scholar]
- 14.Fourmy D, Recht MI, Blanchard SC, Puglisi JD. Science. 1996;274:1367. doi: 10.1126/science.274.5291.1367. [DOI] [PubMed] [Google Scholar]
- 15.Fourmy D, Recht MI, Puglisi JD. J Mol Biol. 1998;277:347. doi: 10.1006/jmbi.1997.1552. [DOI] [PubMed] [Google Scholar]
- 16.Fourmy D, Yoshizawa S, Puglisi JD. J Mol Biol. 1998;277:333. doi: 10.1006/jmbi.1997.1551. [DOI] [PubMed] [Google Scholar]
- 17.Moazed D, Noller HF. Nature. 1987;327:389. doi: 10.1038/327389a0. [DOI] [PubMed] [Google Scholar]
- 18.Woodcock J, Moazed D, Cannon M, Davies J, Noller HF. EMBO J. 1991;10:3099. doi: 10.1002/j.1460-2075.1991.tb07863.x. [DOI] [PMC free article] [PubMed] [Google Scholar]
- 19.Haddad J, Kotra LP, Llano-Sotelo B, Kim C, Azucena EF, Liu M, Vakulenko SB, Chow CS, Mobashery S. J Am Chem Soc. 2002;124:3229. doi: 10.1021/ja011695m. [DOI] [PubMed] [Google Scholar]
- 20.Venot A, Swayze EE, Griffey RH, Boons GJ. Chembiochem. 2004;5:1228. doi: 10.1002/cbic.200400105. [DOI] [PubMed] [Google Scholar]
- 21.Carter AP, Clemons WM, Broderson DE, Morgan-Warren RJ, Wimberly BT, Ramakrishnan V. Nature. 2000;407:340. doi: 10.1038/35030019. [DOI] [PubMed] [Google Scholar]
- 22.Vicens Q, Westhof E. Structure. 2001;9:647. doi: 10.1016/s0969-2126(01)00629-3. [DOI] [PubMed] [Google Scholar]
- 23.Vicens Q, Westhof E. Chem Biol. 2002;9:747. doi: 10.1016/s1074-5521(02)00153-9. [DOI] [PubMed] [Google Scholar]
- 24.Lynch SR, Gonzalez RL, Puglisi JD. Structure. 2003;11:43. doi: 10.1016/s0969-2126(02)00934-6. [DOI] [PubMed] [Google Scholar]
- 25.Kaul M, Barbieri CM, Pilch DS. J Am Chem Soc. 2004;126:3447. doi: 10.1021/ja030568i. [DOI] [PubMed] [Google Scholar]
- 26.Shandrick S, Zhao Q, Han Q, Ayida BK, Takahashi M, Winters GC, Simonsen KB, Vourloumis D, Hermann T. Angew Chem Int Ed Engl. 2004;43:3177. doi: 10.1002/anie.200454217. [DOI] [PubMed] [Google Scholar]
- 27.Eritja R, Kaplan BE, Mhaskar D, Sowers LC, Petruska J, Goodman MF. Nucleic Acids Res. 1986;14:5869. doi: 10.1093/nar/14.14.5869. [DOI] [PMC free article] [PubMed] [Google Scholar]
- 28.Sowers LC, Fazakerley GV, Eritja R, Kaplan BE, Goodman MF. Proc Natl Acad Sci U S A. 1986;83:5434. doi: 10.1073/pnas.83.15.5434. [DOI] [PMC free article] [PubMed] [Google Scholar]
- 29.Yi-Brunozzi HY, Stephens OM, Beal PA. J Biol Chem. 2001;276:37827. doi: 10.1074/jbc.M106299200. [DOI] [PubMed] [Google Scholar]
- 30.Rai P, Cole TD, Thompson E, Millar DP, Linn S. Nucleic Acids Res. 2003;31:2323. doi: 10.1093/nar/gkg339. [DOI] [PMC free article] [PubMed] [Google Scholar]
- 31.Kaul M, Barbieri CM, Pilch DS. J Am Chem Soc. 2006;128:1261. doi: 10.1021/ja056159z. [DOI] [PubMed] [Google Scholar]
- 32.Blount KF, Zhao F, Hermann T, Tor Y. J Am Chem Soc. 2005;127:9818. doi: 10.1021/ja050918w. [DOI] [PubMed] [Google Scholar]
- 33.Wong CH, Hendrix M, Priestley ES, Greenberg WA. Chem Biol. 1998;5:397. doi: 10.1016/s1074-5521(98)90073-4. [DOI] [PubMed] [Google Scholar]
- 34.Lehrer SS. Biochemistry. 1971;10:3254. doi: 10.1021/bi00793a015. [DOI] [PubMed] [Google Scholar]
- 35.Bligh SWA, Haley T, Lowe PN. J Mol Recognit. 2003;16:139. doi: 10.1002/jmr.622. [DOI] [PubMed] [Google Scholar]


