Abstract
We describe a reversed-phase HPLC method that uses gradient elution and UV detection (325 nm) to determine levels of resveratrol and identify 6 major conjugated metabolites in the plasma and urine of human volunteers after administration of a single oral dose of 1 g. Waters Atlantis C18 3μ served as the stationary phase. The gradient was formed using ammonium acetate and methanol, containing 2% propan-2-ol. Detection is linear between 5 ng/mL and 500 ng/mL in plasma (5–1000 ng/mL in urine). The coefficient of variation for intra- and inter-day variation is <10%. The average recovery of resveratrol from plasma and urine is 58 ± 3%. The data presented in this report demonstrate a rapid, sensitive and accurate method for the analysis of resveratrol and its metabolites in human plasma and urine for pharmacokinetic studies.
Keywords: Resveratrol, conjugated metabolites, HPLC, Human, Plasma, Urine
1. Introduction
In recent years there has been a growing interest in trans-resveratrol (3,5,4′-trihydroxystilbene, referred to in this document as resveratrol), a phytochemical occurring naturally in high to moderate quantities in various foods including grapes [1], peanuts [2] and wine [3]. Resveratrol has antioxidant properties, and as a constituent of red wine it has been implicated in the “French Paradox” that the incidence of coronary heart disease is relatively low in southern France despite high dietary intake of saturated fats, and suggested to mediate the cancer chemoprevention properties of red wine [4]. It has also been reported to possess a variety of anti-inflammatory, anti-platelet, and both pro- and anti-estrogenic effects [5–8].
Resveratrol inhibits proliferation of a variety of cancer cell lines [reviewed in 9], formation of preneoplastic lesions in the DMBA-induced mouse mammary organ culture model [10] and benzo(a)pyrene-induced transformation of rat tracheal epithelial cells [11]. In rodent carcinogenesis models, resveratrol interfered with the formation of azoxymethane -induced aberrant crypt foci in rat colon [12], decreased the number of adenomas in the small intestine and suppressed tumor formation in the colon of APC Min+/− mice [13] although the latter finding has not been confirmed [14]. It also reduced mammary tumor formation in N-methyl-N-nitrosourea-treated rats when given at a relatively high dose (100 mg/kg) [10].
Preclinical studies in mice, rats and dogs suggest that resveratrol is readily absorbed and rapidly glucuronidated and sulfated both in the liver and in intestinal epithelial cells [15–17].
Administration of red wine to rats by intragastric intubation, resulted in measurable concentrations of resveratrol in plasma, heart, liver and kidneys [15]. In rats treated with an oral dose of 2 mg/kg resveratrol, plasma peak concentrations of 2.6 μM were achieved 10 min after dosing [18]. Experiments using radiolabelled trans-resveratrol suggest that at least 50–75% of the orally administered dose is absorbed in Wistar rats [16]. Earlier in vitro studies indicate that resveratrol readily undergoes glucuronidation and sulfation in the liver and gut of both humans and rats [19,20]. In human liver and duodenal tissue, dietary flavonoids, particularly quercetin, inhibited sulfation and glucuronidation of resveratrol; thus improving its bioavailability [20].
Resveratrol has been previously shown to be well absorbed in humans when given at levels commensurate with that available in red wine [24,29] and at low doses (25 mg orally) [27], with high phase II conjugation appearing to be the rate limiting step in resveratrol bioavailability, although no studies have been carried out at higher (gram level) doses of this compound.
As part of ongoing investigations in this laboratory into the pharmacokinetics, bioavailability and anti-oxidant effects of high dose resveratrol, our goal was to develop a protein precipitation extraction and analytical methodology that combine separation of the major metabolites of resveratrol and allows quantitation of the parent compound in a reasonably short run time. Part of the development and refinement of the analytical assay included the validation of a gradient elution HPLC assay for plasma and urine. Several methods have been published for the analysis of resveratrol and some of its metabolites[21,24–26] This method is an improvement on the UV-HPLC method developed by Zhu et al., in 1999 [21] as it allows resolution of the several human phase II metabolites of resveratrol, by direct means rather than by deconjugation, (many of which are very polar and difficult to resolve in gradient modifications of the previous method) in addition to trans-resveratrol and uses a mobile phase that can be directly transferred to LC-MSMS for identification of these metabolites. Wang et al., in 2005 [26] published an HPLC-MSMS method for identification of major metabolites in rat urine, this method identified several conjugated metabolites as well as dihydroresveratrol and its monosulfate conjugate that were found in humans by Walle et al., in 2004 [27]. This method was however not quantitative but provided structural characterisation of the metabolites of resveratrol. A recent publication by He et al., [28] presents a method for analysing resveratrol in rat plasma for pharmacokinetic analysis, although chomatographically rapid, this method does not resolve any metabolites of resveratrol and has a relatively higher limit of detection for resveratrol. The fast and non-intensive sample preparation method of protein precipitation simplifies large sample processing for clinical trials, whilst having better or comparable limits of quantitation for resveratrol (5ng/mL), and resolving the major conjugate metabolites.
2. Experimental Methods
2.1 Chemicals
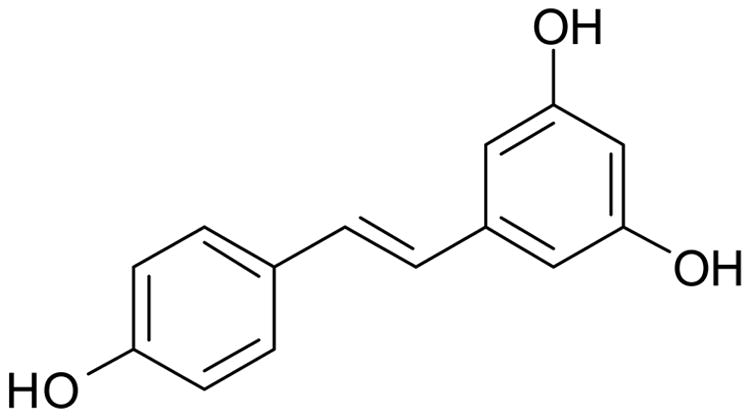
Resveratrol (99.9 %, (Fig. 1) was obtained from RoyalMount Pharma (Montreal, Canada) and the capsule preparation carried out in house. HPLC gradient grade methanol, water, ammonium acetate and hydrochloric acid were obtained from Fisher Scientific Ltd. (Loughborough, UK).
Figure 1.

Structure of resveratrol (3,5,4′-trihydroxystilbene)
2.2 Mobile-phase
The mobile phase consisted of A (aqueous)5 mM Ammonium Acetate in distilled water (pH unaltered ~6.7) containing 2 % propan-2-ol. B (organic) consisted of methanol with 2 % propan-2-ol. These solutions were degassed by sonication for 15 minutes at room temperature prior to use, and an online degassing was used during analysis. Flow rate of the mobile phase was 1 mL/minute.
2.3. Calibration solution preparation
A stock solution of resveratrol was prepared in methanol at a concentration of 1 mg/mL and stored in the dark at −20º C. Working solutions were dilutions of the stock solution in methanol down to a final concentration of 1 ng/mL. They were injected in triplicate between 5 ng/mL and 100 ng/mL and monitored by UV detection. Six standard calibration solutions of resveratrol were prepared to obtain final concentrations ranging from 0–500 ng/mL (plasma) and 0–1000 ng/mL (urine) by addition of 10 μl of standard to the appropriate matrix.
For quality control, samples were freshly prepared in triplicate over four separate days and analysed to evaluate linearity and the precision of the HPLC method by intra-day and inter-day variations.
Calibration curves were obtained by a weighted linear regression of the peak area of resveratrol against the known resveratrol concentrations. The weights were obtained from a smoothed estimate of the within-replicate standard deviations [22]. The standard errors of the estimated resveratrol concentrations were calculated by [23]:
where n1 is the number of replicates corresponding to the estimated point and n2 is the number of samples determining the calibration line. The inverses of the standard errors of the estimated concentrations were then used as weights in the calculation of r2. All estimates were computed using SAS v8.2 (SAS Institute, Cary, North Carolina).
2.4 Sample preparation
Blood was taken from 4 adult human volunteers pre- and post-resveratrol-dose (1 g oral dose taken with water) in heparinised tubes. These were centrifuged at 2000 g and the plasma separated into cryotubes for storage at −80 °C before extraction. As far as logistically possible, all extraction was carried out swiftly and away from direct light. The samples were thawed at room temperature or in the hand, whilst kept in the dark, and thoroughly mixed. The plasma was then acidified with 17.5 μl of concentrated HCl per 1 mL of plasma.
Plasma (250 μl) was pipetted into a clean 1.5 mL eppendorf tube and 250 μL of methanol was added. The sample was then vortex-mixed for 1 minute and placed at −20° C to precipitate the protein. The samples were then spun at 13,000 g in a microcentrifuge at 4 °C for 15 minutes to discard denatured proteins. The supernatant was pipetted off carefully into a clean microtube and dried down at room temperature in the dark under nitrogen. Once dry, the samples were reconstituted in 200 μL of 50:50 MeOH:H2O and mixed well. A final 13,000 g centrifugation at 4 ºC was carried out prior to pipetting into the appropriate analysis vials, and if not injected immediately, kept in the dark at 4º C in the autosampler.
Urine samples were taken pre- and post-dose from the study volunteers, and kept on ice in the dark for the duration of the collection (4 h). Once collected, it was stored in cryovials at − 80º C until analysis. The extraction procedure was the same as for plasma, with a few minor exceptions: Urine was acidified with 8 μl concentrated HCl per 1.5 mL; methanol added as previously and placed at −20 ºC for 15 min prior to centrifugation. No drying-down of the sample was carried out prior to analysis.
2.5 High performance liquid chromatography
The HPLC system consisted of a Waters 1525 binary pump, 717+ autosampler with a refrigeration unit, 2487 dual wavelength UV visible detector and in-line vacuum degasser. The detection was carried out at 325 nm (maximum for resveratrol as verified by scanning spectrophotometry). The HPLC system and detectors were controlled and results calculated by the Empower 1.3 chromatography manager software (Waters, Elstree, UK)
Chromatographic separation was accomplished by injecting the sample onto a Waters Atlantis 4.6×150 mm, 3-μm C18 column (Waters, Elstree, UK) in combination with a Waters Atlantis 4.6×20 mm 5-μm C18 guard column. Using a column oven set at 35 ºC with a flow rate of 1 mL/min. A gradient elution was carried out as follows. 0 min, 0% B; 4 min, 20% B; 7 min 80% B; 16 min 55% B; 18 min, 55% B; 18.5 min, 95% B 23min, 95% B then re-equilibrating to 100% A for 6 min prior to the next injection. (See Fig. 2) Injection volume was 100 μL.
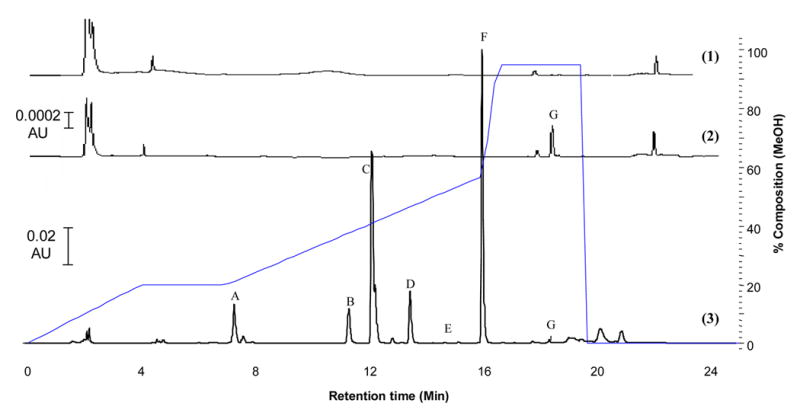
Figure 2.

UV-HPLC chromatograms (1) blank plasma, (2) plasma spiked with resveratrol (10 ng/mL) and (3) human plasma sample 1h post oral dosing with 1 g resveratrol showing: resveratrol (G) ands its major conjugated metabolites. Putative identification by LC-MSMS: (A) sulfate-glucuronide, (B & D) mono-glucuronides, (C) di-sulfate, (E & F) mono-sulfates.
2.6 Mass spectrometry
The extracted samples were also analysed, to identify the metabolite peaks, by direct online LC/MS/MS under the same chromatographic conditions (barring using a 2.1×150 mm narrow bore Atlantis 3μ column, injection volume 30μL, flow rate 240 μL/min equivalent retention to HPLC system) using an Applied Biosystems/MDS SCIEX API 2000 mass spectrometer, (Turbo Ion Spray interface, negative ion mode, Curtain gas 20; Temperature 350 C; Gas 1 30; Gas 2 40; depolarising potential –52.00; focusing potential –398.00; Entrance potential –10.00; Collision energy –33.00; collision gas 3; cell exit potential –11.00) Agilent 1100 LC system using a quaternary pump, MS was controlled with Analyst version 1.3.1 (Applied Biosystems, Warrington, UK). MSMS analysis was carried out in negative ion mode measuring 6 MRM transitions.
3. Results and Discussion
3.1 Resveratrol HPLC analysis and detection
In order to resolve the more polar metabolites of resveratrol successfully whilst still retaining a relatively short run-time, the Atlantis C18 column was chosen, due to its characteristic ability to run in 100 % aqueous conditions. No endogenous peaks in plasma or urine co-eluted with resveratrol under our chromatographic conditions.
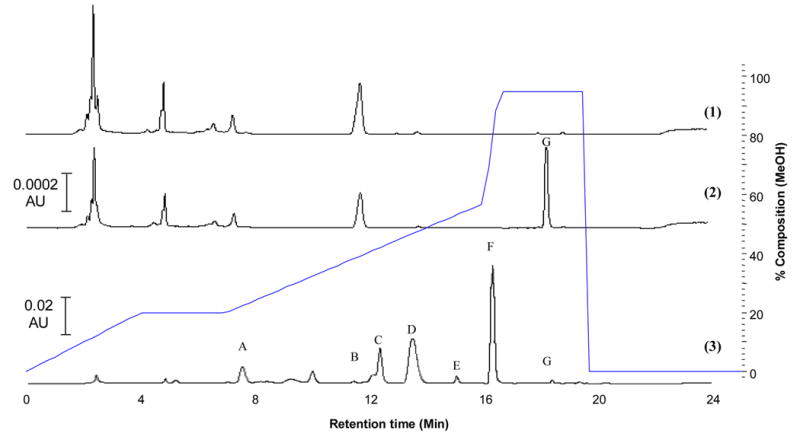
Several major metabolites of resveratrol were detected in both plasma and urine and separated at various time points post dose (Fig. 2 and 3). Under these UV-HPLC conditions, the retention time of resveratrol was 18.6 min. Dihydroresveratrol and its conjugates (previously identified in human urine and plasma [27] would not be seen at this wavelength as they have no absorbance.
Figure 3.

UV-HPLC chromatograms (1) blank urine, (2) urine spiked with resveratrol (10 ng/mL) and (3) human urine sample 1h post oral dosing with 1 g resveratrol showing: resveratrol (G) ands its major conjugated metabolites. Putative identification by LC-MSMS: (A) sulfate-glucuronide, (B & D) mono-glucuronides, (C) di-sulfate, (E & F) mono-sulfates.
3.2 Limit of detection and quantitation, accuracy and precision
The limit of detection for resveratrol (as defined by a signal-to-noise ratio of 3) in methanol solution, plasma and urine was 1.6, 2.0 and 2.0 ng/mL respectively. The limit of quantitation for this assay (as defined by a signal-to-noise ratio of 7) was 5 ng/mL in both plasma and urine. Table 1 shows the within-day and between-day accuracy and precision of the assay.
Table 1.
Between- and within-day variability and accuracy for determination of trans-resveratrol in human plasma and urine.
| Resveratrol Concentration (ng/mL) | Between-day precision (n=5) | Within-day precision (n=5) | ||
|---|---|---|---|---|
| R.S.D. (%) | Accuracy (%) | R.S.D. (%) | Accuracy (%) | |
| Plasma | ||||
| 10 | 9.7 | 104.4 | 5.9 | 94.6 |
| 100 | 8.6 | 98.6 | 4.7 | 97.3 |
| 500 | 5.4 | 100.4 | 3.8 | 102.9 |
| Urine | ||||
| 10 | 10.4 | 102.9 | 6.8 | 104.1 |
| 100 | 5.9 | 101.7 | 3.2 | 102.3 |
| 500 | 6.3 | 98.8 | 4.1 | 99.6 |
3.3 Recovery
To determine the recovery of the method, the neat solution of resveratrol was analysed at low (5 ng/mL) and high (100 ng/mL) levels of concentration, 5 assays at each concentration. Additionally the corresponding low and high levels of resveratrol in plasma and urine matrices were extracted. All samples were assayed in the same analytical run. The extraction efficiency of plasma and urine at the low concentration was 57 and 60 % respectively. At the high concentration level, the extraction efficiency was 60 and 68 % for plasma and urine respectively. Although the recovery was low it was consistently reproducible at this level. Attempts at modification of the method using different extraction solvents and solid phase extraction techniques were found to increase the recovery but at the expense of reproducibility. An external calibration method was used in this work, although an internal calibration would be preferable with biological fluid, a suitable standard could not be found that either didn’t extend the runtime too much or co-elute with endogenous peaks.
3.4 Linearity
For human plasma four calibration runs of spiked plasma were carried out and were linear over the measured range. The calibration curves are defined as the following equations y= (365.5 ±11.4)x + (514.7 ± 160.1); r2=0.9925 (mean ± SEM for slope and y intercept). None of the intercept coefficients were significantly different from 0, indicating the potential for accurate recovery at concentrations below 5 ng/ml. The coefficients of variation of the slope parameters were less than 0.02.
For human urine four calibration runs of spiked urine were carried out and were linear over the measured range. The calibration curves are defined as the following equation y= (138.0 ± 11.4)x + (474.8 ± 216.6); r2=0.9947 (mean ± SEM for slope and y intercept).
3.5 Stability
Neither resveratrol nor any of its metabolites analysed were found to degrade under the conditions of the assay for at least 48 hours post sample preparation (protected from light at 4 C to mimic the autosampler conditions).
3.6 Mass Spectrometry
Comparing the mass chromatograms (not shown) with the UV-HPLC chromatogram allowed for identification of six metabolites. Two mono-sulfate conjugates, one di-sulfate, two mono-glucuronides and one glucuronide-sulfate (see table 2). The mono-sulfate conjugate (Rt 16.0 min) being by far the most abundant metabolite. This follows the previously available literature showing resveratrol undergoes rapid sulfate and glucuronide conjugation [27]. No oxidative metabolites were seen by mass spectrometry. Dihydroresveratrol and its conjugates were not found by LC-MSMS, although the system was not optimised for these compounds (no authentic standard was available).
Table 2.
Identification of putative metabolites of resveratrol from the various relevant MRM transitions
| Putative metabolite | m/z (RES+conjugate) | MRM Transition | Retention time of peak in MRM transition (min)* | ||||||
|---|---|---|---|---|---|---|---|---|---|
| 7.4 | 11.4 | 12.1 | 13.6 | 15.4 | 16.0 | 18.6 | |||
| Resveratrol | 227 | m/z 227 → 143 | ✓ | ✓ | ✓ | ✓ | ✓ | ✓ | ✓ |
| mono-sulfate | 307 (227 + 80) | m/z 307 → 227 | - | - | ✓ | - | ✓ | ✓ | - |
| di-sulfate | 387 (227 + 80 + 80) | m/z 387 → 227 | - | - | ✓ | - | - | - | - |
| mono-glucuronide | 403 (227 + 176) | m/z 403 → 227 | - | ✓ | - | ✓ | - | - | - |
| di-glucuronide | 579 (227 + 176 + 176) | m/z 579 → 227 | - | - | - | - | - | - | - |
| glucuronide-sulfate | 483 (227 + 176 + 80) | m/z 483 → 227 | ✓ | - | - | - | - | - | - |
tick indicates peak present; bold tick also indicates most likely metabolite identity
See typical chromatogram of resveratrol dosed human plasma
3.7 Application of the method
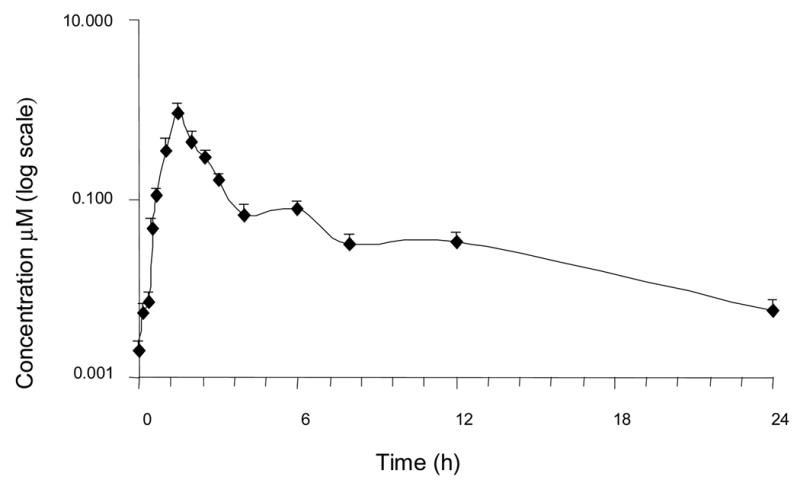
The applicability of the assay is shown in Fig. 2 and 3 which shows the various metabolites present in human urine and plasma and in Fig 4, which shows the average plasma-concentration-time curve of resveratrol after single oral dose (1 g) in four human volunteers.
Figure 4.

A time-concentration profile showing levels of resveratrol in human plasma after a single oral dose of 1 g. Single human volunteer sample mean ± SD, n=3 extractions.
4.0 Conclusion
In the present paper, a reliable, reproducible extraction procedure and sensitive HPLC separation coupled to UV detection was described allowing quantification of resveratrol and separation and identification of at least six major conjugate metabolites in human plasma and urine. Reproducible recovery of resveratrol down to 5 ng/ml was achieved, with the potential for accurate assessment of concentrations down to 1 ng/ml in both urine and plasma. This HPLC system coupled to mass spectrometry could be an appropriate tool for further identification and quantification of resveratrol and its metabolites in human pharmacokinetics studies presently in progress.
Footnotes
Publisher's Disclaimer: This is a PDF file of an unedited manuscript that has been accepted for publication. As a service to our customers we are providing this early version of the manuscript. The manuscript will undergo copyediting, typesetting, and review of the resulting proof before it is published in its final citable form. Please note that during the production process errors may be discovered which could affect the content, and all legal disclaimers that apply to the journal pertain.
References
- 1.Landcake P, Price RJ. Physiol Plant Pathol. 1976;9:77–86. [Google Scholar]
- 2.Ingham JL. Phytochemistry. 1976;15:1791–1793. [Google Scholar]
- 3.Siemann EH, Creasy LL. Am J Enol Vitic. 1992;43:49–52. [Google Scholar]
- 4.Kopp P. Eur J Endocrinol. 1998;138(6):619–20. doi: 10.1530/eje.0.1380619. [DOI] [PubMed] [Google Scholar]
- 5.Jang MS, Cai EN, Udeani GO, Slowing KV, Thomas CF, Beecher CWW, Fong HHS, Farnsworth NR, Kinghorn AD, Mehta RG, Moon RC, Pezzuto JM. Science. 1997;275:218–220. doi: 10.1126/science.275.5297.218. [DOI] [PubMed] [Google Scholar]
- 6.Bertelli AAE, Giovannini D, Giannessi M, Migliori M, Bernini W, Fregoni M, Bertelli A. Int J Tissue React. 1995;17:1–3. [PubMed] [Google Scholar]
- 7.Uenobe F, Nakamura S, Miyazama M. Mut Res. 1997;373:197–200. doi: 10.1016/s0027-5107(96)00191-1. [DOI] [PubMed] [Google Scholar]
- 8.Gehm BD, McAndrews JM, Chien PY, Jameson JL. Proc Natl Acad Sci USA. 1997;96:14138–14143. doi: 10.1073/pnas.94.25.14138. [DOI] [PMC free article] [PubMed] [Google Scholar]
- 9.Gusman J, Malonne H, Atassi GA. Carcinogenesis. 2001;22:1111–1117. doi: 10.1093/carcin/22.8.1111. [DOI] [PubMed] [Google Scholar]
- 10.Bhat KPL, Lantvit D, Christov K, Mehta RG, Moon RC, Pezzuto JM. Cancer Res. 2001;61:7456–7463. [PubMed] [Google Scholar]
- 11.Sharma S, Stutzman JD, Kelloff GJ, Steele VE. Cancer Res. 1994;54:5848–5855. [PubMed] [Google Scholar]
- 12.Tessitore L, Davit A, Sarotto I, Caderni G. Carcinogenesis. 2000;21:1619–1622. [PubMed] [Google Scholar]
- 13.Schneider Y, Duranton B, Gosse F, Schleiffer R, Seiler N, Raul F. Nutrit Cancer. 2001;39:102–107. doi: 10.1207/S15327914nc391_14. [DOI] [PubMed] [Google Scholar]
- 14.Ziegler CC, Rainwater L, Whelan J, McEntee MF. J Nutr. 2004;134(1):5–10. doi: 10.1093/jn/134.1.5. [DOI] [PubMed] [Google Scholar]
- 15.Bertelli AA, Giovanni L, Stradi R, Urien S, Tillement JP. Int J Clin Pharm Res. 1996;16:77–81. [PubMed] [Google Scholar]
- 16.Soleas GJ, Angelini M, Grass L, Diamandis EP, Goldberg DM. Methods Enzymol. 2001;13:145–154. doi: 10.1016/s0076-6879(01)35239-4. [DOI] [PubMed] [Google Scholar]
- 17.Andlauer W, Kolb J, Siebert K, Fürst P. Drugs Expt Clin Res. 2000;26:47–55. [PubMed] [Google Scholar]
- 18.Juan ME, Buenafuente J, Casals I, Planas JM. Food Res Int. 2002;35:195–199. [Google Scholar]
- 19.de Santi C, Pietrabissa A, Mosca F, Pacific GM. Xenobiotica. 2000;30:857–866. doi: 10.1080/004982500433282. [DOI] [PubMed] [Google Scholar]
- 20.de Santi C, Pietrabissa A, Spisni R, Mosca F, Pacific GM. Xenobiotica. 2000;30:1047–1054. doi: 10.1080/00498250010002487. [DOI] [PubMed] [Google Scholar]
- 21.Zhu Z, Klironomos G, Vachereau A, Neirinck L, Goodman DW. J Chrom B. 1999;724:389–392. doi: 10.1016/s0378-4347(98)00586-6. [DOI] [PubMed] [Google Scholar]
- 22.Normolle D. Statistics in Medicine. 1993;12:2025–2042. doi: 10.1002/sim.4780122106. [DOI] [PubMed] [Google Scholar]
- 23.Brown P. Measurement, Regression and Calibration. Oxford University Press; New York: 1993. [Google Scholar]
- 24.Vitaglione P, Sforza S, Galaverna G, Ghidini C, Caporaso N, Vescovi PP, Fogliano V, Machelli R. Mol Nutr Food Res. 2005;49:495–504. doi: 10.1002/mnfr.200500002. [DOI] [PubMed] [Google Scholar]
- 25.Yu C, Shin YG, Chow A, Li Y, Kosmeder J, Lee YS, Hirscelman WH, Pezzuto JM, Mehta R, van Breeman RB. Pharm Res. 2002;19:1907–1914. doi: 10.1023/a:1021414129280. [DOI] [PubMed] [Google Scholar]
- 26.Wang D, Hang T, Wu C, Liu W. J Chrom B. 2005;829:97–106. doi: 10.1016/j.jchromb.2005.09.040. [DOI] [PubMed] [Google Scholar]
- 27.Walle T, Hsieh F, DeLegge MH, Oatis JE, Jr, Walle UK. Drug Met Disp. 2004;32:1377–1382. doi: 10.1124/dmd.104.000885. [DOI] [PubMed] [Google Scholar]
- 28.He H, Chen X, Wang G, Wang J, Davey AK. J Chrom B. 2006;832:177–180. doi: 10.1016/j.jchromb.2005.12.021. [DOI] [PubMed] [Google Scholar]
- 29.Goldberg DM, Yan J, Soleas GJ. Clin Biochem. 2003;36:79–87. doi: 10.1016/s0009-9120(02)00397-1. [DOI] [PubMed] [Google Scholar]


