

Abstract
Background
Theoretical conceptions of autism spectrum disorder (ASD) and experimental studies of cerebral blood flow suggest abnormalities in connections among distributed neural systems in ASD.
Methods
Functional connectivity was assessed with EEG coherence between pairs of electrodes in a high-density electrode array in narrow frequency bands among 18 adults with autism spectrum disorder (ASD) and 18 control adults in an eyes closed resting state.
Results
In the theta (3–6 Hz) frequency range, locally elevated coherence was evident for the ASD group, especially within left hemisphere frontal and temporal regions. In the lower alpha range (8–10 Hz), globally reduced coherence was evident for the ASD group within frontal regions, and between frontal and all other scalp regions. The ASD group exhibited significantly greater relative power between 3–6 Hz and 13–17 Hz, and significantly less relative power between 9–10 Hz.
Conclusions
Robust patterns of over- and under-connectivity are apparent at distinct spatial and temporal scales in ASD subjects in the eyes closed resting state.
Keywords: neural synchrony, oscillations, functional connectivity, developmental neuropathology, frontal lobe
Autism spectrum disorder (ASD) is a developmental disorder characterized by impairments in social interaction and communication, and a restricted range of interests. Evidence for abnormalities in connections among distributed neural systems in ASD is found in functional imaging studies that demonstrate decreased correlations in cerebral metabolism and blood flow (Horwitz et al., 1988; Just et al., 2004, 2006; Koshino et al., 2005). Magnetic resonance studies suggest increased white matter in ASD (Courchesne et al. 2001; Carper et al. 2002; Herbert et al., 2004). Electroencephalographic (EEG) measurements, while lacking the spatial resolution of these techniques, directly relate to dynamic postsynaptic activity in the neocortex.
Levels of synchronization between neural populations can be estimated from EEG recordings via EEG coherence measurements, which describe the linearity of the relationship between two EEG signals to identify spatially distributed synchronous neuronal assemblies. High coherence between two EEG signals reflects synchronized neuronal oscillations (suggesting functional integration between neural populations), while low coherence suggests independently active populations (suggesting functional segregation). EEG coherence is primarily a measure of phase correlation and is believed to reflect functional cortical connectivity on a centimeter scale (Nunez & Srinivasan, 2006; Srinivasan et al., 1998) either directly via corticocortical fiber systems or indirectly through networks that include other cortical or subcortical structures.
Methods
Subjects
Eighteen male adults with autism spectrum disorder (ASD) and eighteen control male adults participated in the study. All individuals had full scale and verbal IQ scores above 80 (Wechsler Adult Intelligence Scale). Diagnosis was confirmed using diagnostic interviews (Lord et al., 1994, 2000) and clinical judgments based on DSM-IV criteria. Psychometric scores for the ASD group are presented in Table 1. Informed consent, exclusion criteria and medication status are described in supplementary material.
Table 1.
Characteristics of the study sample.
| ASD n=18 | Control n=18 | t-statistic (df) | |||||
|---|---|---|---|---|---|---|---|
| Mean | Std Dev | Range | Mean | Std Dev | Range | ||
| AGE | 22.66 | 4.4 | 18.9–37.7 | 24.93 | 6.82 | 18.5–38.3 | −1.184 (34) |
| ADOS SOC | 8.72 | 2.44 | 4–12 | ||||
| ADOS COM | 3.94 | 1.30 | 2–6 | ||||
| ADOS MOD | 4.00 | 0.00 | 4–4 | ||||
| Full Scale IQ | 107.33 | 13.96 | 86–139 | 106.11 | 13.56 | 88–139 | .266 (34) |
| Verbal IQ | 108.28 | 16.00 | 84–140 | 106.67 | 12.14 | 89–132 | .340 (34) |
| Performance IQ | 104.44 | 13.45 | 83–128 | 104.00 | 17.44 | 78–136 | .086 (34) |
| Head circumference | 58.56 | 2.58 | 54.5–62 | 58.14 | 1.90 | 54.5–62 | .551 (34) |
2.2 Procedure
Spontaneous EEG was collected with participants comfortably seated in the eyes closed resting state. EEG was recorded from 124 electrodes using the Geodesic Sensor Net (Electrical Geodesics, OR). EEG was recorded with reference to the vertex, amplified, and analog elliptical filtered between .1 and 100 Hz before digitization at either 500 or 250 samples/second. Manual and automated artifact editing was performed on time series and spectral data. At each time point, the potentials at each electrode were re-referenced to the instantaneous average of all electrodes, providing a reasonable estimate of reference independent potentials (Bertrand et al., 1985, Srinivasan et al., 1998).
Spectral analysis
Spectral analysis methods were similar to Murias et al. 2006. Briefly, EEG records were segmented into one-second epochs, detrended, and transformed in Matlab using a Fourier (FFT) algorithm, yielding Fourier coefficients at each channel and epoch in 1 Hz frequency steps. To obtain the coherence between two channels across epochs at each frequency, the average cross spectrum, calculated from the complex conjugate of the Fourier coefficients, is squared and normalized by the average residual power spectrum of the individual channels. The resulting coherence statistic is highly sensitive to the consistency of the phase difference between channels (Bendat and Piersol, 2001). At frequency f, a coherence value of 1 indicates that the two channels maintain the same phase difference on every epoch, whereas a coherence value near 0 indicates that the phase difference is random from epoch to epoch. We examined the coherence spectra of all electrode pairs separated by at least 3 cm (5,778 pairs). This choice of distance criteria excludes electrodes located next to each other on the scalp, but is still subject to volume conduction effects that spatially filter potential coherences from electrode pairs separated by less than 10–12 cm (Nunez and Srinivasan, 2006). Relative power values were obtained for frequencies 2–30 Hz by computing the fraction of power at each 1 Hz band divided by the sum of power across 2–30 Hz.
Statistical Methods
We tested group (control vs. ASD) power and coherence differences against a bootstrap distribution (Efron & Tibshirani, 1993). We resampled with replacement the entire 36-participant dataset to obtain a distribution of average differences, under the null hypothesis that the two participants groups were drawn from the same distribution. We randomly sampled 2,000 draws of “group” (18 & 18 randomly selected) participants and calculated differences in mean power and coherence. The resulting distribution of the t statistic was used to estimate the probability (p value) that the observed control vs. ASD differences exceeded “group” differences that could be observed by chance. We calculated two-tailed tests for group and adopted a criterion of accepting any particular frequency as significant if more than 5% of the channels or channel pairs in the array showed differences that exceeded the 95% confidence interval.
3. Results
The overall pattern of resting state coherence results is illustrated in Figure 1. Shaded areas of the coherence spectra in Figure 1 reflect significant group differences observed across 3–6 Hz and 8–10 Hz. At each of these frequencies, at least 5% of channel pairs differentiated the ASD from the control group at p < .025. To describe the topography of group differences spanning these significant frequency ranges, we summed coefficients in the cross-spectrum and recalculated coherence, relative power and bootstrap statistics.
Figure 1.

Eyes closed resting coherence spectra, averaged across all the 5,778 electrode pairs separated by at least 3 cm. along the scalp surface. Shaded areas indicate frequencies at which more than 5% of electrode pairs differentiated control and ASD groups at p < .025. Between 3–6 Hz, ASD coherences are significantly greater than controls. In the lower alpha range (8–10 Hz), ASD coherences are significantly reduced. Mean coherence across these channel pairs is inflated due to the inclusion of pairs separated by less than 10 cm.
Averaged across the 3–6 Hz band, ASD group coherences exceeded control in 10.3% of electrode pairs at p < .025 (fewer than 0.45% of control group channel pairs exceeded ASD at p < .025). Figure 2 shows the scalp locations of significant channel pairs. Table 2 shows, for each scalp region, the number of times each electrode within that scalp region was involved in an electrode pairing that significantly differentiated groups. Magnitudes of regional coherences are shown in Figures 5 (supplementary).
Figure 2.
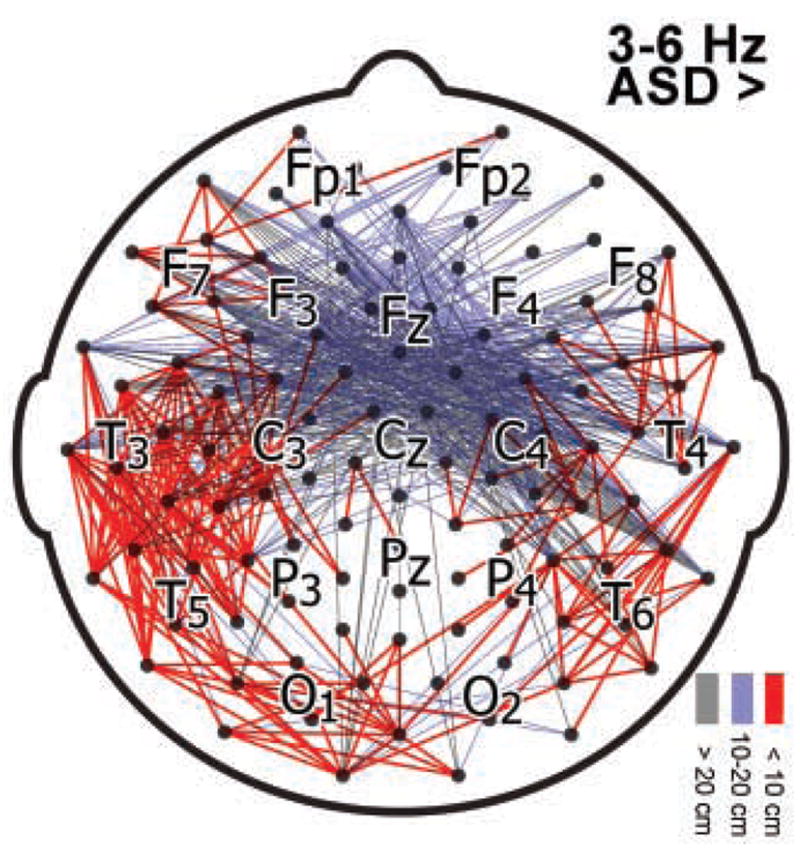
Topography of significantly elevated ASD group coherences in the 3–6 Hz band. Lines are drawn between channel pairs at which ASD group coherence exceeded control with p-values below .025. Lines are colored according to distance (cm) between electrode pairs, along the scalp surface.
Table 2.
Scalp locations comprising the major group differences in coherence in the 3–6 Hz and 8–10 Hz bands. For each scalp region, a count is made of the number of times each electrode was involved in an electrode pair that significantly differentiated groups.
| ASD > | RPF | LPF | RFR | LFR | RCE | LCE | RPR | LPR | RTM | LTM | ROC | LOC |
|---|---|---|---|---|---|---|---|---|---|---|---|---|
| 3–6 Hz, < 10cm | 5 | 11 | 4 | 22 | 10 | 22 | 12 | 15 | 17 | 50 | 9 | 23 |
| 3–6 Hz, > 10cm | 27 | 35 | 38 | 74 | 43 | 19 | 10 | 4 | 54 | 30 | 6 | 10 |
| 8–10 Hz, < 10 cm | 1 | 0 | 1 | 1 | 2 | 1 | 0 | 2 | 10 | 5 | 0 | 0 |
| 8–10 Hz, > 10 cm | 1 | 0 | 5 | 1 | 2 | 7 | 0 | 1 | 7 | 7 | 0 | 0 |
| control > | ||||||||||||
| 3–6 Hz, < 10cm | 0 | 0 | 1 | 0 | 1 | 1 | 0 | 0 | 0 | 0 | 0 | 0 |
| 3–6 Hz, > 10cm | 3 | 4 | 3 | 2 | 2 | 1 | 0 | 0 | 1 | 1 | 4 | 2 |
| 8–10 Hz, < 10 cm | 22 | 22 | 53 | 59 | 15 | 12 | 8 | 3 | 2 | 2 | 2 | 3 |
| 8–10 Hz, > 10 cm | 111 | 151 | 134 | 156 | 61 | 77 | 67 | 50 | 17 | 30 | 78 | 97 |
L = left, R = right; PF = prefrontal; FR = frontal; CE = central; PR = parietal; TM= temporal; OC = occipital. Midline channels excluded.
Averaged across the 8–10 Hz band, control group coherences exceeded ASD in 22.7% of electrode pairs at p < .025 (fewer than 0.9% of control group channel pairs exceeded ASD at p < .025). Figure 3 shows the scalp locations of significant channel pairs; regional pairing statistics are presented in Table 2. Magnitudes of regional coherences are shown in Figures 5.
Figure 3.

Topography of significantly elevated control group coherences in the 8–10 Hz band. Lines are drawn between channel pairs at which control group coherence exceeded ASD with p-values below .025. Lines are colored according to distance (cm) between electrode pairs, along the scalp surface.
Relative power differentiated groups in three frequency bands. Averaged across the 3–6 Hz band, ASD group relative power was elevated at 32% of primarily frontal and prefrontal regions. Across the 9–10 Hz band, ASD group relative power was reduced at 48% of primarily frontal/prefrontal and occipital/parietal regions. Across the 13–17 Hz band, ASD group relative power was elevated at 9% of electrodes in occipital/parietal regions, with bilateral central regions approaching significance. Topographies of group relative power differences at these bands are shown in Figure 4.
Figure 4.
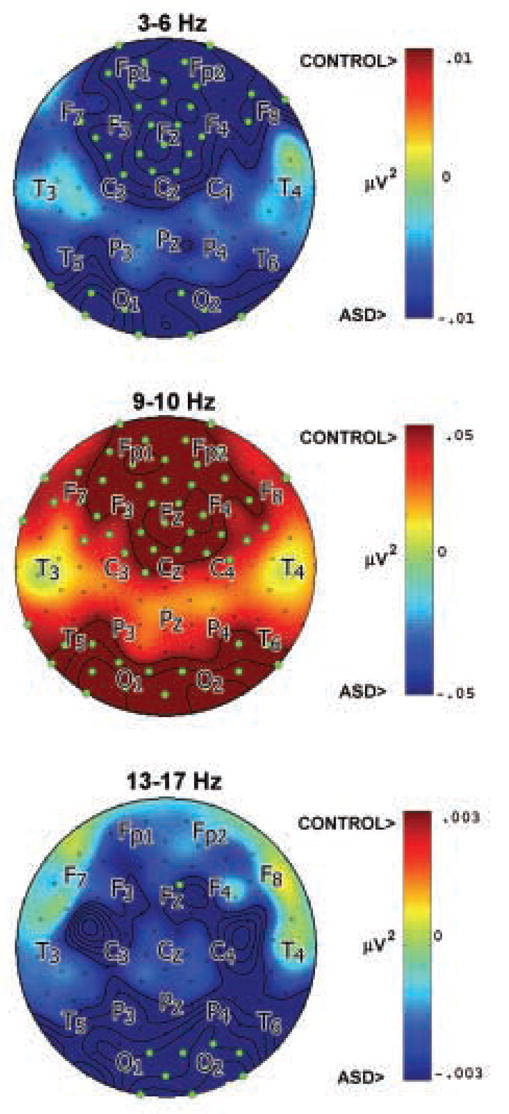
Topography of relative power differences (control minus ASD). Green dots indicate significant difference between groups at p < .025. ASD relative power exceeded control at 3–6 Hz (top) and 13–17 Hz (bottom). Control potential relative power exceeded ASD at 9–10 Hz (middle).
Discussion
This study is, to our knowledge, the first to employ dense array EEG coherence methods to assess cortical connectivity among adults with ASD. Using adequate spatial sampling and reference independent measures of the EEG, we found robust differences between ASD and control adults during a resting state, reflecting contrasting patterns of over- and under-connectivity at distinct spatial and temporal scales.
At short (<10 cm) interelectrode distances, power at underlying sources may influence coherence measurements, such that increased coherence can be measured even when the underlying sources are uncorrelated (Srinivasan, 1998). Therefore, we cannot conclusively distinguish the alpha range ASD group coherence reduction seen within frontal areas at short interelectrode distances from simple power effects. Conversely, the long-range alpha band coherence reductions (frontal-occipital, frontal parietal) appear to reflect genuine group differences in coherent neuronal activity, as those electrode pairs are separated by more than 10 cm. The increased short-range ASD group coherence we observed at primarily temporal recording sites between 3–6 Hz was not coincident with increased power measured at those sites, and we therefore interpret the observation of increased coherence in temporal areas as a reflection of genuine increased correlated cortical activity.
Our results are consistent with recent evidence demonstrating altered resting-state connectivity in ASD (Kennedy et al. 2006; Cherkassky et al, 2006). Our alpha range findings suggest that the frontal lobe has weak functional connections with the rest of the cortex in ASD, consistent with the underconnectivity theory developed by Just and colleagues (Just et al. 2004; 2006). Our theta range findings suggest local cortical overconnectivity in ASD, especially within left hemisphere frontal and temporal cortex. This may reflect increases in short-range association fibers (Herbert et al., 2004), which could bias cortical connections toward local, rather than global information processing (Courchesne & Pierce, 2005; Casanova et al., 2006). A fairly consistent finding in MRI studies of ASD is reduced callosal volumes, which also suggests that cortical connectivity may be skewed away from long distance and toward local connections (Belmonte et al., 2004; Casanova, 2006). EEG coherence and power reported here appear consistent with the anatomy, in that EEG oscillations in the theta range appear to reflect locally dominant neocortical processes, whereas alpha oscillations represent more globally dominant phenomena that are more dependent on corticocortical and callosal fibers (Nunez, 1995; Nunez and Srinivasan, 2006).
Our study was limited to adults with IQ’s above 80, and as such the results cannot be generalized to younger or more impaired populations. Some ASD subjects were medicated. We did not evaluate EEG signals below 2 Hz or above 30 Hz.
Supplementary Material
Acknowledgments
This project received generous support from NIMH (U54MH066399), NICHD and NIDCD (U19HD34565), and the Perry Research Fellowship Endowment. We thank Kristen Merkle for assistance with data collection and analysis and Greg Owen for graphical support.
Footnotes
Publisher's Disclaimer: This is a PDF file of an unedited manuscript that has been accepted for publication. As a service to our customers we are providing this early version of the manuscript. The manuscript will undergo copyediting, typesetting, and review of the resulting proof before it is published in its final citable form. Please note that during the production process errors may be discovered which could affect the content, and all legal disclaimers that apply to the journal pertain.
References
- Americal Psychiatric Association. Diagnostic and statistical manual of mental disorders. 4. Washington, DC: 1994. [Google Scholar]
- Belmonte MK, Allen G, Beckel-Mitchener A, Boulanger LM, Carper RA, Webb SJ. Autism and abnormal development of brain connectivity. Journal of Neuroscience. 2004;24(42):9228–9231. doi: 10.1523/JNEUROSCI.3340-04.2004. [DOI] [PMC free article] [PubMed] [Google Scholar]
- Bendat JS, Piersol AG. Random data: Analysis and measurement procedures. 3. New York: John Wiley & Sons; 2001. [Google Scholar]
- Bertrand O, Perrin F, Pernier J. A theoretical justification of the average reference in topographic evoked potential studies. Electroencephalogr Clin Neurophysiol. 1985;62(6):462–464. doi: 10.1016/0168-5597(85)90058-9. [DOI] [PubMed] [Google Scholar]
- Casanova MF, van Kooten IAJ, Switala AE, van Engeland H, Heinsen H, Steinbusch HWM, et al. Minicolumnar abnormalities in autism. Acta Neuropathologica. 2006;V112(3):287. doi: 10.1007/s00401-006-0085-5. [DOI] [PubMed] [Google Scholar]
- Casanova MF. Neuropathological and genetic findings in autism: The significance of a putative minicolumnopathy. The Neuroscientist. 2006;12(5):435. doi: 10.1177/1073858406290375. [DOI] [PubMed] [Google Scholar]
- Cherkassky VL, Kana RK, Keller TA, Just MA. Functional connectivity in a baseline resting-state network in autism. NeuroReport. 2006 doi: 10.1097/01.wnr.0000239956.45448.4c. in press. [DOI] [PubMed] [Google Scholar]
- Courchesne E, Karns CM, Davis HR, Ziccardi R, Carper RA, Tigue ZD, et al. Unusual brain growth patterns in early life in patients with autistic disorder: An MRI study. Neurology. 2001;57(2):245–254. doi: 10.1212/wnl.57.2.245. [DOI] [PubMed] [Google Scholar]
- Courchesne E, Pierce K. Why the frontal cortex in autism might be talking only to itself: Local over-connectivity but long-distance disconnection. Current Opinion in Neurobiology. 2005;15(2):225. doi: 10.1016/j.conb.2005.03.001. [DOI] [PubMed] [Google Scholar]
- Efron B, Tibshirani R. An introduction to the bootstrap. New York: Chapman & Hall; 1993. [Google Scholar]
- Herbert MR, Ziegler DA, Makris N, Filipek PA, Kemper TL, Normandin JJ, et al. Localization of white matter volume increase in autism and developmental language disorder. Annals of Neurology. 2004;55(4):530–540. doi: 10.1002/ana.20032. [DOI] [PubMed] [Google Scholar]
- Horwitz B, Rumsey J, Grady C, Rapoport S. The cerebral metabolic landscape in autism. Intercorrelations of regional glucose utilization. Arch Neurol. 1988;45(7):749–755. doi: 10.1001/archneur.1988.00520310055018. [DOI] [PubMed] [Google Scholar]
- Just MA, Cherkassky VL, Keller TA, Minshew NJ. Cortical activation and synchronization during sentence comprehension in high-functioning autism: Evidence of underconnectivity. Brain. 2004;127(8):1811. doi: 10.1093/brain/awh199. [DOI] [PubMed] [Google Scholar]
- Just MA, Cherkassky VL, Keller TA, Kana RK, Minshew NJ. Functional and anatomical cortical underconnectivity in autism: Evidence from an fMRI study of an executive function task and corpus callosum morphometry. Cerebral Cortex. 2006:bhl006. doi: 10.1093/cercor/bhl006. [DOI] [PMC free article] [PubMed] [Google Scholar]
- Koshino H, Carpenter PA, Minshew NJ, Cherkassky VL, Keller TA, Just MA. Functional connectivity in an fMRI working memory task in high-functioning autism. NeuroImage. 2005;24(3):810. doi: 10.1016/j.neuroimage.2004.09.028. [DOI] [PubMed] [Google Scholar]
- Lord C, Rutter MALC. Autism diagnostic interview-revised: A revised version of a diagnostic interview for caregivers of individuals with possible pervasive developmental disorders. J Autism Dev Disord. 1994;24(5):659–685. doi: 10.1007/BF02172145. [DOI] [PubMed] [Google Scholar]
- Lord C, Risi S, Lambrecht L, Cook EH, Leventhal BL, DiLavore PC, et al. The autism diagnostic observation schedule-generic: A standard measure of social and communication deficits associated with the spectrum of autism. Journal of Autism and Developmental Disorders. 2000;30(3):205–223. [PubMed] [Google Scholar]
- Murias M, Swanson JM, Srinivasan R. Functional Connectivity of Frontal Cortex in Healthy and ADHD Children Reflected in EEG Coherence. Cerebral Cortex. 2006 doi: 10.1093/cercor/bhl089. [DOI] [PMC free article] [PubMed] [Google Scholar]
- Nunez PL. Neocortical dynamics and human EEG rhythms. Oxford University Press; 1995. [Google Scholar]
- Nunez PL, Srinivasan R. Electric fields of the brain: The neurophysics of EEG. 2. New York: Oxford University Press; 2006. [Google Scholar]
- Srinivasan R, Nunez PL, Silberstein RB. Spatial filtering and neocortical dynamics: Estimates of EEG coherence. IEEE Trans Biomed Eng. 1998;45(7):814–826. doi: 10.1109/10.686789. [DOI] [PubMed] [Google Scholar]
Associated Data
This section collects any data citations, data availability statements, or supplementary materials included in this article.