

Abstract
Background:
Positron emission tomography (PET) studies of major depression have revealed resting-state abnormalities in the prefrontal and cingulate cortices. Recently, fMRI has been adapted to examine connectivity within a specific resting-state neural network—the default-mode network—that includes the medial prefrontal and anterior cingulate cortices. The goal of this study was to examine resting-state, default-mode network functional connectivity in subjects with major depression and in healthy comparison subjects.
Methods:
28 subjects with major depression and 20 healthy control subjects underwent 5-minute fMRI scans while resting quietly. Independent component analysis was used to isolate the default-mode network in each subject. Group maps of the default-mode network were generated and compared between the two groups. A within-group analysis was performed in the depressed group to explore effects of depression refractoriness on network functional connectivity.
Results:
Resting-state subgenual cingulate and thalamic functional connectivity with the default-mode network was significantly greater in the depressed subjects compared to the control group. Within the depressed group, the length of the current depressive episode (a surrogate for refractoriness) was positively correlated with functional connectivity in the subgenual cingulate.
Conclusions:
This is the first study to explore default-mode functional connectivity in subjects with major depression. The findings provide cross-modality confirmation of PET studies demonstrating abnormally increased thalamic and subgenual cingulate activity in major depression. Further, the within-subject connectivity analysis employed here brings these previously isolated regions of hypermetabolism into the context of a disordered neural network. The correlation between refractoriness and subgenual cingulate functional connectivity within the network suggests that a quantitative, resting-state fMRI measure could be used to guide therapy on an individual subject basis.
Keywords: functional connectivity, depression, subgenual cingulate, resting-state, independent component analysis
In the unremitted state, major depression is characterized by persistent, pervasive feelings of sadness, guilt, and worthlessness(American Psychiatric Association 2000). While the performance of externally-cued, cognitive tasks is known to be impaired in patients with depression(Harvey et al 2005), the tonic nature of these core depressive symptoms has also prompted a wealth of resting-state imaging studies(Mayberg 2003; Videbech 2000). The bulk of these studies have been done using positron emission tomography (PET) to measure glucose metabolism and typically show that depressed subjects have reduced lateral prefrontal metabolism and increased medial prefrontal and subgenual cingulate metabolism(Mayberg 1997; Mayberg 2003). While most studies have been performed in actively depressed subjects, PET studies of tryptophan depletion(Neumeister et al 2004) and sadness induction(Liotti et al 2002) in remitted depression have also demonstrated focal metabolism abnormalities. Specifically, tryptophan depletion (contrasted with sham depletion) in patients with remitted depression resulted in increased metabolism in several regions including anterior cingulate, orbitofrontal cortex, and medial thalamus(Neumeister et al 2004). Induced sadness in patients with remitted but not active depression resulted in reduced metabolism in the pregenual anterior cingulate. These studies suggest that there are several regions whose metabolic activity may serve as signatures not merely of a depressive “state”, but of a depressive “trait”.
The subgenual cingulate has become a particular area of interest in depression research over the last decade as more and more studies implicate it as a focus of dysfunction. In addition to showing increased metabolism in depression(Drevets et al 2002; Kennedy et al 2001), the subgenual cingulate tends to show reduced volume(Botteron et al 2002; Drevets et al 1997; Hirayasu et al 1999; Ongur et al 1998). Depression severity correlates positively with metabolism in this region(Osuch et al 2000). Increased metabolism in the subgenual cingulate declines towards the normal range in patients with major depression who respond to treatment(Kennedy et al 2001; Mayberg et al 2000). Inducing sadness in healthy controls increases perfusion in this region(Liotti et al 2002). The subgenual cingulate was the most active region in a group of healthy controls when they evaluated the emotional valence of pleasant and unpleasant words(Maddock et al 2003). Taken together, this convergence of findings across modalities and mood states has focused attention on the subgenual cingulate as a critical brain region in emotion processing and the pathogenesis of mood disorders; culminating in a recent clinical trial suggesting that deep brain stimulation to this region may ameliorate symptoms in patients with severe, refractory depression(Mayberg et al 2005).
To date, functional imaging research on the resting brain has been limited mainly to PET and single photon computed tomography (SPECT) studies. These modalities have proven quite valuable, but they have some significant limitations including poor spatial resolution and exposure to radioactive tracers which, though minimal in a single scan, limits the frequency with which they can be repeated. Functional MRI (fMRI) overcomes both these limitations but until recently could not be readily applied to resting-state data. Over the last 10 years, however, advances in fMRI have allowed for connectivity analyses of resting-state neural networks(Biswal et al 1995; Hampson et al 2002; Xiong et al 1999).
Our group has focused on a particular resting-state network which incorporates several brain regions implicated in major depression including the anterior cingulate and a large swath of medial prefrontal cortex extending inferiorly into orbitofrontal cortices(Greicius et al 2003; Greicius et al 2004). This “default-mode” network(Raichle et al 2001) appears to mediate internally-generated thought processes and is typically inhibited in fMRI tasks that require subjects to attend to cognitively demanding, external stimuli. Anterior regions of the network such as the medial prefrontal cortex have been associated with self-referential processing(Gusnard et al 2001). The posterior regions of the network, particularly the posterior cingulate and the inferolateral parietal lobes, are associated with episodic memory retrieval(Buckner et al 2005; Maddock et al 2001; Maguire and Mummery 1999).
We have adapted independent component analysis (ICA) to allow for the automated detection of this network in resting-state fMRI data(Greicius and Menon 2004; Greicius et al 2004). This approach assumes that there is a canonical spatial pattern to the default-mode network which allows it to be reliably detected at the single-subject level using a template-matching procedure. After detecting the network at the single subject level, group level maps can then be generated and contrasted between two groups. Given the abundant PET-based evidence for resting-state abnormalities in depression, in the current study we sought to determine if there were regional differences in default-mode network functional connectivity in subjects with depression compared to healthy controls.
We hypothesized that the ruminative nature of depression—with persistent, pervasive feelings of sadness, guilt, and worthlessness—would be reflected in default-mode network abnormalities. In particular, the persistent, emotionally-laden, self-reflective tendencies in depressed subjects might generate increased functional connectivity in medial prefrontal portions of the network implicated in self-referential and emotional processing(Fossati et al 2003; Gusnard et al 2001; Kelley et al 2002). Conversely, the cognitive, and specifically memory, impairments reported in unremitted depression(MacQueen et al 2003)might lead to reduced functional connectivity in the more posterior regions of the network that have been implicated in episodic memory retrieval(Buckner et al 2005; Greicius et al 2004).
Methods
Subjects
Subjects were recruited through inpatient and outpatients facilities at Stanford University or self-referred from online and print study advertisements. Eligibility screening procedures included the Structured Clinical Interview for the DSM-IV (SCID)(First et al 1997), the 21-item Hamilton Depression Rating Scale (HDRS)(Hamilton 1980), the Brief Psychiatric Rating Scale (BPRS)(Overall and Gorham 1961), clinical laboratory tests complete blood count, comprehensive metabolic panel, thyroid-stimulating hormone, urinary analysis, urine drug screen, electrocardiogram, and urine pregnancy for females. Diagnoses of depression were made by participants' treating psychiatrists and confirmed with the SCID. Healthy controls also were assessed with the SCID. Family history was not obtained and so was not used in the inclusion/exclusion criteria. Participants were required to have stable medications for at least 2 weeks prior to screening but were allowed to remain on their current medications during the study. Depressed patients with (11 subjects) and without (17 subjects) psychosis were included. All depressed subjects were required to have a minimum score of 21 on the HDRS and a minimum score of 7 on the Thase Core Endogenomorphic Scale(Thase et al 1983) modified for the 21-item HDRS(Posener et al 2000). These latter two criteria were designed to ensure inclusion of participants with similar minimum levels of severity of endogenous-type symptoms.
A number of exclusion criteria existed for this protocol. Patients with major medical illnesses, histories of seizures, head trauma with loss of consciousness, abnormal clinical laboratory tests, active use of systemic steroids, pregnant or lactating females, and individuals under the age of 18 were excluded from participation. Additionally, patients who were actively suicidal, met criteria for primary obsessive-compulsive disorder or bipolar disorder (type I or type II), had a history of substance abuse or electroconvulsive therapy in the previous six months, or had a history of substance dependence were excluded from the study. A co-morbid diagnosis of anxiety disorder was permitted provided that depression was the primary clinical diagnosis. All subjects were paid $250 for their participation. The study was approved by the Stanford University Institutional Review Board, and all subjects gave written informed consent before screening.
After applying the exclusion criteria above, 5-minute resting-state scans from 34 depressed subjects and 24 control subjects were processed. Of these scans, 10 could not be included in the analysis owing to excessive motion or scanner artifact (6 depressed subjects, 4 controls). Excessive motion was defined as more than 3.125 mm of translation in any plane or more than 5 degrees of rotation in any plane. Scanner artifacts included large-scale signal abnormalities due to scanner spikes or, in one case, severe signal loss of unclear etiology detectable on the raw T2* images (i.e. prior to running ICA). This resulted in usable resting-state fMRI data on 28 subjects with depression and 20 control subjects.
fMRI Acquisition/Preprocessing
All subjects underwent a 5-minute resting-state scan in which they were given no specific instructions except to keep their eyes closed and hold still.
Functional images were acquired on a 3T GE Signa scanner using a standard GE whole head coil (Lx platform, gradients 40 mT/m, 150 T/m/s). A custom-built head holder was used to prevent head movement. To reduce blurring and signal loss arising from field inhomogeneities, an automated high-order shimming method based on spiral acquisitions was used before acquiring functional MRI data(Kim et al 2000). Twenty-eight axial slices (4mm thick, 0.5mm skip) parallel to the plane connecting the anterior and posterior commissures and covering the whole brain were imaged using a T2* weighted gradient echo spiral pulse sequence (TR = 2000 msec, TE = 30 msec, flip angle = 80° and 1 interleave)(Glover and Lai 1998). The field of view was 200 × 200 mm2, and the matrix size was 64×64, giving an in-plane spatial resolution of 3.125 mm. To aid in the localization of functional data, a high resolution T1-weighted spoiled grass gradient recalled (SPGR) 3D MRI sequence with the following parameters was used: 124 coronal slices 1.5mm thickness, no skip, repeat time 11 ms; echo time 2 ms; and flip angle 15°.
Data were pre-processed using SPM99 (http://www.fil.ion.ucl.ac.uk/spm). Images were corrected for movement using least square minimization without higher-order corrections for spin history, and normalized(Friston et al 1995) to the Montreal Neurological Institute (MNI) template. The functional images were normalized to the functional (echo planar image) MNI template and the structural images were normalized to the structural (T1-weighted) MNI template. Images were then resampled every 2 mm using sinc interpolation and smoothed with a 4mm Gaussian kernel to decrease spatial noise. Resampling and smoothing were done in 3 dimensions yielding a 2mm3 resolution and effective spatial smoothness (full width at half maximum) of 7.2 × 7.1 × 8.4 mm. Note that the difference in the x and y dimensions reflects the imprecision in the measurement as calculated by SPM's smoothness algorithm.
fMRI Analysis
For each subject, the smoothed, normalized fMRI images were concatenated across time to form a single 4-dimensional image. This image was then analyzed with FSL melodic ICA software (www.fmrib.ox.ac.uk/fsl/melodic2/index.html). ICA is a statistical technique that separates a set of signals into independent—uncorrelated and non-Gaussian—spatiotemporal components(Beckmann and Smith 2004). When applied to the T2* signal of fMRI, ICA allows not only for the removal of artifact(McKeown et al 1998; Quigley et al 2002), but for the isolation of task-activated neural networks(Calhoun et al 2002; Gu et al 2001; McKeown et al 1998). Most recently, ICA has been used to identify low-frequency neural networks during resting-state or cognitively undemanding fMRI scans(Beckmann et al 2005; Greicius et al 2004; van de Ven et al 2004). There is no consensus, as yet, on how to choose the optimal number of components, though methods to do so are in development(Calhoun et al 2001). We chose to have the analysis output 25 components (roughly 1/6 the number of timepoints in the scan). The melodic ICA applies a high-pass filter setting of 100s (full width at half maximum) which we used to reduce very-low frequency artifact such as scanner drift.
The automated, two-step process developed in our previous study(Greicius et al 2004) was then employed to select the component in each subject that most closely matched the default-mode network (Figure 1). First, because functional connectivity networks have been detected in low-frequency ranges(Cordes et al 2001), a frequency filter was applied to remove any components in which high-frequency signal (>0.1 Hz) constituted 50% or more of the total power in the Fourier spectrum. Next, a template of the default-mode network was used to select the “best-fit” of the remaining low-frequency components in each subject. To do this, we used a linear template-matching procedure that involves taking the average z-score of voxels falling within the template minus the average z-score of voxels outside the template and selecting the component in which this difference (the goodness-of-fit) was the greatest. Z-scores here reflect the degree to which a given voxel's timeseries correlates with the overall component timeseries, scaled by the standard deviation of the residual Gaussian noise. The z-score used here is therefore a measure of how many standard deviations a voxel's signal is from the background noise. As the standard template we used the map of the default-mode network derived from a separate group of 14 healthy controls (figure 1B in our previous study)(Greicius et al 2004). It is important to note that this approach does not alter the components to fit the template in any way, but merely scores the pre-determined components on how well they match the template. The goodness-of-fit scores are only used to select the “best-fit” component for each subject and are not used as a dependent variable in any subsequent imaging analyses. In order to test how well this approach works in selecting a uniquely representative default-mode component and to be certain that the approach did not differ across groups we compared the mean goodness-of-fit scores for the best-fit component and the second best-fit component within and across groups using paired and two-sample t-tests respectively.
Figure 1. Automated selection of the default-mode component.

Each subject's default-mode component is selected from among their 25 components based on the two-step process outlined above (shown here with only 3 components). Each component consists of a spatial map (colored axial images) and its corresponding timeseries shown beneath it. The color scale indicates the degree to which a given voxel's timeseries is correlated with the overall timeseries of that component (with yellow-red colors indicating a positive correlation and blue colors indicating a negative correlation). Firstly, because resting-state neural networks are driven by low-frequency oscillations, all high-frequency components (component 1 in this example) are removed using a frequency filter. The remaining low-frequency components are scored based on their spatial goodness-of-fit to a standard template of the default-mode network derived from a separate dataset (template not shown). The component with the highest goodness-of-fit score (component 3 here) is then entered into the group analyses. Note that all voxels of the selected component have z-scores, not just those voxels that fall within the regions defined by the standard template.
All group analyses were performed on the subjects' “best-fit” component images. It should be noted that while the “best-fit” components were selected with a standard template, the images have z-scores assigned to every voxel in the brain so that the group analyses were not constrained by the standard template used to select the components. All analyses employed a random-effects model that estimates the error variance across subjects, rather than across scans(Holmes and Friston 1998) and therefore provides a stronger generalization to the population from which data are acquired. Using SPM, one-sample t-tests and two-sample t-tests were calculated to compare the default-mode network qualitatively and quantitatively between the two groups. Within the depressed group we performed a covariate-of-interest analysis to determine if functional connectivity in any of the regions that showed greater functional connectivity compared to controls correlated significantly with the duration of the current depressive episode (these data were available for 24 of the 28 depressed subjects). Ideally we would have used the HDRS scores as our correlative measure but this measure's variance was reduced across the depressed subjects (owing to many subjects having a score near the entry criterion of 21).
For the one-sample t-tests, the best-fit component for each subject in the group (depressed or control calculated separately) was entered into the analysis and the z-scores (assigned by the ICA) at each voxel were averaged across all subjects in the group and compared to zero (the null hypothesis). Significant clusters of activation were determined using the joint expected probability distribution(Poline et al 1997) with height (p < 0.001) and extent (p < 0.001) thresholds, corrected at the whole-brain level. For the two-sample t-test, the best-fit components from both groups were entered into the analysis and the z-scores (assigned by the ICA) at each voxel were averaged within each group and then compared across groups. Significant clusters of activation were determined using height and extent thresholds of p < 0.01. For the covariate-of-interest analysis, each depressed subject's best-fit component was entered with the length in weeks of the current depressive episode into the analysis. Significant clusters of activation were determined using height and extent thresholds of p < 0.05. We do not report any clusters containing fewer than 20 voxels. The two-sample t-test was restricted (masked) to voxels within the network as defined by a one-sample t-test that included all 48 subjects (thresholded at p < 0.001 (height and extent)). The within-group, covariate analysis was restricted to those voxels (Figure 2C) where the depressed group showed greater functional connectivity than the control group in the initial two-sample test.
Figure 2. Increased default-mode network functional connectivity in subjects with major depression.
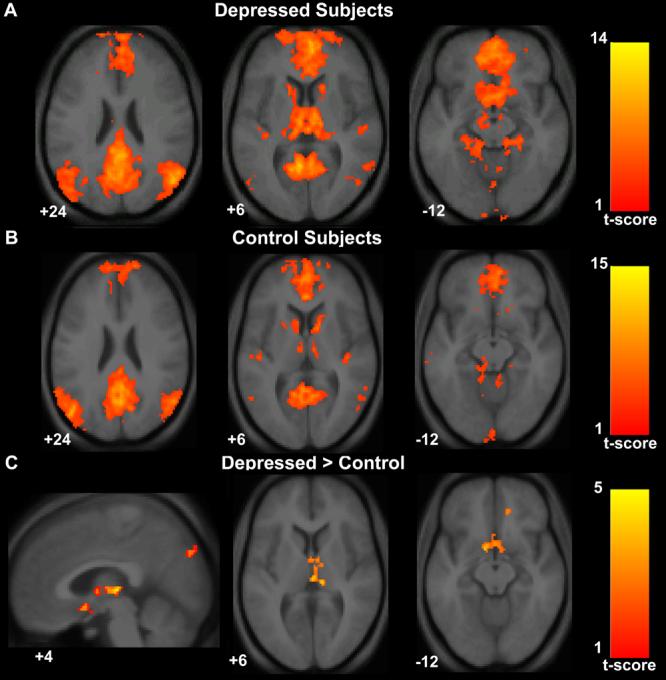
Axial images of group default-mode functional connectivity in depressed subjects (A) and in healthy controls (B). The contrast map in (C) demonstrates clusters in the subgenual cingulate, thalamus, and precuneus where resting-state functional connectivity was greater in depressed subjects versus controls. T-score bars are shown at right. Note that while the color scale range begins at 1, the minimum t-value for the analyses were 3.42 for the depressed group map (A), 3.58 for the control group map (B), and 2.41 for the depressed versus control contrast map (C). Numbers at the bottom left of the images refer to the z-coordinates (and for the sagittal image the x-coordinates) in the standard space of the Montreal Neurological Institute (MNI) template. The left side of the image corresponds to the left side of the brain.
Lastly, we performed a post-hoc, region-of-interest analysis using the single subgenual cingulate cluster whose functional connectivity correlated significantly with duration of the current depressive episode. In this analysis, the mean z-score of voxels within the subgenual cluster was correlated against the number of weeks of the current depressive episode.
For display purposes, a single, averaged, normalized image was derived from 30 structural scans taken from both groups. Statistical maps were superimposed on this structural image and cluster locations interpreted using known neuroanatomical landmarks. To aid in localization the MNI coordinates were translated into the stereotaxic coordinates of Talairach and Tournoux(Talairach and Tournoux 1988). Figures below show the cluster locations in MNI space while tables report cluster locations in Talairach coordinates.
Movement Analysis
To be certain that differences in movement were not contributing to any between-group differences in functional connectivity we calculated the maximum excursion movement values for the three planes of rotation (roll, pitch, and yaw) and three planes of translation (x, y, and z) as well as the root mean square movement for each of these planes(Thomason et al 2005). We submitted these 12 values to multiple analysis of covariance (MANCOVA) to assess for between-group differences.
Post-Hoc Check for Susceptibility Artifact Signal Loss
Given the detection of signal differences between groups in the subgenual cingulate, a region prone to fMRI signal loss(Ojemann et al 1997), we have included a qualitative comparison of the mean T2* signal in this region. To do so, we created mean T2* maps for each group by adding 1 volume (the tenth) from each subject's timeseries and dividing by the number of subjects. The mean T2* image for each of the two groups is shown in Figure 4 along with the subgenual cingulate cluster to demonstrate that there was adequate signal in this region.
Figure 4. Both groups show adequate T2* signal in the region of the subgenual cingulate.

The region of the subgenual cingulate is often prone to loss of T2* signal due to susceptibility artifact. Here it is shown that the scanning parameters used in this study allowed for adequate signal detection in this region that does not appear to differ between the groups. The mean T2* images from the 20 healthy controls (left panel) and the 28 depressed subjects (right panel) are shown with the crosshairs on the subgenual cluster (middle panel) that showed greater functional connectivity in depressed subjects.
RESULTS
Subjects
The control group had a mean age of 35.4 with 11 women and 9 men. The depressed group had a mean age of 38.5 with 16 women and 12 men. Groups did not differ significantly in mean age (t-test p = 0.46) or gender distribution (chi-square p = 0.88). The mean HDRS score was 25.4 in the depressed group with a standard deviation (SD) of 4. The mean HDRS score in the control group was 0.4 (SD 0.5).
Regarding exposure to psychotropic medications, control subjects and 8 of 28 depressed subjects were not taking any. Twenty of the 28 depressed subjects were taking one or more medications from the following classes: anti-depressants (19 subjects), anti-psychotics (9 subjects), anxiolytics (5 subjects), and mood stabilizers (2 subjects).
Data on length of the current depressive episode was available in 24 of the 28 depressed subjects. The mean duration of the current depressive episode did not differ significantly (Mann-Whitney p = 0.15) between the 16 depressed subjects taking medicines (210 weeks, SD 224 weeks) and the 8 depressed subjects not taking medicines (153 weeks, SD 245 weeks).
Movement Parameters
The values for maximum excursion and root mean square movement did not differ between the two groups in any of the three planes of rotation or three planes of translation (MANOVA, Wilks' lambda 0.81 (p = 0.77)).
Goodness-of-Fit Scores
Across the 48 subjects the mean goodness-of-fit score was 1.86 (SD 0.64) for the best-fit component; more than double the mean goodness-of-fit score (0.77, SD 0.33) for the second best-fit component. A paired t-test across the 48 subjects found that these values were significantly different (p < 0.0001). The two groups did not differ in their mean goodness-of-fit score for the best-fit component (controls 1.79, SD 0.5; depressed 1.9, SD 0.73; p = 0.54) or the second best-fit component (controls 0.76, SD 0.35; depressed 0.77, SD 0.32; p =0.95). These data suggest that our automated selection procedure is effecitve in selecting a unique component in each subject that corresponds to the default-mode network and further that the selection procedure worked equally well across the two groups.
Depressed Subjects versus Controls
Depressed subjects showed increased network functional connectivity in the subgenual cingulate, the thalamus, the orbitofrontal cortex, and the precuneus (Table 1, Figure 2). In the opposite contrast there were no clusters that showed significantly greater functional connectivity in the healthy control group compared to the depressed group(Table 1, Figure 2). To obtain a measure of effect size, we calculated Cohen's d for the mean z-score within the subgenual cingulate cluster. The healthy control mean subgenual z-score was 0.62 (SD 0.96) and the depressed mean subgenual z-score was 1.68 (SD 1.1) resulting in a Cohen's d of 1.01—a value conventionally interpreted as constituting a large effect size.
Table 1.
Significant clusters in the two-sample t-tests comparing default mode functional connectivity in MD subjects versus controls. Height and extent thresholds of p < 0.01 were used to determine significant clusters.
| Cluster anatomical locations (Brodmann's area) |
Cluster size(voxels) |
Maximal z-score primary peak |
Primary peak location |
|---|---|---|---|
| MD versus Controls | |||
| Thalamus | 170 | 4.48 | 4, −20, 5 |
| Subgenual cingulate (25) | 104 | 3.64 | −10, 5, −10 |
| Medial Prefrontal/Orbitofrontal (11) | 82 | 3.63 | 14, 42, −17 |
| Cuneus/Precuneus (19) | 89 | 3.36 | 2, −86, 37 |
| Controls versus MD | |||
| No significant clusters |
Depressed Network Covaried for Length of Current Episode
Depression refractoriness, as measured by the length in weeks of the current episode, was positively correlated with functional connectivity in the subgenual cingulate (Figure 3A). There were no regions that were significantly inversely correlated with duration of the current episode. In a post-hoc, region-of-interest analysis (Figure 3B), the correlation between weeks of depression and the mean z-score of voxels in the subgenual cluster was 0.49 (Fisher's r to z, p = 0.014). The mean z-score of voxels in the subgenual cluster did not differ significantly (Mann-Whitney p = 0.53) between the 20 depressed subjects taking medication (1.61, SD 1.16) and the 8 depressed subjects not taking medication (1.87, SD 0.97; see red circles in Figure 3B).
Figure 3. Subgenual cingulate functional connectivity in the default-mode network correlates with duration of the current depressive episode.

A sagittal image (A) shows the subgenual cingulate cluster whose resting-state functional connectivity correlated with the duration of the current depressive episode across 24 depressed subjects. The same finding is represented graphically (B) in a scattergram of duration in weeks against the mean z-score within the subgenual cluster shown in (A). The pearson correlation coefficient was 0.49 (Fisher's r to z, p = 0.014). Red circles indicate the 8 depressed subjects who were unmedicated.
Evaluation of Susceptibility Artifact in the Subgenual Cingulate Region
The subgenual cingulate region has adequate and equivalent T2* signal in the two groups as shown in Figure 4.
DISCUSSION
This is the first study to describe default-mode network abnormalities in major depression. The finding of increased subgenual cingulate functional connectivity in major depression provides cross-modality support for the growing body of evidence implicating this region as a dysfunctional node in a distributed limbic and paralimbic neural network(Botteron et al 2002; Drevets et al 2002; Drevets et al 1997; Hirayasu et al 1999; Kennedy et al 2001; Mayberg et al 2000; Ongur et al 1998; Osuch et al 2000). In a study exploring predictors of response to anterior cingulotomy, the subgenual cingulate and the thalamus (see below) were the two regions where preoperative resting-state metabolism was positively correlated with postoperative improvement(Dougherty et al 2003). The voxel-based measure used here to generate statistical maps of the default-mode network reflects the degree to which a particular voxel's timeseries is correlated with the overall timeseries of the entire default-mode network. Thus, we interpret our findings as showing that default-mode network functional connectivity in depression is disproportionately driven by activity in the subgenual cingulate. The relatively large effect size (Cohen's d = 1.01) of this subgenual finding lends a quantitative measure to the qualitative impression left by Figure 2 in which this appears to be a binary finding— the subgenual cingulate is a prominent node in the depressed group network and absent in the control group network. To our knowledge, none of the prior studies describing the default-mode network in healthy controls(Fox et al 2005; Fransson 2005; Greicius et al 2003; Raichle et al 2001), dementia patients(Greicius et al 2004; Lustig et al 2003; Rombouts et al 2005), or, most recently, autistic patients(Kennedy et al 2006) have reported this region and as such the presence of the subgenual cingulate in the default-mode network is, for now, a finding unique to depression.
The within-group, correlation analysis, demonstrating increased subgenual functional connectivity with increasing length of the current depressive episode, suggests that resting-state signal in the subgenual region may be a marker for refractoriness to treatment. Alternatively, increased signal here could result from (rather than predict) a prolonged period of depression. In either case, this finding is particularly relevant in light of the recent study showing that 4/6 patients with refractory depression responded to deep brain stimulation of the white matter tracts leading into the subgenual cingulate(Mayberg et al 2005). Increased resting-state functional connectivity in the other medial prefrontal/orbitofrontal cluster detected here is also in keeping with recent studies showing relative hypermetabolism in this regions in depression(Nofzinger et al 2005) and reduced metabolism in these regions following successful treatment of refractory depression.(Mayberg et al 2005)
The thalamus has only recently been subjected to intense scrutiny in depression. Six studies have appeared in the last three years suggesting functional and histological abnormalities in the thalamus of patients with depression. As mentioned above, the thalamus was one of two regions (along with the subgenual cingulate) where increased preoperative metabolism predicted a positive response to anterior cingulotomy in patients with refractory depression(Dougherty et al 2003). Holthoff and colleagues have shown that thalamic metabolism decreases in depressed subjects as they go from the acute to the remitted phase of the illness(Holthoff et al 2004). Similarly, depressed patients in remission show increased thalamic metabolism after tryptophan depletion but not after sham depletion(Neumeister et al 2004). At the cellular level, a recent postmortem study demonstrated increased neuronal number in the thalamus of patients with depression but not in patients with schizophrenia or bipolar disorder(Young et al 2004). The mediodorsal and anteroventral/anteromedial nuclei in particular were implicated in that study; while admittedly pushing the limits of our spatial resolution, the thalamic cluster shown in figure 2C appears near to, if not within, the mediodorsal nucleus. Most germane to our findings, a recent region-of-interest (ROI), resting-state connectivity analysis has shown reduced connectivity between the medial thalamus and the dorsal, putatively cognitive, aspect of the anterior cingulate in depressed subjects compared to controls(Anand et al 2005a). In the same group of subjects, resting-state connectivity between the medial thalamus and dorsal anterior cingulate normalized following treatment with sertraline(Anand et al 2005b). In light of these findings, we are encouraged by the detection here of increased thalamic functional connectivity in the default-mode network of depressed subjects. Taken together these results–in keeping with the limbic-cortical dysregulation model(Mayberg 1997)–suggest that in depressed subjects activity in the medial thalamus is excessively coupled to activity in the “affective” subgenual cingulate, at the cost of reduced connectivity to the “cognitive” dorsal anterior cingulate.
While we anticipated that some of the more posterior, default-mode regions associated with episodic memory retrieval might show reduced functional connectivity in depressed subjects there were in fact no significant clusters in the control > depressed contrast. There are a number of possible explanations for this null finding. In previous studies using 1.5 Tesla magnets, we have demonstrated strong hippocampal co-activation in the default-mode network(Greicius and Menon 2004; Greicius et al 2004) and one would anticipate this region showing reduced functional connectivity in depressed subjects. However, the increased susceptibility artifact found at 3 Tesla likely limited our ability to detect hippocampal co-activation in this study(Krasnow et al 2003). More recently using the spiral in/out protocol which recovers signal lost to susceptibility artifact(Glover and Law 2001), we have been able to demonstrate robust hippocampal co-activation in the default-mode network of healthy older controls at 3 Tesla (data not shown). We hope, therefore, to explore this possibility of reduced hippocampal functional connectivity in subsequent resting-state studies of depression using the spiral in/out protocol.
The main limitation of this study pertains to the discordant exposure to medications between the depressed group and the healthy controls. It is conceivable that network functional connectivity differences between these two groups reflect the fact that most of the depressed subjects, and none of the healthy controls, were taking psychotropic medications. Arguing against this potential confound is the fact that the medicated and unmedicated depressed subjects did not differ significantly in their subgenual cingulate functional connectivity or in the duration of the current depressive episode. Further, the distribution of the unmedicated depressed subjects (red circles) in Figure 3B also suggests that medication status did not play an important role in the correlation between duration of the current depressive episode and functional connectivity in the subgenual cingulate. Nonetheless, we cannot completely refute the potential confound of medication exposure in the current study. Similarly, we cannot rule out the possibility that different medication classes, among the several used by our patients, do not have differential effects on default mode network activity. The ideal study, of course, would contrast controls with depressed subjects in an unmedicated state, but such a study would face substantial practical and ethical hurdles.
Another important limitation to consider pertains to the potential confound of respiratory and cardiac cycle artifacts contributing to between-group differences in the default-mode network. It is known that with slow sampling rates (as in this study where one brain volume was scanned every 2 seconds) noise from the cardiac and respiratory cycle can alias into the low-frequency ranges at which resting-state connectivity is detected(Lowe et al 1998). Recent work from the Oxford group(Beckmann et al 2005; De Luca et al 2006) and the NIH group(Fukunaga et al In Press) both using FSL's melodic ICA–the same software employed in the current study–shows that ICA is able to detect components due to aliased physiologic signals and that these are distinct from components that represent resting-state neural networks. A subsequent study (Birn et al 2006) has confirmed that the contributions of aliased cardiac and respiratory signal to resting-state neural networks is relatively minor. The papers by the Oxford group(Beckmann et al 2005; De Luca et al 2006) and the paper by Fukunaga et al. also point, more generally, to the strength of ICA in being able to separate spatially distinct components (true neural networks on the one hand and cardiac or respiratory noise on the other) occurring in similar frequency ranges. It is helpful to compare these ICA-based studies with the Birn et al. study in which a region-of-interest (ROI) based connectivity analysis was used. The ROI-based approach is clearly more susceptible to contamination from non-neural low-frequency fluctuations than the ICA-based approach which– provided the non-neural sources have distinct spatial patterns–is adept at separating the “wheat” from the “chaff”. As such we are confident that the between-group differences demonstrated here with ICA reflect differences in neural network connectivity rather than non-neural respiratory or cardiac cycle noise.
To date, resting-state functional analysis of the brain in depression has relied predominantly on PET and, to a lesser degree, SPECT. The ICA-based analysis described here as well as the ROI-based approaches used by Anand and colleagues(Anand et al 2005a; Anand et al 2005b) show that resting-state fMRI is a promising addition to the armamentarium of imaging tools used in the study of depression. PET and fMRI differ considerably in the underlying physiological processes measured but nevertheless implicate a remarkably consistent set of brain regions across modalities. This suggests that there is a close relationship between the increased glucose metabolism detected, for example, in the subgenual cingulate of patients with depression and this region's excessive functional connectivity within the default mode network demonstrated in the current study. PET, though still an indirect measure of neuronal activity, is a step closer to the neural sources than is fMRI and currently allows for firmer quantification. This, in turn, allows for easier standardization of PET measures across time and across different scanners at different sites. The major advantages of fMRI are its finer spatial and temporal resolution. This difference in temporal resolution is particularly relevant in connectivity analyses which, in PET studies, must be done across subjects whereas fMRI can generate within-subject measures of interregional connectivity. PET has proven useful in demonstrating group-level treatment responses across several types of depression therapy(Mayberg et al 2000; Mayberg et al 2005; Mayberg et al 2002) and has the potential to help predict response to particular treatments(Dougherty et al 2003). While it remains to be seen if resting-state fMRI can perform similarly in gauging treatment response, the relatively large effect size associated with the subgenual finding reported here suggests that this is a potentially robust marker. If it proves sufficiently sensitive to measure treatment response, it would have the added potential of testing for early treatment responses detectable after a few days or weeks. In contrast, an interval of 2-3 months is typically required between repeated PET scans. Future work comparing or, ideally, combining these complementary modalities should provide insight into a number of lingering issues–the biological basis of depression subtypes, the role of imaging in predicting treatment response–and allow for a deeper understanding of the regional and network-level abnormalities that constitute depression.
Acknowledgments
This study was supported by grants from the Alzheimer's Association (NIRG-04-1060), the Stanford Bio-X Interdisciplinary Initiative, the Sinclair Imaging Fund and the following NIH grants: HD040761, HD031715, MH050604, MH047573, MH019938, NS048302, RR009784, and RR000070.
Footnotes
Publisher's Disclaimer: This is a PDF file of an unedited manuscript that has been accepted for publication. As a service to our customers we are providing this early version of the manuscript. The manuscript will undergo copyediting, typesetting, and review of the resulting proof before it is published in its final citable form. Please note that during the production process errors may be discovered which could affect the content, and all legal disclaimers that apply to the journal pertain.
REFERENCES
- American Psychiatric Association . Diagnostic and Statistical Manual of Mental Disorders. 4th edition American Psychiatric Press; Washington, DC: 2000. [Google Scholar]
- Anand A, Li Y, Wang Y, Wu J, Gao S, Bukhari L, et al. Activity and connectivity of brain mood regulating circuit in depression: a functional magnetic resonance study. Biol Psychiatry. 2005a;57:1079–1088. doi: 10.1016/j.biopsych.2005.02.021. [DOI] [PubMed] [Google Scholar]
- Anand A, Li Y, Wang Y, Wu J, Gao S, Bukhari L, et al. Antidepressant effect on connectivity of the mood-regulating circuit: an FMRI study. Neuropsychopharmacology. 2005b;30:1334–1344. doi: 10.1038/sj.npp.1300725. [DOI] [PubMed] [Google Scholar]
- Beckmann CF, DeLuca M, Devlin JT, Smith SM. Investigations into resting-state connectivity using independent component analysis. Philos Trans R Soc Lond B Biol Sci. 2005;360:1001–1013. doi: 10.1098/rstb.2005.1634. [DOI] [PMC free article] [PubMed] [Google Scholar]
- Beckmann CF, Smith SM. Probabilistic independent component analysis for functional magnetic resonance imaging. IEEE Trans Med Imaging. 2004;23:137–152. doi: 10.1109/TMI.2003.822821. [DOI] [PubMed] [Google Scholar]
- Birn RM, Diamond JB, Smith MA, Bandettini PA. Separating respiratory-variation-related fluctuations from neuronal-activity-related fluctuations in fMRI. Neuroimage. 2006;31:1536–1548. doi: 10.1016/j.neuroimage.2006.02.048. [DOI] [PubMed] [Google Scholar]
- Biswal B, Yetkin FZ, Haughton VM, Hyde JS. Functional connectivity in the motor cortex of resting human brain using echo-planar MRI. Magn Reson Med. 1995;34:537–541. doi: 10.1002/mrm.1910340409. [DOI] [PubMed] [Google Scholar]
- Botteron KN, Raichle ME, Drevets WC, Heath AC, Todd RD. Volumetric reduction in left subgenual prefrontal cortex in early onset depression. Biol Psychiatry. 2002;51:342–344. doi: 10.1016/s0006-3223(01)01280-x. [DOI] [PubMed] [Google Scholar]
- Buckner RL, Snyder AZ, Shannon BJ, LaRossa G, Sachs R, Fotenos AF, et al. Molecular, structural, and functional characterization of Alzheimer's disease: evidence for a relationship between default activity, amyloid, and memory. J Neurosci. 2005;25:7709–7717. doi: 10.1523/JNEUROSCI.2177-05.2005. [DOI] [PMC free article] [PubMed] [Google Scholar]
- Calhoun VD, Adali T, McGinty VB, Pekar JJ, Watson TD, Pearlson GD. fMRI activation in a visual-perception task: network of areas detected using the general linear model and independent components analysis. Neuroimage. 2001;14:1080–1088. doi: 10.1006/nimg.2001.0921. [DOI] [PubMed] [Google Scholar]
- Calhoun VD, Pekar JJ, McGinty VB, Adali T, Watson TD, Pearlson GD. Different activation dynamics in multiple neural systems during simulated driving. Hum Brain Mapp. 2002;16:158–167. doi: 10.1002/hbm.10032. [DOI] [PMC free article] [PubMed] [Google Scholar]
- Cordes D, Haughton VM, Arfanakis K, Carew JD, Turski PA, Moritz CH, et al. Frequencies contributing to functional connectivity in the cerebral cortex in “resting-state” data. AJNR Am J Neuroradiol. 2001;22:1326–1333. [PMC free article] [PubMed] [Google Scholar]
- De Luca M, Beckmann CF, De Stefano N, Matthews PM, Smith SM. fMRI resting state networks define distinct modes of long-distance interactions in the human brain. Neuroimage. 2006;29:1359–1367. doi: 10.1016/j.neuroimage.2005.08.035. [DOI] [PubMed] [Google Scholar]
- Dougherty DD, Weiss AP, Cosgrove GR, Alpert NM, Cassem EH, Nierenberg AA, et al. Cerebral metabolic correlates as potential predictors of response to anterior cingulotomy for treatment of major depression. J Neurosurg. 2003;99:1010–1017. doi: 10.3171/jns.2003.99.6.1010. [DOI] [PubMed] [Google Scholar]
- Drevets WC, Bogers W, Raichle ME. Functional anatomical correlates of antidepressant drug treatment assessed using PET measures of regional glucose metabolism. Eur Neuropsychopharmacol. 2002;12:527–544. doi: 10.1016/s0924-977x(02)00102-5. [DOI] [PubMed] [Google Scholar]
- Drevets WC, Price JL, Simpson JR, Jr., Todd RD, Reich T, Vannier M, Raichle ME. Subgenual prefrontal cortex abnormalities in mood disorders. Nature. 1997;386:824–827. doi: 10.1038/386824a0. [DOI] [PubMed] [Google Scholar]
- First MB, Spitzer RL, Gibbon M, Williams JBW. Structured Clinical Interview for DSM-IV-TR Axis I Disorders - Patient Edition (SCID-I/P, 2/2001 revision) American Psychiatric Press, Inc.; Washington, D.C.: 1997. [Google Scholar]
- Fossati P, Hevenor SJ, Graham SJ, Grady C, Keightley ML, Craik F, Mayberg H. In search of the emotional self: an FMRI study using positive and negative emotional words. Am J Psychiatry. 2003;160:1938–1945. doi: 10.1176/appi.ajp.160.11.1938. [DOI] [PubMed] [Google Scholar]
- Fox MD, Snyder AZ, Vincent JL, Corbetta M, Van Essen DC, Raichle ME. The human brain is intrinsically organized into dynamic, anticorrelated functional networks. Proc Natl Acad Sci U S A. 2005;102:9673–9678. doi: 10.1073/pnas.0504136102. [DOI] [PMC free article] [PubMed] [Google Scholar]
- Fransson P. Spontaneous low-frequency BOLD signal fluctuations: an fMRI investigation of the resting-state default mode of brain function hypothesis. Hum Brain Mapp. 2005;26:15–29. doi: 10.1002/hbm.20113. [DOI] [PMC free article] [PubMed] [Google Scholar]
- Friston KJ, Ashburner J, Frith CD, Poline JB, Heather JD, Frackowiak RSD. Spatial registration and normalization of images. Hum Brain Mapp. 1995;2:165–189. [Google Scholar]
- Fukunaga M, Horovitz SG, van Gelderen P, de Zwart JA, Jansma JM, Ikonomidou V, et al. Large-amplitude, spatially correlated fluctuations in BOLD fMRI signals during extended rest and early sleep stages. Magn Reson Imaging. In Press doi: 10.1016/j.mri.2006.04.018. [DOI] [PubMed] [Google Scholar]
- Glover GH, Lai S. Self-navigated spiral fMRI: interleaved versus single-shot. Magn Reson Med. 1998;39:361–368. doi: 10.1002/mrm.1910390305. [DOI] [PubMed] [Google Scholar]
- Glover GH, Law CS. Spiral-in/out BOLD fMRI for increased SNR and reduced susceptibility artifacts. Magn Reson Med. 2001;46:515–522. doi: 10.1002/mrm.1222. [DOI] [PubMed] [Google Scholar]
- Greicius MD, Krasnow B, Reiss AL, Menon V. Functional connectivity in the resting brain: a network analysis of the default mode hypothesis. Proc Natl Acad Sci U S A. 2003;100:253–258. doi: 10.1073/pnas.0135058100. [DOI] [PMC free article] [PubMed] [Google Scholar]
- Greicius MD, Menon V. Default-mode activity during a passive sensory task: Uncoupled from deactivation but impacting activation. J Cogn Neurosci. 2004;16:1484–1492. doi: 10.1162/0898929042568532. [DOI] [PubMed] [Google Scholar]
- Greicius MD, Srivastava G, Reiss AL, Menon V. Default-mode network activity distinguishes Alzheimer's disease from healthy aging: evidence from functional MRI. Proc Natl Acad Sci U S A. 2004;101:4637–4642. doi: 10.1073/pnas.0308627101. [DOI] [PMC free article] [PubMed] [Google Scholar]
- Gu H, Engelien W, Feng H, Silbersweig DA, Stern E, Yang Y. Mapping transient, randomly occurring neuropsychological events using independent component analysis. Neuroimage. 2001;14:1432–1443. doi: 10.1006/nimg.2001.0914. [DOI] [PubMed] [Google Scholar]
- Gusnard DA, Akbudak E, Shulman GL, Raichle ME. Medial prefrontal cortex and self-referential mental activity: relation to a default mode of brain function. Proc Natl Acad Sci U S A. 2001;98:4259–4264. doi: 10.1073/pnas.071043098. [DOI] [PMC free article] [PubMed] [Google Scholar]
- Hamilton M. A rating scale for depression. J Neurol Neurosurg Psychiatry. 1980;23:49–65. doi: 10.1136/jnnp.23.1.56. [DOI] [PMC free article] [PubMed] [Google Scholar]
- Hampson M, Peterson BS, Skudlarski P, Gatenby JC, Gore JC. Detection of functional connectivity using temporal correlations in MR images. Hum Brain Mapp. 2002;15:247–262. doi: 10.1002/hbm.10022. [DOI] [PMC free article] [PubMed] [Google Scholar]
- Harvey PO, Fossati P, Pochon JB, Levy R, Lebastard G, Lehericy S, et al. Cognitive control and brain resources in major depression: an fMRI study using the n-back task. Neuroimage. 2005;26:860–869. doi: 10.1016/j.neuroimage.2005.02.048. [DOI] [PubMed] [Google Scholar]
- Hirayasu Y, Shenton ME, Salisbury DF, Kwon JS, Wible CG, Fischer IA, et al. Subgenual cingulate cortex volume in first-episode psychosis. Am J Psychiatry. 1999;156:1091–1093. doi: 10.1176/ajp.156.7.1091. [DOI] [PMC free article] [PubMed] [Google Scholar]
- Holmes AP, Friston KJ. Generalisability, random effects & population inference. Neuroimage. 1998;7:S754. [Google Scholar]
- Holthoff VA, Beuthien-Baumann B, Zundorf G, Triemer A, Ludecke S, Winiecki P, et al. Changes in brain metabolism associated with remission in unipolar major depression. Acta Psychiatr Scand. 2004;110:184–194. doi: 10.1111/j.1600-0447.2004.00351.x. [DOI] [PubMed] [Google Scholar]
- Kelley WM, Macrae CN, Wyland CL, Caglar S, Inati S, Heatherton TF. Finding the self? An event-related fMRI study. J Cogn Neurosci. 2002;14:785–794. doi: 10.1162/08989290260138672. [DOI] [PubMed] [Google Scholar]
- Kennedy DP, Redcay E, Courchesne E. Failing to deactivate: resting functional abnormalities in autism. Proc Natl Acad Sci U S A. 2006;103:8275–8280. doi: 10.1073/pnas.0600674103. [DOI] [PMC free article] [PubMed] [Google Scholar]
- Kennedy SH, Evans KR, Kruger S, Mayberg HS, Meyer JH, McCann S, et al. Changes in regional brain glucose metabolism measured with positron emission tomography after paroxetine treatment of major depression. Am J Psychiatry. 2001;158:899–905. doi: 10.1176/appi.ajp.158.6.899. [DOI] [PubMed] [Google Scholar]
- Kim DH, Adalsteinsson E, Glover GH, Spielman S. SVD regularization algorithm for improved high-order shimming; Vol Proceedings of the 8th Annual Meeting of ISMRM; Denver. 2000. p. 1685. [Google Scholar]
- Krasnow B, Tamm L, Greicius MD, Yang TT, Glover GH, Reiss AL, Menon V. Comparison of fMRI activation at 3 and 1.5 T during perceptual, cognitive, and affective processing. Neuroimage. 2003;18:813–826. doi: 10.1016/s1053-8119(03)00002-8. [DOI] [PubMed] [Google Scholar]
- Liotti M, Mayberg HS, McGinnis S, Brannan SL, Jerabek P. Unmasking disease-specific cerebral blood flow abnormalities: mood challenge in patients with remitted unipolar depression. Am J Psychiatry. 2002;159:1830–1840. doi: 10.1176/appi.ajp.159.11.1830. [DOI] [PubMed] [Google Scholar]
- Lowe MJ, Mock BJ, Sorenson JA. Functional connectivity in single and multislice echoplanar imaging using resting-state fluctuations. Neuroimage. 1998;7:119–132. doi: 10.1006/nimg.1997.0315. [DOI] [PubMed] [Google Scholar]
- Lustig C, Snyder AZ, Bhakta M, O'Brien KC, McAvoy M, Raichle ME, et al. Functional deactivations: change with age and dementia of the Alzheimer type. Proc Natl Acad Sci U S A. 2003;100:14504–14509. doi: 10.1073/pnas.2235925100. [DOI] [PMC free article] [PubMed] [Google Scholar]
- MacQueen GM, Campbell S, McEwen BS, Macdonald K, Amano S, Joffe RT, et al. Course of illness, hippocampal function, and hippocampal volume in major depression. Proc Natl Acad Sci U S A. 2003;100:1387–1392. doi: 10.1073/pnas.0337481100. [DOI] [PMC free article] [PubMed] [Google Scholar]
- Maddock RJ, Garrett AS, Buonocore MH. Remembering familiar people: the posterior cingulate cortex and autobiographical memory retrieval. Neuroscience. 2001;104:667–676. doi: 10.1016/s0306-4522(01)00108-7. [DOI] [PubMed] [Google Scholar]
- Maddock RJ, Garrett AS, Buonocore MH. Posterior cingulate cortex activation by emotional words: fMRI evidence from a valence decision task. Hum Brain Mapp. 2003;18:30–41. doi: 10.1002/hbm.10075. [DOI] [PMC free article] [PubMed] [Google Scholar]
- Maguire EA, Mummery CJ. Differential modulation of a common memory retrieval network revealed by positron emission tomography. Hippocampus. 1999;9:54–61. doi: 10.1002/(SICI)1098-1063(1999)9:1<54::AID-HIPO6>3.0.CO;2-O. [DOI] [PubMed] [Google Scholar]
- Mayberg HS. Limbic-cortical dysregulation: a proposed model of depression. J Neuropsychiatry Clin Neurosci. 1997;9:471–481. doi: 10.1176/jnp.9.3.471. [DOI] [PubMed] [Google Scholar]
- Mayberg HS. Positron emission tomography imaging in depression: a neural systems perspective. Neuroimaging Clin N Am. 2003;13:805–815. doi: 10.1016/s1052-5149(03)00104-7. [DOI] [PubMed] [Google Scholar]
- Mayberg HS, Brannan SK, Tekell JL, Silva JA, Mahurin RK, McGinnis S, Jerabek PA. Regional metabolic effects of fluoxetine in major depression: serial changes and relationship to clinical response. Biol Psychiatry. 2000;48:830–843. doi: 10.1016/s0006-3223(00)01036-2. [DOI] [PubMed] [Google Scholar]
- Mayberg HS, Lozano AM, Voon V, McNeely HE, Seminowicz D, Hamani C, et al. Deep brain stimulation for treatment-resistant depression. Neuron. 2005;45:651–660. doi: 10.1016/j.neuron.2005.02.014. [DOI] [PubMed] [Google Scholar]
- Mayberg HS, Silva JA, Brannan SK, Tekell JL, Mahurin RK, McGinnis S, Jerabek PA. The functional neuroanatomy of the placebo effect. Am J Psychiatry. 2002;159:728–737. doi: 10.1176/appi.ajp.159.5.728. [DOI] [PubMed] [Google Scholar]
- McKeown MJ, Jung TP, Makeig S, Brown G, Kindermann SS, Lee TW, Sejnowski TJ. Spatially independent activity patterns in functional MRI data during the stroop color-naming task. Proc Natl Acad Sci U S A. 1998;95:803–810. doi: 10.1073/pnas.95.3.803. [DOI] [PMC free article] [PubMed] [Google Scholar]
- Neumeister A, Nugent AC, Waldeck T, Geraci M, Schwarz M, Bonne O, et al. Neural and behavioral responses to tryptophan depletion in unmedicated patients with remitted major depressive disorder and controls. Arch Gen Psychiatry. 2004;61:765–773. doi: 10.1001/archpsyc.61.8.765. [DOI] [PubMed] [Google Scholar]
- Nofzinger EA, Buysse DJ, Germain A, Price JC, Meltzer CC, Miewald JM, Kupfer DJ. Alterations in regional cerebral glucose metabolism across waking and non-rapid eye movement sleep in depression. Arch Gen Psychiatry. 2005;62:387–396. doi: 10.1001/archpsyc.62.4.387. [DOI] [PubMed] [Google Scholar]
- Ojemann JG, Akbudak E, Snyder AZ, McKinstry RC, Raichle ME, Conturo TE. Anatomic localization and quantitative analysis of gradient refocused echo-planar fMRI susceptibility artifacts. Neuroimage. 1997;6:156–167. doi: 10.1006/nimg.1997.0289. [DOI] [PubMed] [Google Scholar]
- Ongur D, Drevets WC, Price JL. Glial reduction in the subgenual prefrontal cortex in mood disorders. Proc Natl Acad Sci U S A. 1998;95:13290–13295. doi: 10.1073/pnas.95.22.13290. [DOI] [PMC free article] [PubMed] [Google Scholar]
- Osuch EA, Ketter TA, Kimbrell TA, George MS, Benson BE, Willis MW, et al. Regional cerebral metabolism associated with anxiety symptoms in affective disorder patients. Biol Psychiatry. 2000;48:1020–1023. doi: 10.1016/s0006-3223(00)00920-3. [DOI] [PubMed] [Google Scholar]
- Overall JE, Gorham DE. The brief psychiatric rating scale. Psychol Rep. 1961;10:799–812. [Google Scholar]
- Poline JB, Worsley KJ, Evans AC, Friston KJ. Combining spatial extent and peak intensity to test for activations in functional imaging. Neuroimage. 1997;5:83–96. doi: 10.1006/nimg.1996.0248. [DOI] [PubMed] [Google Scholar]
- Posener JA, DeBattista C, Williams GH, Kraemer HC, Kalehzan BM, Schatzberg AF. 24-Hour monitoring of cortisol and corticotropin secretion in psychotic and nonpsychotic major depression. Arch Gen Psychiatry. 2000;57:755–760. doi: 10.1001/archpsyc.57.8.755. [DOI] [PubMed] [Google Scholar]
- Quigley MA, Haughton VM, Carew J, Cordes D, Moritz CH, Meyerand ME. Comparison of independent component analysis and conventional hypothesis-driven analysis for clinical functional MR image processing. AJNR Am J Neuroradiol. 2002;23:49–58. [PMC free article] [PubMed] [Google Scholar]
- Raichle ME, MacLeod AM, Snyder AZ, Powers WJ, Gusnard DA, Shulman GL. A default mode of brain function. Proc Natl Acad Sci U S A. 2001;98:676–682. doi: 10.1073/pnas.98.2.676. [DOI] [PMC free article] [PubMed] [Google Scholar]
- Rombouts SA, Barkhof F, Goekoop R, Stam CJ, Scheltens P. Altered resting state networks in mild cognitive impairment and mild Alzheimer's disease: An fMRI study. Hum Brain Mapp. 2005;26:231–239. doi: 10.1002/hbm.20160. [DOI] [PMC free article] [PubMed] [Google Scholar]
- Talairach J, Tournoux P. Co-Planar Stereotaxic Atlas of the Human Brain. Thieme Verlag; Stuttgart: 1988. [Google Scholar]
- Thase ME, Hersen M, Bellack AS, Himmelhoch JM, Kupfer DJ. Validation of a Hamilton subscale for endogenomorphic depression. J Affect Disord. 1983;5:267–278. doi: 10.1016/0165-0327(83)90050-2. [DOI] [PubMed] [Google Scholar]
- Thomason ME, Burrows BE, Gabrieli JD, Glover GH. Breath holding reveals differences in fMRI BOLD signal in children and adults. Neuroimage. 2005;25:824–837. doi: 10.1016/j.neuroimage.2004.12.026. [DOI] [PubMed] [Google Scholar]
- van de Ven VG, Formisano E, Prvulovic D, Roeder CH, Linden DEJ. Functional connectivity as revealed by spatial independent component analysis of fMRI measurements during rest. Hum Brain Mapp. 2004;22:165–178. doi: 10.1002/hbm.20022. [DOI] [PMC free article] [PubMed] [Google Scholar]
- Videbech P. PET measurements of brain glucose metabolism and blood flow in major depressive disorder: a critical review. Acta Psychiatr Scand. 2000;101:11–20. doi: 10.1034/j.1600-0447.2000.101001011.x. [DOI] [PubMed] [Google Scholar]
- Xiong J, Parsons LM, Gao JH, Fox PT. Interregional connectivity to primary motor cortex revealed using MRI resting state images. Hum Brain Mapp. 1999;8:151–156. doi: 10.1002/(SICI)1097-0193(1999)8:2/3<151::AID-HBM13>3.0.CO;2-5. [DOI] [PMC free article] [PubMed] [Google Scholar]
- Young KA, Holcomb LA, Yazdani U, Hicks PB, German DC. Elevated neuron number in the limbic thalamus in major depression. Am J Psychiatry. 2004;161:1270–1277. doi: 10.1176/appi.ajp.161.7.1270. [DOI] [PubMed] [Google Scholar]