
Figure 3.
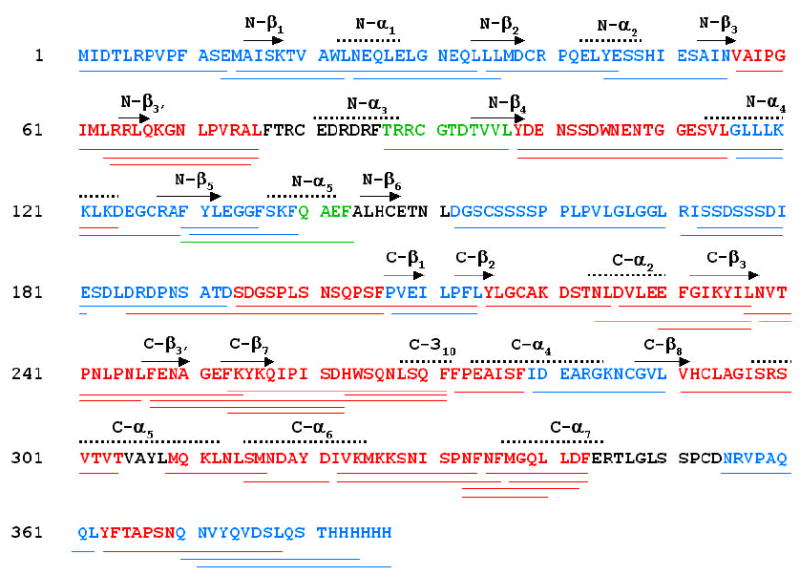
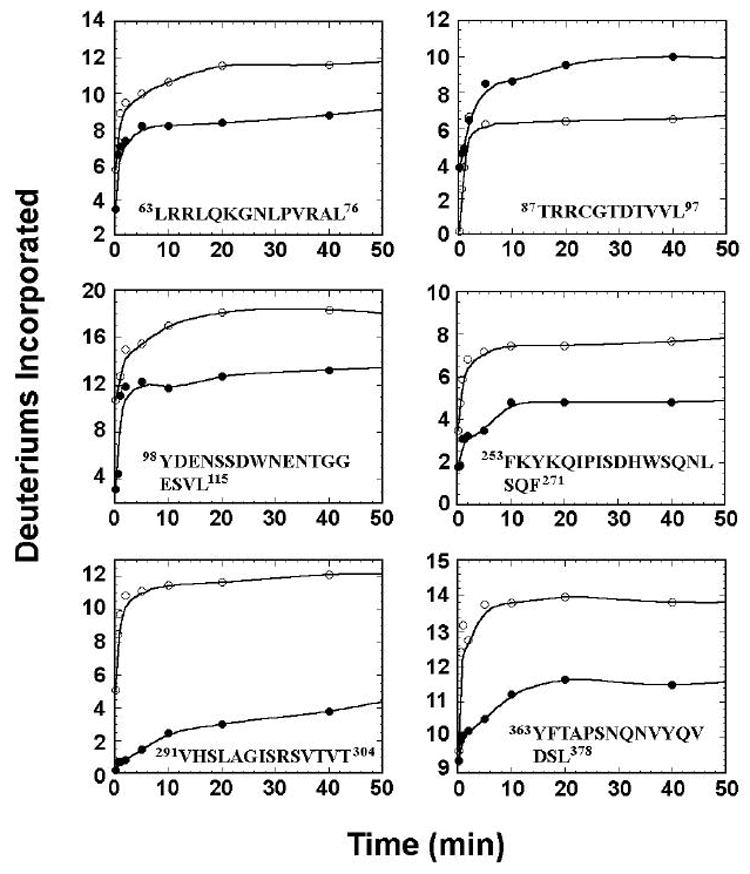
H/DX-MS analysis of MKP/C293S. (A) sequence coverage map of MKP3, showing 49 identified peptides in the MS/MS experiments. Indicated are peptides observed by H/DX-MS that exhibited a decrease (colored in red), an increase (colored in green), or no change (color in blue) in H/D exchange rates upon complex formation. Peptides in black were not identified in the MS/MS experiments. (B) time courses of deuterium uptake are shown for a number of peptides in MKP3/C293S that underwent significant changes in H/D exchange rates between the free (○) and ERK2/pTpY bound state (•).