

Summary
A statistical analysis of the Protein Databank (PDB) structures had led us to define a set of small 3D structural prototypes called Protein Blocks (PBs). This structural alphabet includes 16 PBs, each one defined by the (Φ, Ψ) dihedral angles of 5 consecutive residues. Here, we analyze the effect of the enlargement of the PDB on the PBs’ definition. The results highlight the quality of the 3D approximation ensured by the PBs. These last could be of great interest in ab initio modeling.
Keywords: Databases, Protein; Protein Structure, Secondary; Proteins; chemistry
Keywords: secondary structure, structure-sequence relationship, ab initio
Introduction
Protein folds are often described as a succession of secondary structures. Nonetheless, this description does not allow the protein structures to be precisely described at the 3D level, because (i) it omits the relative orientation of connecting regions, (ii) irregularities are found both in helical and extended structures [1, 2] and (iii) the coil state, which represents 50% of all residues, corresponds to a large set of distinct local protein structures [3].
These observations have led to a new view of 3D protein structures. They are now thought to be composed of a combination of small local structures or fragments defining “a structural alphabet” [4]. Different teams have described these local protein structures according to different criteria (e.g. [5]).
Our structural alphabet is composed of 16 average protein fragments, 5 residues in length, which we call Protein Blocks. These PBs have been used both to describe 3D protein backbones and to predict local structures [6 – 8]. They have been used to analyze long protein fragments [9 – 12] and to predict short loops [13]. Karchin and co-workers have compared the features of this alphabet with those of 8 other structural alphabets. Their results show clearly that our PB alphabet is highly informative, with the best predictive ability of those tested [14]. Here, we present a new evaluation of the PB features with an updated databank. This analysis focuses on the distribution of PB’s frequencies, their main transitions, the relationship between PBs and secondary structures and the evaluation of geometrical features of PBs with different criteria.
Datasets
This study considers four sets of proteins used in recent work [7, 9]. We preferentially used the PAPIA set, from the PDB-REPRDB database [15] composed of 717 protein chains and 180,854 residues. The set contains proteins with no more than 30% pairwise sequence identity, X-ray crystallographic resolutions better than 2.0 Å, and an R-factor less than 0.2. Each selected structure has a rmsd (root mean square deviation, average Euclidean distance between superimposed Cα) value greater than 10 Å between every representative chain. An updated dataset [8] is defined from the PDB-REPRDB database [15] with the same criteria as PAPIA. It comprises 1407 protein chains and 293,507 residues.
Protein coding
The protein structures are encoded as sequences of φ - ψ dihedral angles. They are cut into consecutive overlapping fragments, each M (= 5) amino acids in length. A fragment is defined by a signal of 2(M-1) dihedral angular values (= 8). The fragment signal is compared with each PB signal with the rmsda (root mean square deviation on angular values, the Euclidean distance of dihedral angles) measure. The lowest rmsda value for the 2(M-1) angles determines the PB assignment [6]. A PB is assigned to each position along the sequence except for the two residues on each end.
PB’s frequencies
The frequencies of the PBs remain stable between all the different databanks used (see column 2 of Table 1). Most of the PBs have a frequency variation less than 0.2% (compared to our previous study [6]). The greatest difference is observed for PB c, which decreases by 0.5% (from 8.63% to 8.12%). The PB j remains the less frequent PB (0.83%). The central part of repetitive structures, i.e. PB m for the α-helix and PB d for the β-strand represent 49.1% of all the PBs. Coarsely, the C and N-caps of PB m (PBs k, l, n, o and p) represent 19.1% of the databank, the C and N-caps of PB d (PBs a, b, c, e and f) 25.5% and the PBs entirely coils (PBs from g to j) 6.3%. The number of PB repeats, anr, (see column 3 of Table 1), of PB m increases slightly from 6.74 to a value of 7.00, i.e. the helices are longer than in the previous work. This fact is observed in all the new databanks.
Table 1. Protein Blocks characteristics.
For each protein block (PB; labeled from a to p) is given: (i) the occurrence frequency (freq), (ii) the average number of repeats (anr), i.e., the average number of times a PB repeats upon itself, (iii) the three main PB transition proportions to other PBs (major transitions), and the sum of these transitions (sum), only the transition frequencies more than 5% are noted, (iv) the transitions rarely observed, i.e. associated to a frequency < 0.5% (in bold their frequencies are < 0.1%) and, (v) the repartition in secondary structures of the central residue (α-helix, coil and β-strand) assigned by PSEA [16] and STRIDE [17] (in bold are highlighted the frequencies > 50%).
| major transitions (%) | transitions < 0.5 % | PSEA | STRIDE | |||||||
|---|---|---|---|---|---|---|---|---|---|---|
| 1st | 2nd | 3rd | sum. | α(%) | coil(%) | β(%) | α(%) | coil(%) | β(%) | |
| 51.0(c) | 16.9(f) | 9.4(d) | 77.3 | i, l, n, o | 0.1 | 66.7 | 33.2 | 0.1 | 75.8 | 24.1 |
| 48.4(d) | 15.9(c) | 12.9(f) | 77.2 | i, k, n, o | 0.1 | 96.7 | 3.2 | 0.1 | 85.3 | 14.6 |
| 62.6(d) | 23.5(f) | 5.7(e) | 91.8 | a, h, i, l, m, n, o, p | 0.8 | 48.9 | 50.3 | 0.0 | 57.6 | 42.4 |
| 50.4(f) | 26.3(c) | 19.9(e) | 96.6 | a, b, g, h, i, k, l, m, n, o, p | 0.0 | 19.6 | 80.4 | 0.0 | 29.0 | 71.0 |
| 81.1(h) | 8.6(d) | 89.7 | a, f, g, i, l, m, n, p | 0.0 | 42.8 | 57.2 | 0.0 | 45.5 | 54.5 | |
| 61.5(k) | 35.0(b) | 96.5 | a, c, d, g, h i, j, l, m, n, o, p | 0.1 | 70.7 | 29.3 | 0.0 | 73.3 | 26.7 | |
| 37.5(h) | 29.6(c) | 16.1(o) | 83.2 | i, j k, l,n | 7.6 | 88.3 | 4.0 | 13.3 | 80.2 | 6.4 |
| 68.0(i) | 13.8(j) | 8.5(k) | 90.3 | a, b, c, d, f, g, m | 0.1 | 76.4 | 23.5 | 2.0 | 76.2 | 21.9 |
| 82.8(a) | 6.2(l) | 89.0 | c, k, m, n, p | 0.0 | 97.8 | 2.1 | 2.0 | 90.3 | 7.7 | |
| 21.7(b) | 14.8(a) | 14.7(k) | 51.2 | g, p | 1.0 | 73.9 | 25.1 | 8.0 | 81.6 | 10.4 |
| 77.2(l) | 10.5(b) | 6.2(o) | 93.9 | a, c, d,e,f, h, i, j, p | 32.7 | 66.7 | 0.6 | 49.3 | 50.2 | 0.5 |
| 68.2(m) | 8.6(p) | 7.1(c) | 83.9 | d, e,h,i, j | 40.4 | 59.5 | 0.1 | 61.0 | 38.6 | 0.4 |
| 34.9(n) | 15.7(p) | 11.3(k) | 61.9 | a, d, e, f,h,i, j, o, | 86.1 | 13.9 | 0.0 | 92.3 | 7.6 | 0.1 |
| 92.4(o) | 92.4 | a, d, e, f,i, j, o | 62.4 | 37.6 | 0.0 | 75.7 | 24.0 | 0.3 | ||
| 78.2(p) | 6.5(m) | 5.6(i) | 90.3 | a, b, d, e,f, h, k | 37.9 | 61.6 | 0.5 | 50.8 | 49.0 | 0.2 |
| 58.6(a) | 23.7(c) | 7.6(m) | 89.9 | b, d, e, h, i, j, k, l, o, p | 9.0 | 87.3 | 3.7 | 17.1 | 81.3 | 1.6 |
| 63.9 | 10.8 | 7.3 | 89.3 | 32.9 | 42.1 | 25.0 | 37.8 | 39.7 | 22.5 | |
Transitions
The transitions between PBs are similar to the previous ones (cf. Table 1, col. 4 to 6) both in order and in percentage. Three PBs, i.e., PBs a, m and j, differ from the previous study (see Table 1 of [6]). For PBs a and m, only a small inversion of proportion for the third and fourth main transitions is observed. For PB a, its third main transition is now PB d (9.4%, previously 7.9%) instead of PB b that has a transition rate of 9.3% (previously 8.0%). For PB m, PB k (now 11.3% and previously 9.3%) has switched with PB b (8.1% and 9.7% respectively). As regards, no clear preferential transitions were favoured for PB j in the previous study [6]. The same conclusion is found again with some inversions.
With only the three most frequent transitions per PBs, 89.3% of all the transitions between the PBs of the databank are taken into account. This value does not take account of the repetition of PBs upon themselves, if they are considered the final value increases to 94.3%. This fact implies a high dependency between successive PBs, as shown in our previous work based on the analysis of series of 5 PBs [9].
Thus our structural alphabet is highly conditioned by the presence of a limited number of transitions between the PBs, i.e., the number of rarely observed transitions (transition rate < 0.5%, cf. Table 1, col.8) is high. Each PB has on average 7 transitions rarely observed and half them has a transition rate less than 0.1%. Moreover, 18 of them are never seen in the whole PDB. The rate of rarely observed PBs ranges between 2 (PB j) to 12 (PB f).
Secondary structures
The columns 9 to 14 sum up the secondary structure assignments done by PSEA [16] and STRIDE [17]. In our previous work [6], the assignment was done with a consensus method [18] based on other assignment methods. Comparisons between all those studies show the difficulties to define rules describing the secondary structures [13]. STRIDE and PSEA assignments differ sometimes by more than 20% (PB l, 40.4% vs. 61.0%). STRIDE is the closest to the previous consensus approach for most of the PBs (except for the PBs k, l and m). Globally, STRIDE assigns more α-helix state and PSEA more β-strand. They are roughly equivalent for the PBs with a high content in coil state. This result is in adequacy with (i) the observed differences between distinct secondary structure assignments [13, 18] and (ii) the distinction between secondary structure assignment and structural alphabet assignment [4].
Structural approximations
The PBs have been defined using rmsda measures (see Table 2, col. 2 to 5), i.e., a Euclidean distance on dihedral angular values (φ and ψ angles). Compared to our previous study [6], the mean rmsda remains at 30° with a standard deviation of 20°. The median rmsda equals only 26°. For 11 of the PBs, the median rmsda value is slightly smaller than the mean value. For PB m and PB n the median rmsda values drop to 7.6° and 15.0°.
Table 2. Protein Blocks characteristics.
For each protein block (PB; labeled from a to p) is given: (i) the root mean square deviation on angular value (rmsda) with its mean (mean), standard deviation (s.d.) and median (median) values, and the difference between the smallest rmsda and the second smallest rmsda (dif.), (ii) the root mean square deviation (rmsd) with its mean (mean), standard deviation (s.d.) and median (median) values, (iii) the mda120 value (mda120) and (iv) the distance between the first Cα and the last Cα (dC1–C5). In bold is given the minimal value between mean and median values. It enables to highlight, in most of the cases, the overestimation of the mean values due to some extreme values.
| PB | rmsda (°) | rmsda (Å) | mda120 | d(C1-C5) | ||||||
|---|---|---|---|---|---|---|---|---|---|---|
| mean | s.d. | median | dif.. | mean | s.d. | median | (%) | Å | ||
| a | 45.2 | 20.4 | 42.2 | 29.3 | 0.46 | 0.16 | 0.43 | 97.65 | 10.6 | |
| b | 42.5 | 15.4 | 41.3 | 20.3 | 0.47 | 0.19 | 0.43 | 97.34 | 10.0 | |
| c | 38.4 | 12.2 | 36.3 | 21.4 | 0.51 | 0.20 | 0.47 | 99.52 | 11.9 | |
| d | 29.7 | 14.6 | 25.7 | 27.2 | 0.41 | 0.20 | 0.36 | 99.85 | 12.5 | |
| e | 40.9 | 18.4 | 36.2 | 23.5 | 0.71 | 0.51 | 0.52 | 98.28 | 11.9 | |
| f | 37.5 | 14.7 | 33.7 | 22.1 | 0.40 | 0.15 | 0.38 | 99.21 | 11.3 | |
| g | 50.6 | 15.1 | 52.6 | 14.9 | 0.60 | 0.21 | 0.62 | 96.53 | 9.5 | |
| h | 47.0 | 17.9 | 50.0 | 20.9 | 0.46 | 0.18 | 0.42 | 96.22 | 8.5 | |
| i | 43.4 | 18.6 | 44.3 | 25.0 | 0.41 | 0.20 | 0.37 | 96.05 | 8.6 | |
| j | 49.0 | 18.7 | 48.2 | 19.6 | 0.83 | 0.48 | 0.76 | 92.51 | 8.4 | |
| k | 35.9 | 17.0 | 31.8 | 25.4 | 0.30 | 0.12 | 0.27 | 98.61 | 7.5 | |
| l | 32.5 | 20.8 | 23.6 | 27.3 | 0.53 | 0.29 | 0.46 | 98.04 | 7.3 | |
| m | 15.0 | 16.2 | 7.6 | 40.1 | 0.31 | 0.25 | 0.21 | 99.74 | 6.6 | |
| n | 26.8 | 22.3 | 15.0 | 31.2 | 0.31 | 0.22 | 0.23 | 96.96 | 6.5 | |
| o | 38.3 | 23.1 | 40.3 | 27.1 | 0.48 | 0.24 | 0.43 | 95.26 | 6.9 | |
| p | 43.8 | 20.6 | 52.6 | 25.9 | 0.47 | 0.20 | 0.43 | 97.30 | 9.4 | |
| Mean | 30.1 | 20.1 | 26.1 | 29.5 | 0.41 | 0.25 | 0.34 | 98.82 | 9.2 | |
The computation of rmsda values is less classical than rmsd values. Hence to estimate its discriminative power, we have calculated the difference between the smallest rmsda value which gives the assignment, and the second smallest rmsda value. They correspond to the two minimal Euclidean distances on dihedral angular values. This difference is high (mean value of 29.5°, i.e., the mean value is of 30° for the minimal rmsda and 59.5° for the second one, cf. Table 2, col.5). The most discriminative PBs are those associated with PB m, they show a low rmsda and the greatest difference with the second rmsda. The PBs associated with PB d constitutes the second category, i.e., low rmsda values and fair difference with the second rmsda. The least determined ones are PB g and PB j with high mean rmsda values of 50.6° and 49.0° and low differences values of 14.9° and 19.6° respectively.
The rmsd (average Euclidean distance between superimposed Cα) computation gives a mean value of 0.41 Å with a standard deviation of 0.25 Å and a median value of 0.34 Å (see Table 2, col. 6 to 8). In the previous work [6], this rmsd-value was higher (0.58 Å) because it was computed as all the fragments associated with a PB against all. Here, the rmsd value is the mean value obtained by superimposing all the fragments associated with a PB and the average PB 3D prototype. Hence, it corresponds to the approximation of protein structures. The median rmsd values are lower for all the PBs. For instance, PB m median rmsd value equals 0.21Å, PB d, 0.36Å and PB j, 0.76Å. Only PB g has a mean rmsd value slightly lower than its median rmsd value.
The mda120 value was used by Bystroff and Baker [19] and is adapted here for fragments five-residue long (see Table 2, col. 9). The mda120 criterion consists in the comparison of the 8 angles of the true protein fragment with the 8 angles of the assigned PB, i.e. PB with the lowest rmsda value. If no angle deviates of more than 120°, the 5 residues are considered as correctly approximated. The mda120 value is the proportion of residues considered -at least one time- as correctly approximated. As expected, most of the fragments are good according to the mda120 criterion. Analysis of the fragments considered as “not correctly approximated” by the mda120 criterion shows that they are always associated to high rmsd and high rmsda values. The best PBs, using this criterion, are the repetitive PBs m and d. As always, the poorest PB is PB j with a mda120 rate of only 92.5%. In fact, this last corresponds to the most variable PB.
Cα distance
The distribution of Cα - Cα distances have been analyzed for every PBs and between every position i (i ranging from i−2 to i+2). A statistical analysis of all these measures has been done using a Principal Component Analysis (PCA [20]). This last shows that the most significant parameter is the distance between the N and C ends (see Table 2, col. 10). The other distances are less important, their significance is directly related to the number of residues, i.e., a distance between 4 residues is more informative than a distance between 3 residues and so on. These values categorize clearly a gradient between the full extended β-strand (PB d with a C1–C5 distance of 12.5 Å) to the C-cap of α-helix (PB n, distance of 6.5 Å). This last is slightly more compact than the helix, PB m (distance of 6.6 Å).
Conclusion
In this study, we verified that the PB definitions remain valid after the size of the databank more than tripled (from 86,628 [6] to 293,507 residues). We have highlighted different points. First, the distribution of the PB frequencies remains equivalent in all the non-redundant databank. Second, the transitions between all the PBs remain also highly constant. Third, the comparison with classical secondary structure assignments is not trivial as the assignment methods differ and the correspondence with PBs is not simply direct. For instance, the PB d has the geometrical feature of β-strand, but is assigned by PSEA [16] and by STRIDE [17] to coil state with a rate equal to 19.6% and to 29.0%, respectively. Finally, the analysis of the geometrical properties of PBs shows that they approximate well every part of the protein structures. Moreover, the use of rmsda distance allows a good discrimination. The comparisons of the rmsd and rmsda values of PBs show that rmsda is more sensitive to small structural variations than rmsd. The rmsda is more discriminative to split up the N- or C-caps of repetitive structures from the core of the repetitive structures. For instance, PBs m and n have a discriminative rmsda value for a low rmsd value. Furthermore, we analyze for the first time the PB with mda120 criterion, finding consistent correspondence with the results found with rmsda criterion.
PBs may be used to analyze particular function-related structural motifs. For instance, the relation of PBs to the canonical structures in immunoglobulins could be very interesting [21]. As the prediction of the PBs from sequence has been recently improved [8], PBs could be of great interest in an ab initio modeling. Indeed, Pei and Grishin have recently emphasized the interest of prediction of blocks for predicting local protein structures [22]. In fact, the use of dihedral angles –basis of the PB definitions- has already shown its interest in exploring the folding process [23], especially outside the repetitive structures [24]. This kind of approaches lies on the fact that proteins are constructed from a small catalog of recognizable parts that fits together in a limited number of ways [25]. The major limitation of these approaches is the assembly of the different parts to build a complete and reliable protein structure.
Figure 1.
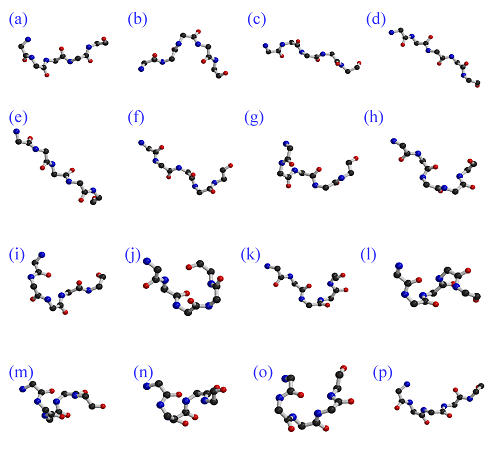
Protein Blocks. From left to right and top to bottom the 16 Protein Blocks (labeled from a to p) are shown. For each PB, the N-cap is on the left and the C-cap is on the right.
Acknowledgments
I would like to thank Cristina Benros, Laurent Fourrier, Massimo Tortue, Patrick Fuchs, Delphine Flatters, Anne-Claude Camproux, Serge Hazout and Catherine Etchebest for fruitful discussions. This work was supported by grants from French Institute for Health and Medical Research (INSERM), from the Ministère de l’Enseignement Supérieur et de la Recherche and from “Action Bioinformatique inter EPST” 2003–2004.
References
- 1.Bansal M, Kumar Velavan R. HELANAL - A program to characterize helix geometry in proteins. J Biomol Struct Dyn. 2000;17:811–819. doi: 10.1080/07391102.2000.10506570. [DOI] [PubMed] [Google Scholar]
- 2.Chan AW, Hutchinson EG, Harris D, Thornton JM. Identification, classification, and analysis of β-bulges in proteins. Protein Sci. 1993;2:1574–1590. doi: 10.1002/pro.5560021004. [DOI] [PMC free article] [PubMed] [Google Scholar]
- 3.Michalsky E, Goede A, Preissner R. Loops In Proteins (LIP)--a comprehensive loop database for homology modeling. Protein Eng. 2003;16:979–985. doi: 10.1093/protein/gzg119. [DOI] [PubMed] [Google Scholar]
- 4.de Brevern AG, Camproux AC, Hazout S, Etchebest C, Tuffery P. Beyond the secondary structures: the structural alphabets. In: Sangadai SG, editor. Recent Adv In Prot Eng. Research signpost; Trivandrum, India: 2001. pp. 319–331. [Google Scholar]
- 5.Camproux AC, Gautier R, Tufféry P. A Hidden Markov Model derived structural alphabet for proteins. J Mol Biol. 2004;339:591–605. doi: 10.1016/j.jmb.2004.04.005. [DOI] [PubMed] [Google Scholar]
- 6.de Brevern AG, Etchebest C, Hazout S. Bayesian probabilistic approach for predicting backbone structures in terms of protein blocks. Proteins. 2000;41:271–287. doi: 10.1002/1097-0134(20001115)41:3<271::aid-prot10>3.0.co;2-z. [DOI] [PubMed] [Google Scholar]
- 7.de Brevern AG, Benros C, Gautier R, Valadié H, Hazout S, Etchebest C. Local backbone structure prediction of proteins. In silico Biology. 2004;4:31. [PMC free article] [PubMed] [Google Scholar]
- 8.Etchebest C, Benros C, Hazout S, de Brevern AG. A structural alphabet for local protein structures: improved prediction methods. Proteins. 2005 doi: 10.1002/prot.20458. accepted. [DOI] [PubMed] [Google Scholar]
- 9.de Brevern AG, Valadié H, Hazout S, Etchebest C. Extension of a local backbone description using a structural alphabet: A new approach to the sequence-structure relationship. Protein Sci. 2002;11:2871–2886. doi: 10.1110/ps.0220502. [DOI] [PMC free article] [PubMed] [Google Scholar]
- 10.de Brevern AG, Hazout S. Compacting local protein folds by a “Hybrid Protein Model”. Theor Chem Acc. 2001;106(1/2):36–47. [Google Scholar]
- 11.de Brevern AG, Hazout S. Improvement of “Hybrid Protein Model” to define an optimal repertory of contiguous 3D protein structure fragments. Bioinformatics. 2003;19:345–353. doi: 10.1093/bioinformatics/btf859. [DOI] [PubMed] [Google Scholar]
- 12.Benros C, de Brevern AG, Hazout S. Hybrid Protein Model (HPM): A method for building a library of overlapping local structural prototypes. sensitivity study and improvements of the training. IEEE Int Work NNSP 2003. 2003;1:53–70. [Google Scholar]
- 13.Fourrier L, Benros C, de Brevern AG. Use of a structural alphabet for analysis of short loops connecting repetitive structures. BMC Bioinformatics. 2004;5:58. doi: 10.1186/1471-2105-5-58. [DOI] [PMC free article] [PubMed] [Google Scholar]
- 14.Karchin R, Cline M, Mandel-Gutfreund Y, Karplus K. Hidden Markov models that use predicted local structure for fold recognition: alphabets of backbone geometry. Proteins. 2003;51:504–514. doi: 10.1002/prot.10369. [DOI] [PubMed] [Google Scholar]
- 15.Noguchi T, Matsuda H, Akiyama Y. PDB-REPRDB: a database of representative protein chains from the Protein Data Bank (PDB) Nucleic Acids Res. 2001;29:219–220. doi: 10.1093/nar/29.1.219. [DOI] [PMC free article] [PubMed] [Google Scholar]
- 16.Labesse G, Colloc’h N, Pothier J, Mornon J-P. PSEA: a new efficient assignment of secondary structure from Cα trace of proteins. Comput Appl Biosci. 1997;13:291–295. doi: 10.1093/bioinformatics/13.3.291. [DOI] [PubMed] [Google Scholar]
- 17.Frishman D, Argos P. Knowledge-based protein secondary structure assignment. Proteins. 1995;23:566–579. doi: 10.1002/prot.340230412. [DOI] [PubMed] [Google Scholar]
- 18.Colloc’h N, Etchebest C, Thoreau E, Henrissat B, Mornon J-P. Comparison of three algorithms for the assignment of secondary structure in proteins: the advantages of a consensus assignment. Protein Eng. 1993;6:377–382. doi: 10.1093/protein/6.4.377. [DOI] [PubMed] [Google Scholar]
- 19.Bystroff C, Baker D. Prediction of local structure in proteins using a library of sequence-structure motif. J Mol Biol. 1998;281:565–577. doi: 10.1006/jmbi.1998.1943. [DOI] [PubMed] [Google Scholar]
- 20.Mardia KV, Kent JT, Bibby JM. Multivariate Analysis. Academic Press; 1979. [Google Scholar]
- 21.Al-Lazikani B, Lesk AM, Chothia C. Standard conformations for the canonical structures of immunoglobulins. J Mol Biol. 1997;273:927–948. doi: 10.1006/jmbi.1997.1354. [DOI] [PubMed] [Google Scholar]
- 22.Pei J, Grishin NV. Combining evolutionary and structural information for local protein structure prediction. Proteins. 2004;56:782–794. doi: 10.1002/prot.20158. [DOI] [PubMed] [Google Scholar]
- 23.Jurkowski W, Brylinski M, Konieczny L, Wiiniowski Z, Roterman I. Conformational subspace in simulation of early-stage protein folding. Proteins. 2004;55:115–127. doi: 10.1002/prot.20002. [DOI] [PubMed] [Google Scholar]
- 24.Kuang R, Leslie CS, Yang AS. Protein backbone angle prediction with machine learning approaches. Bioinformatics. 2004;20:1612–1621. doi: 10.1093/bioinformatics/bth136. [DOI] [PubMed] [Google Scholar]
- 25.Fitzkee NC, Fleming PJ, Gong H, Panasik N, Street TO, Rose GD. Are proteins made from a limited parts list? Trends in Biochemical Sciences. 2005;30:73–80. doi: 10.1016/j.tibs.2004.12.005. [DOI] [PubMed] [Google Scholar]