Abstract
Decreases in blood pH activate NHE3, the proximal tubular apical membrane Na/H antiporter. In cultured renal epithelial cells, activation of the endothelin-B (ETB) receptor increases NHE3 activity. To examine the role of the ETB receptor in the response to acidosis in vivo, the present studies examined ETB receptor–deficient mice, rescued from neonatal lethality by expression of a dopamine β-hydroxylase promoter/ETB receptor transgene (Tg/Tg:ETB–/– mice). In proximal tubule suspensions from Tg/Tg:ETB+/– mice, 10–8 M endothelin-1 (ET-1) increased NHE3 activity, but this treatment had no effect on tubules from Tg/Tg:ETB–/– mice. Acid ingestion for 7 days caused a greater decrease in blood HCO3– concentration in Tg/Tg:ETB–/– mice compared with Tg/Tg:ETB+/+ and Tg/Tg:ETB+/– mice. Whereas acid ingestion increased apical membrane NHE3 by 42–46% in Tg/Tg:ETB+/+ and Tg/Tg:ETB+/– mice, it had no effect on NHE3 in Tg/Tg:ETB–/– mice. In C57BL/6 mice, excess acid ingestion increased renal cortical preproET-1 mRNA expression 2.4-fold and decreased preproET-3 mRNA expression by 37%. On a control diet, Tg/Tg:ETB–/– mice had low rates of ammonium excretion, which could not be attributed to an inability to acidify the urine, as well as hypercitraturia, with increased titratable acid excretion. Acid ingestion increased ammonium excretion, citrate absorption, and titratable acid excretion to the same levels in Tg/Tg:ETB–/– and Tg/Tg:ETB+/+ mice. In conclusion, metabolic acidosis increases ET-1 expression, which increases NHE3 activity via the ETB receptor.
Introduction
When challenged with increased extrarenal acid generation, the kidney increases renal acid excretion, preventing severe metabolic acidosis and complications such as bone demineralization, nephrolithiasis, and muscle wasting. One component of this response is an increase in the activity and abundance of renal cortical brush border membrane NHE3, the proximal tubule apical membrane Na/H antiporter (1, 2). In opossum kidney clone P (OKP) cells, a cell line with characteristics of the renal proximal tubule, decreases in media pH also increase apical membrane NHE3 activity (3).
The endothelins (ETs) are a family of three isoforms (ET-1, ET-2, and ET-3) that interact with two receptors, ETA and ETB. ET-1 and ET-2 bind to the ETA receptor with high affinity, whereas all three ET isoforms bind to the ETB receptor. ET-1 and ET-3 are expressed in the kidney, but their physiological roles have not been defined. In the renal proximal tubule, the endothelins increase apical membrane Na/H antiporter activity (4, 5). In OKP cells, the endothelins activate NHE3 via the ETB receptor (6).
The present studies address the hypothesis that the endothelins play a key role in mediating the effect of acidosis on NHE3. Results demonstrate that acid ingestion leads to increased renal cortical preproET-1 and decreased preproET-3 mRNA expression. ET-1 activates NHE3 in mouse proximal tubules via the ETB receptor. In mice lacking renal tubular ETB receptors, acid ingestion causes a larger decrease in blood HCO3– concentration, owing in part to a failure to activate NHE3.
Methods
Materials.
All chemicals were obtained from Sigma Chemical Co. (St. Louis, Missouri, USA), unless indicated below. Collagenase A was obtained from Boehringer Mannheim; guanidinium thiocyanate, dNTP, yeast tRNA, phenol, Taq polymerase, RNase inhibitor, Superscript II RT and restriction enzymes were obtained from Life Technologies Inc.; T7 RNA Polymerase from Stratagene (La Jolla, California, USA); and TA cloning vector from Invitrogen Corp. (San Diego, California, USA).
Experimental animals.
Experiments were performed in C57BL/6 mice and also in mice in which the ETB receptor has been genetically disrupted by homologous recombination, rescued from aganglionic megacolon by expression of a dopamine β-hydroxylase promoter/ETB receptor transgene (7, 8). Metabolic acidosis was induced by addition of 0.3 M NH4Cl to drinking water for 7 days. After anesthetizing the animals with intraperitoneal injection of Ketamine and Xylamine, the kidneys were rapidly harvested and a sample of arterial blood was collected.
Isolation of proximal tubule suspension.
A suspension of proximal tubule segments was prepared using an approach modified from Kumar et al. (9). Immediately after removal of the kidneys, the superficial cortex was carefully dissected and incubated in DMEM/Ham’s F12 (pH 7.4) (95%O2, 5%CO2), with 1 mg/ml collagenase, and 0.1% BSA, for sequential 10-minute digestion periods at 37°C. Supernatants were pooled and filtered through a 150-μm stainless steel sieve, and the filtrate was centrifuged at 50 g for 1 minute to sediment the tubule fragments. The pellet was suspended in 15 times its volume and allowed to settle on ice for 7–10 minutes, the supernatant discarded, and the process repeated. The final pellet was resuspended in DMEM/Ham’s F12 medium, and the suspension was confirmed visually to contain at least 90% proximal tubule segments.
Measurement of intracellular pH (pHi) and Na/H antiporter activity in tubule suspensions.
pHi was measured in tubule suspensions using BCECF, as the ratio of fluorescence with excitation at 500 and 450 nm (530 nm emission wavelength) (10). Proximal tubules were incubated for 25 minutes at 37°C with BCECF-AM in DMEM/Ham’s F12 medium (pH 7.4). The tubules were then washed three times by gentle centrifugation in Na-free medium containing (in mM) 140 N-methyl-D-glucamine chloride (NMDG-Cl), 3 KCl, 1 CaCl2, 1 MgCl2, 0.2 K2HPO4, 0.8 KH2PO4, 10 HEPES, 5 glucose, 1 alanine and 0.1 mg/ml BSA (pH 7.4) (solution A), and then resuspended in the same solution. Before assay, aliquots of tubules were incubated with 13 μM nigericin for 1 minute, then washed twice with 2% BSA in solution A, and suspended in solution A. The initial rate of pHi recovery (dpHi/dt) was measured in response to Na addition (final Na concentration, 70 mM).
Brush border membrane vesicle isolation and measurement of Na/H antiporter activity.
Na/H antiporter activity was assayed as pH-driven 22Na uptake in brush border membrane vesicles (BBMVs). Dissected kidney cortex from four to six kidneys was immersed in ice-cold buffer containing 300 mM mannitol, 6 mM EGTA, and 0.5 mM PMSF, titrated to pH 7.4 with Tris, and homogenized 10 times with a Dounce homogenizer and then with 15 strokes in a Teflon-glass homogenizer at 4°C. BBMVs were isolated by the Mg-EGTA aggregation method (11). The final BBMV fraction was loaded with intravesicular buffer (300 mM Mannitol, 20 mM MES, titrated to pH 5.5 with Tris). A total of 100 μl extravesicular buffer (300 mM mannitol, 20 mM Tris, titrated to pH 7.5 with HEPES) containing 0.2 mM 22NaCl was added to 15 μl of vesicles (30–40 μg vesicle protein) at room temperature, and after 10 seconds the reaction was stopped by addition of ice-cold extravesicular buffer containing 1 mM amiloride and then filtration through a 0.65 μm filter (Millipore Corp., Bedford, Massachusetts, USA). The 22Na uptakes were performed in triplicate and corrected for retention of isotope by the filter.
Quantification of preproET-1 and preproET-3 mRNA abundances by competitive RT-PCR.
PreproET-1 and preproET-3 mRNA abundance were quantified by competitive RT-PCR using a heterologous internal standard as described elsewhere (12). For preproET-1, the internal heterologous sequence was a 321-bp rat NHE3 product generated by RT-PCR as described previously (13). For preproET-3, the internal heterologous sequence was a 701-bp OKP NHE3 product generated by PCR using the following primers: 5′-TGGAGTCTACCTCAGTGGCA-3′ (sense, 777-796) and 5′- GGTACTTGTTCAGAAGCCAT-3′ (antisense, 1458–1477). The preproET-1 and preproET-3 hybrids were then subcloned into a TA vector, and cRNA was transcribed from 5 μg of EcoI RI–cut DNA template with T7 RNA polymerase.
Total RNA from mouse kidney cortex was extracted using phenol/chloroform. cDNA was synthesized from total RNA and cRNA using Superscript II RT with random primers incubated at 25°C for 10 minutes and at 42°C for 50 minutes. The reaction was stopped by incubation at 75°C for 15 minutes. For PCR, 2 μl of the cDNA solution was supplemented with 5 μl of 10X PCR buffer, 1 μl of 50 mM MgCl2, 10 pmol of each primer, 1 μl of a 10 mM dNTP solution, and 1.25 U Taq polymerase in a final volume of 50 μl. PreproET-1 primers were 5′-ATGGATTATTTTCCCGTGAT-3′ (sense, bp 1–20) and 5′-GGGAGTGTTGACCCAGATGA-3′ (antisense, bp 212–231) (14), and preproET-3 primers were 5′-TTCATGGAGCCGGGGCTGTG-3′ (sense, bp 347–366) and 5′-GGCCTTTCTGCTCTCCCGGAA-3′ (antisense, bp 895–915). Samples were denatured at 95°C for 4 minutes, followed by 32 cycles of 95°C for 1.5 minutes, 50°C (for preproET-1) or 56°C (for preproET-3) for 1.5 minutes, and 72°C for 1.5 minutes. Final extension was for 10 minutes at 72°C. Fluorescence intensity of each PCR product was measured on NIH Image software (version 1.51; National Institutes of Health, Bethesda, Maryland, USA). mRNA abundance is expressed in attomoles per nanogram total RNA, calculated as described previously (13).
Northern blot analysis.
For Northern blot analysis, 15 μg of total RNA was size fractioned by agarose-formaldehyde gel electrophoresis and transferred to nylon membranes. The phosphoenolpyruvate carboxykinase (PEPCK) probe was synthesized from a PstI/PstI PEPCK fragment by random hexamer priming using [a-32P]-dCTP. PEPCK mRNA abundance was quantified by image analysis and normalized for loading using an 18S rRNA oligonucleotide probe synthesized as described elsewhere (15).
Statistics.
Results are expressed as mean ± SEM. Differences between means were evaluated using the paired or unpaired t test or ANOVA as appropriate. P < 0.05 was considered statistically significant.
Results
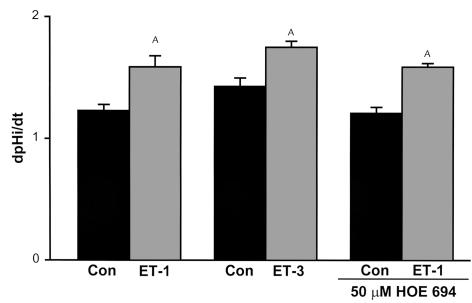
In suspended mouse proximal tubules from C57BL/6 mice, Na/H antiporter activity was measured as the rate of Na-dependent cell pH recovery from an acid load. A concentration of 10–8 M ET-1 applied for 30 minutes increased Na/H antiporter activity by 29% (P < 0.005) (Figure 1). Fifty μM HOE694 inhibits NHE1 and 2, but does not affect NHE3 (16). This concentration of HOE694 did not inhibit Na/H activity in the absence or presence of ET-1 (P < 0.001, vehicle versus ET-1), indicating that NHE3 is the major Na/H antiporter isoform of the mouse proximal tubule. The 10–8 M ET-3 also caused a 22% increase in Na/H antiporter activity (P < 0.01), implying that the effect is mediated by the ETB receptor, which binds ET-1 and ET-3 with similar affinity. This agrees with results in cultured OKP cells in which ET-1 regulates NHE3 activity via the ETB receptor (6, 17).
Figure 1.
NHE3 is activated via the ETB receptor. 10–8 M ET-1 with or without 50 mM HOE694, or 10–8 M ET-3, was added to suspensions of mouse proximal tubules from C57BL/6 mice, and Na/H antiporter activity was assessed as the rate of Na-dependent cell pH recovery from an acid load (dpHi/dt). ET-1: n = 11; ET-3: n = 6; ET-1 + HOE694: n = 7 (Con, control) and n = 6 (ET-1). AP < 0.05.
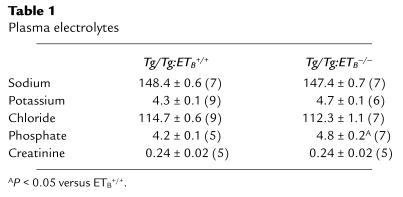
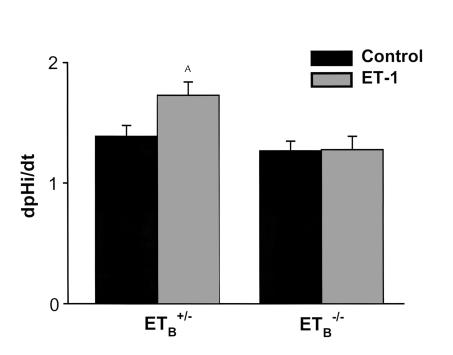
To examine this question further, we utilized mice in which the ETB receptor had been genetically disrupted (7) but that were rescued from aganglionic megacolon by expression of an ETB receptor transgene driven by a dopamine β-hydroxylase promoter (Tg/Tg:ETB–/– mice) (8). Tg/Tg:ETB–/– mice appear healthy and grow normally. Their plasma Na, K, Cl, and creatinine levels are similar to those seen in Tg/Tg:ETB+/+ mice (Table 1). In proximal tubule suspensions from Tg/Tg:ETB+/– mice, 10-8 M ET-1 increased NHE3 activity by 25% (P < 0.05), whereas in tubules from Tg/Tg:ETB–/– mice ET-1 had no effect (Figure 2). Thus, regulation of NHE3 is mediated by the ETB receptor in the mouse proximal tubule, and most importantly, proximal tubules from Tg/Tg:ETB–/– mice do not respond to ET-1.
Table 1.
Plasma electrolytes
Figure 2.
ET-1 activates NHE3 in mouse proximal tubules via the ETB receptor. 10–8 M ET-1 was added to suspensions of mouse proximal tubules from Tg/Tg:ETB+/– and Tg/Tg:ETB–/– mice, and Na/H antiporter activity was assessed as the rate of Na-dependent cell pH recovery from an acid load (dpHi/dt). Tg/Tg:ETB+/–, n = 6; Tg/Tg:ETB–/–, n = 9. AP < 0.05.
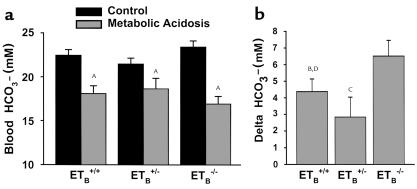
To examine the effect of chronic metabolic acidosis in these mice, 0.3 M NH4Cl was added to the drinking water of acidotic mice for 7 days. Acid administration caused a decrease in blood HCO3– concentration in Tg/Tg:ETB+/+, Tg/Tg:ETB+/–, and Tg/Tg:ETB–/– mice, but the decrease was greater in Tg/Tg:ETB–/– mice than in the other two groups (Figure 3). Acid ingestion also caused a decrease in blood HCO3– concentration in C57BL/6 mice (control 23.4 ± 0.6 vs. acid 19.3 ± 1.12 mM; P < 0.05) that was similar to that seen in Tg/Tg:ETB+/+ and Tg/Tg:ETB+/– mice. This result implies that one or more components of the homeostatic response to acid are deficient in receptor-deficient mice.
Figure 3.
Chronic acid feeding causes a more severe acidosis in Tg/Tg:ETB–/– mice. Tg/Tg:ETB+/+, Tg/Tg:ETB+/–, and Tg/Tg:ETB–/– mice were fed control or acid diets (metabolic acidosis) for 7 days. Arterial blood gases were measured, and the measured pH and pCO2 were used to calculate blood HCO3– concentration. (a) Blood HCO3– levels. AP < 0.05 versus control (b). Acid-induced change in blood HCO3– levels. BP = 0.06, CP < 0.05 versus Tg/Tg:ETB–/–; DP = NS versus Tg/Tg:ETB+/–. Tg/Tg:ETB+/+, n = 12; Tg/Tg:ETB+/–, n = 12; and Tg/Tg:ETB–/–, n = 14.
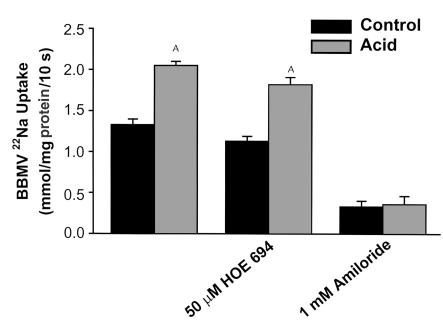
Renal cortical apical membrane Na/H antiporter activity was assessed in isolated renal cortical BBMVs as pH gradient–driven 22Na uptake. Seven days of acid feeding to Tg/Tg;ETB+/– and Tg/Tg;ETB+/+ mice caused a 54% increase in 22Na uptake (P < 0.001) (Figure 4). The 50 μM HOE694 had no effect on 22Na uptake in BBMVs from control or acid fed mice, nor on the effect of acid to stimulate 22Na uptake (P < 0.001). One mM amiloride inhibited uptake in both conditions (P < 0.001) and prevented the acid-induced increase in 22Na uptake. Together these studies indicate that NHE3 mediates Na uptake under control and acid conditions.
Figure 4.
NHE3 mediates Na/H antiporter activity in control and acid conditions. Na/H antiporter activity was assayed as 22Na uptake in BBMVs prepared from renal cortex of control and acid-fed mice. Without inhibitors: n = 4; HOE 694: n = 4; Amiloride: n = 3. AP < 0.05.
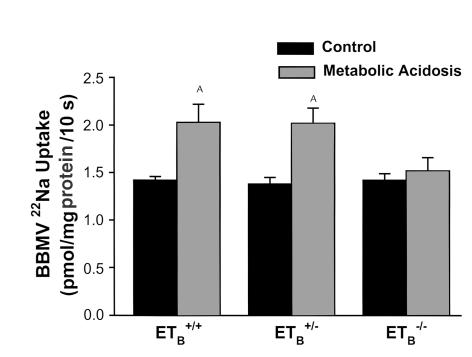
Acid administration to Tg/Tg:ETB+/+ and Tg/Tg:ETB+/– mice increased NHE3 activity by 42–46%, but was without effect in Tg/Tg:ETB–/– mice (Figure 5). Acid ingestion increased NHE3 activity by 41% in C57BL/6 mice, similar to that which occurred in the Tg/Tg:ETB+/+ and Tg/Tg:ETB+/– mice (P < 0.05). The absence of an effect of acid feeding on NHE3 in Tg/Tg:ETB–/– mice occurred in spite of the greater magnitude of the decrease in blood HCO3– concentration in these mice (Figure 3). Thus, the ETB receptor is required for regulation of NHE3 by chronic metabolic acidosis.
Figure 5.
Chronic acid feeding does not increase NHE3 activity in Tg/Tg:ETB–/– mice. Tg/Tg:ETB+/+, Tg/Tg:ETB+/–, and Tg/Tg:ETB–/– mice were fed control or acid diets (metabolic acidosis) for 7 days. BBMVs were isolated from renal cortex and NHE3 activity measured as pH gradient–driven 22Na uptake. Tg/Tg:ETB+/+, n = 4; Tg/Tg:ETB+/–, n = 4; and Tg/Tg:ETB–/–, n = 5. AP < 0.05.
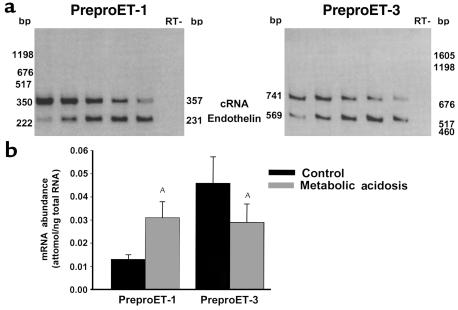
The ETB receptor binds ET-1 and ET-3, both of which are expressed in the kidney. The abundances of preproET-1 and preproET-3 mRNA were measured by quantitative competitive RT-PCR with a heterologous cRNA template. Chronic metabolic acidosis caused a 2.4-fold increase in renal cortical preproET-1 mRNA abundance and a 37% decrease in preproET-3 mRNA abundance (Figure 6). Thus, chronic metabolic acidosis increases ET-1 expression, which then binds to the ETB receptor and activates NHE3.
Figure 6.
Acid feeding increases preproET-1 mRNA expression in wild-type mice. C57BL/6 mice were fed control or acid diets (metabolic acidosis) for 7 days. PreproET-1 and preproET-3 mRNA abundance were measured by competitive RT-PCR, using a heterologous competitive RNA template. (a) Typical experiment. Sample quantities were 1.4 μg (preproET-1) and 0.7 μg (preproET-3) total renal cortical RNA. Template quantities (cRNA, attomoles) were for preproET-1: lane 1, 51.8; lane 2, 10.4; lane 3, 2.6; lane 4, 1.3; and lane 5, 0.65; and for preproET-3: lane 1, 119.3; lane 2, 59.6; lane 3, 29.8; lane 4, 14.9; and lane 5, 7.5. (b) Summary of results. PreproET-1, n = 6; PreproET-3, n = 5. AP < 0.05.
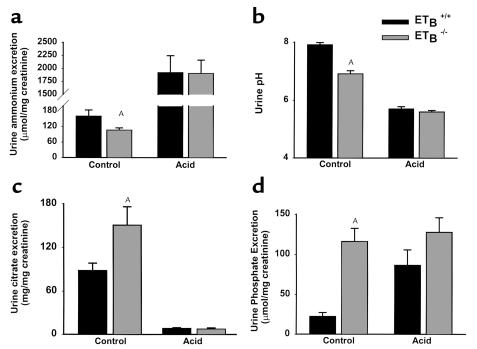
We next examined the components of renal net acid excretion under baseline conditions and after 7 days of acid administration in Tg/Tg:ETB+/+ and Tg/Tg:ETB–/– mice. On a control diet, Tg/Tg:ETB–/– mice had a 34% lower rate of urinary ammonium excretion than that seen in Tg/Tg:ETB+/+ mice (Figure 7a). The rate of urinary ammonium excretion is determined by the ammonia concentration in the renal medullary interstitium and by the urinary acidity that traps ammonia in the collecting duct lumen by converting it to ammonium. Tg/Tg:ETB–/– mice had a lower urine pH than Tg/Tg:ETB+/+ mice (Figure 7b), indicating that the decrease in ammonium excretion cannot be attributed to impaired urinary acidification with a secondary decrease in the trapping of ammonium in the lumen. The most important determinant of interstitial ammonia concentration is the rate of ammonia synthesis, which occurs largely in the proximal tubule and which is likely decreased in Tg/Tg:ETB–/– mice. Because citrate metabolism generates HCO3–, citrate excretion represents alkali loss. Urinary citrate excretion is regulated predominantly by the rate of proximal tubular citrate absorption. Urinary citrate excretion was 72% greater in Tg/Tg:ETB–/– mice compared with Tg/Tg:ETB+/+ mice (Figure 7c).
Figure 7.
Effects of acid feeding on urinary excretion in Tg/Tg:ETB+/+ and Tg/Tg:ETB–/– mice. Urine was collected from Tg/Tg:ETB+/+ and Tg/Tg:ETB–/– mice at baseline and after 7 days of acid ingestion. Samples were analyzed for (a) ammonium, (b) pH, (c) citrate, (d) phosphate, and creatinine concentrations. Urinary ammonium, citrate, and phosphate excretion are expressed as the ratio of their respective urinary concentrations to the creatinine concentration measured on the same sample. Ammonium: control, n = 19; acid, n = 8. Urine pH: control, n = 21; acid n = 10 (Tg/Tg:ETB+/+), n = 9 (Tg/Tg:ETB–/–). Citrate: control, n = 14 (Tg/Tg:ETB+/+), n = 15 (Tg/Tg:ETB–/–); acid, n = 7. Phosphate: control, n = 14 (Tg/Tg:ETB+/+), n = 15 (Tg/Tg:ETB–/–); acid, n = 7. AP < 0.05.
The major component of renal titratable acid excretion is monobasic phosphate, whose excretion rate can be estimated from urinary phosphate excretion and urinary pH. Urinary phosphate excretion rate was fivefold greater in Tg/Tg:ETB–/– mice than in Tg/Tg:ETB+/+ mice (Figure 7d). This, together with the lower urinary pH (Figure 7b), implies that titratable acid excretion is significantly greater in Tg/Tg:ETB–/– mice. Plasma phosphate was elevated in Tg/Tg:ETB–/– mice (4.8 ± 0.2 mg/dl) compared with Tg/Tg:ETB+/+ mice (4.2 ± 0.1 mg/dl) (P < 0.05; Table 1), suggesting that hyperphosphaturia in Tg/Tg:ETB–/– mice is secondary to an extrarenal abnormality in intestinal phosphate absorption or bone phosphate resorption. The lower urine pH also indicates a lower rate of HCO3– excretion in Tg/Tg:ETB–/– mice.
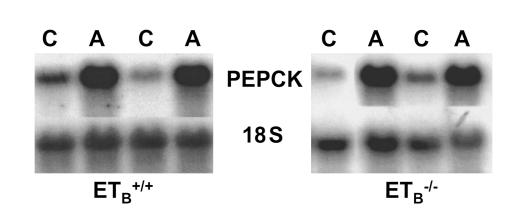
Acid administration increased ammonium excretion and decreased citrate excretion to similar levels in Tg/Tg;ETB+/+ mice and Tg/Tg:ETB–/– mice (Figure 7, a and c). The greater effect of acid in Tg/Tg:ETB–/– mice is likely due to the greater decrease in blood HCO3– concentration (Figure 3). PEPCK is key to ammonia synthesis and gluconeogenesis, and its mRNA abundance is increased in metabolic acidosis. Seven days of acid administration caused a fivefold increase in PEPCK mRNA in Tg/Tg:ETB+/+ mice, and a 13-fold increase in Tg/Tg:ETB–/– mice (Figure 8). The greater increase in Tg/Tg:ETB–/– mice parallels the greater increase in ammonium excretion.
Figure 8.
Acid feeding increases PEPCK mRNA in Tg/Tg:ETB+/+ and Tg/Tg:ETB–/– mice. Tg/Tg:ETB+/+ and Tg/Tg:ETB–/– mice were fed control or acid diets for 7 days. PEPCK mRNA abundance was measured on total renal cortical RNA by northern blot and normalized for 18S rRNA abundance. C, control; A, acid. Tg/Tg:ETB+/+, n = 3. Tg/Tg:ETB–/–, n = 5.
Acid administration caused urinary phosphate excretion to increase in Tg/Tg:ETB+/+ mice, but had no effect in Tg/Tg:ETB–/– mice (Figure 7d). Urine pH decreased to similar levels in the two groups of mice. After 7 days of acidosis, renal acid excretion was similar in Tg/Tg:ETB+/+ and Tg/Tg:ETB–/– mice, as evidenced by similar ammonium, citrate, and phosphate excretion rates, and similar urine pH.
Discussion
Previous studies have found that the kidney expresses ET-1 and ET-3, and that these endothelins can activate proximal tubule acidification by activating the proximal tubule Na/H antiporter (4, 5, 18). In OKP cells, this effect has been shown to be mediated by the ETB receptor, and to involve phosphorylation and trafficking of NHE3 to the apical membrane (6, 17, 19). However, the physiological role subserved by this effect of the endothelins in vivo has remained obscure.
The present studies demonstrate an important role for the endothelins in mediating the renal response to acidosis. Metabolic acidosis increases renal cortical preproET-1 mRNA expression. Wesson previously demonstrated increased renal interstitial ET-1 levels in acidosis (20). Acid-induced increases in ET-1 production may occur in the proximal tubular epithelium, but could also occur in neighboring endothelial cells. ET-1 expression is typically regulated by preproET-1gene transcription, which is commonly regulated by an AP-1 binding site in the preproET-1 promoter. Acidosis increases c-fos, c-jun, and junB expression and AP-1 activity in kidney cells, and thus could activate the promoter through this mechanism (21, 22).
Given that ET-1 and ET-3 bind to the ETB receptor with equal affinity, one would predict that the observed increase in ET-1 and decrease in ET-3 would cancel each other out. However, because the endothelins are autocrine/paracrine factors, this would depend on the location of their production. Thus, the increase in ET-1 levels may be near the proximal tubule, whereas the decrease in ET-3 levels may be at a more distant location. In addition, it should be noted that in these studies we measured mRNA abundance. The magnitude of the changes in protein concentrations may be different. The results in the knockout mice together with studies that show that the endothelins activate NHE3, suggest that the increase in ET-1 levels dominates.
To study the role of the endothelins and the ETB receptor, we utilized mice in which the ETB receptor has been genetically disrupted by homologous recombination (7). These mice have pigment abnormalities and aganglionic megacolon, both related to a failure of neural crest cells to migrate normally. Due to the aganglionic megacolon, animals become ill and die soon after birth, preventing their use in physiological studies. To address this, these mice have been crossed with mice expressing a dopamine β-hydroxylase promoter/ETB receptor transgene. This promoter causes the ETB receptor to be expressed in all cells that activate this promoter, including the cells that migrate to form the cholinergic ganglia of the colon (8). The net result is that these animals are rescued from aganglionic megacolon, and, although still having pigment abnormalities, they are able to survive to adulthood. The animals also are hypertensive (8) and hyperphosphatemic. Other electrolytes are normal. Although the ETB receptor will be expressed in adult cells that express dopamine β-hydroxylase, this is likely confined to adrenergic cells. To confirm that the proximal tubule does not express the ETB receptor, we showed that proximal tubules from these mice do not respond to ET-1.
The present studies demonstrate that ET-1 activates NHE3 in mouse proximal tubule cells via the ETB receptor, similar to results in cultured OKP cells (6, 17). Acidosis-induced increases in ET-1 levels lead to ETB receptor activation, which is then responsible for the increase in renal cortical NHE3 activity. In the absence of ETB receptors, acidosis has no effect on NHE3 activity. Although the most likely explanation for these results is that the ETB receptor mediates the effect of acidosis on NHE3, it is possible that the absence of this receptor has more complicated effects that result indirectly in a failure to activate NHE3. To address this, we have recently performed parallel studies in cultured OKP cells, wherein acid incubation for 6 hours increases NHE3 activity. This effect is blocked by BQ788, an ETB receptors blocker, confirming a role for proximal tubule ETB receptors (23). Wesson similarly found that intravenous administration of ETB receptor blockers prevented the effect of acidosis on distal nephron H+ secretion (20).
Under basal conditions, renal net acid excretion should be equal in Tg/Tg:ETB+/+ and Tg/Tg:ETB–/– mice, as both groups of animals are in balance on the same diet. However, the components of net acid excretion are different in Tg/Tg:ETB+/+ and Tg/Tg:ETB–/– mice. Ammonia excretion in low and citrate excretion is high, both representing decreases in net acid excretion. These changes are counterbalanced by higher titratable acid and lower urinary HCO3– excretion. These latter effects are likely due to hyperphosphaturia, which stimulates distal acidification. Increased delivery of phosphate to the distal nephron stimulates acid secretion not only as a buffer, but also as a nonreabsorbable anion, which causes a more luminal negative voltage that enhances H+ secretion (24). When Tg/Tg:ETB–/– mice were placed on a low-phosphate diet that prevented hyperphosphaturia, urine pH increased to 7.4, a value similar to the urine pH of 7.8 in Tg/Tg:ETB+/+ mice on a low-phosphate diet.
Ingestion of excess acid caused net acid excretion to increase to similar levels in Tg/Tg:ETB+/+ and Tg/Tg:ETB–/– mice. This was associated with a greater decrease in blood HCO3– concentration in Tg/Tg:ETB–/– mice than in the other groups of mice. The most straightforward explanation is that this is due to a failure of these mice to normally activate acidification mechanisms in response to excess acid ingestion. The present studies demonstrate a failure to activate NHE3 and a failure to increase phosphaturia, and Wesson has demonstrated a failure to activate distal acidification (20). However, it is also possible that other mechanisms contribute to this.
Although these three defects exist in the response to dietary acid, their effect on blood HCO3– concentration is small. There is a slightly greater decrease in blood HCO3– concentration in Tg/Tg:ETB–/– mice, but no statistically significant difference in the resulting blood HCO3– concentration. This result implies that other acidification mechanisms that are normally regulated in Tg/Tg:ETB–/– mice, are able to compensate. In support of this, blood HCO3– concentration is decreased by only 3 mEq/l in mice completely lacking NHE3 (25). However, it should be noted that small unmeasurable changes in blood HCO3– concentration can have profound pathophysiological effects on bone, muscle, and kidney (26).
In the present studies, administration of acid for 7 days caused a metabolic acidosis. Using a similar acid feeding protocol in rats, acid feeding caused a metabolic acidosis at 3 days that recovered to normal levels at 7 days (1). This therefore represents a species difference between rats and mice. In recent studies in rats, we found that the acid-induced increase in renal cortical preproET-1 levels is only seen when blood HCO3– concentration is decreased (27).
The ETB receptor plays an important role in the developmental migration of neural crest cells, causing mice and humans deficient in this receptor to develop aganglionic megacolon and pigment abnormalities (7, 28). The receptor is also responsible for preventing high blood pressure by causing vasodilation and inhibiting renal NaCl retention (29). The present studies demonstrate an additional role in the regulation of renal acid excretion. As ET receptor blockers are used clinically to prevent some of the pathophysiological effects of ETA receptor activation, it may be advisable to utilize selective ETA receptor antagonists, so as to avoid the deleterious consequences of ETB receptor blockade.
Acknowledgments
Technical assistance was provided by Kavita Mahti and Ebtesam Abdel-Salam. These studies were supported by grants from the NIH (DK39298, DK20543, and DK48482), the Advanced Research Program of the state of Texas, and the Veterans Administration. M. Yanagisawa is an Investigator of the Howard Hughes Medical Institute.
References
- 1.Ambühl PM, et al. Chronic metabolic acidosis increases NHE3 protein abundance in rat kidney. Am J Physiol. 1996;271:F917–F925. doi: 10.1152/ajprenal.1996.271.4.F917. [DOI] [PubMed] [Google Scholar]
- 2.Wu MS, Biemesderfer D, Giebisch G, Aronson P. Role of NHE3 in mediating renal brush border Na+-H+ exchange. Adaptation to metabolic acidosis. J Biol Chem. 1996;271:32749–32752. doi: 10.1074/jbc.271.51.32749. [DOI] [PubMed] [Google Scholar]
- 3.Amemiya M, Yamaji Y, Cano A, Moe OW, Alpern RJ. Acid incubation increases NHE-3 mRNA abundance in OKP cells. Am J Physiol. 1995;269:C126–C133. doi: 10.1152/ajpcell.1995.269.1.C126. [DOI] [PubMed] [Google Scholar]
- 4.Guntupalli J, DuBose TD. Effects of endothelin on rat renal proximal tubule Na-Pi cotransport and Na-H exchange. Am J Physiol. 1994;266:F658–F666. doi: 10.1152/ajprenal.1994.266.4.F658. [DOI] [PubMed] [Google Scholar]
- 5.Eiam-Ong S, Hilden SA, King AJ, Johns CA, Madias NE. Endothelin-1 stimulates the apical Na/H and Na/HCO3 transporters in rabbit renal cortex. Kidney Int. 1992;42:18–24. doi: 10.1038/ki.1992.255. [DOI] [PubMed] [Google Scholar]
- 6.Chu TS, Peng Y, Cano A, Yanagisawa M, Alpern RJ. EndothelinB receptor activates NHE-3 by a Ca2+-dependent pathway in OKP cells. J Clin Invest. 1996;97:1454–1462. doi: 10.1172/JCI118567. [DOI] [PMC free article] [PubMed] [Google Scholar]
- 7.Hosoda K, et al. Targeted and natural (piebald-lethal) mutations of endothelin-B receptor gene produce megacolon associated with spotted coat color in mice. Cell. 1994;79:1267–1276. doi: 10.1016/0092-8674(94)90017-5. [DOI] [PubMed] [Google Scholar]
- 8.Gariepy CE, Williams SC, Richardson JA, Hammer RE, Yanagisawa M. Transgenic expression of the endothelin-B receptor prevents congenital intestinal aganglionosis in a rat model of Hirschprung disease. J Clin Invest. 1998;102:1092–1101. doi: 10.1172/JCI3702. [DOI] [PMC free article] [PubMed] [Google Scholar]
- 9.Kumar AM, Spitzer A, Gupta RK. 23Na NMR spectroscopy of proximal tubule suspensions. Kidney Int. 1986;29:747–751. doi: 10.1038/ki.1986.61. [DOI] [PubMed] [Google Scholar]
- 10.Alpern RJ. Mechanism of basolateral membrane H/OH/HCO3 transport in the rat proximal convoluted tubule. J Gen Physiol. 1985;86:613–636. doi: 10.1085/jgp.86.5.613. [DOI] [PMC free article] [PubMed] [Google Scholar]
- 11.Levi M, McDonald LA, Preisig PA, Alpern RJ. Chronic K depletion stimulates rat renal brush-border membrane Na-citrate cotransporter. Am J Physiol. 1991;261:F767–F773. doi: 10.1152/ajprenal.1991.261.5.F767. [DOI] [PubMed] [Google Scholar]
- 12.Ross R, Kleinz R, Reske-Kunz AB. A method for rapid generation of competitive standard molecules for RT-PCR avoiding the problem of competitor/probe cross-reactions. PCR Methods Appl. 1995;4:371–375. doi: 10.1101/gr.4.6.371. [DOI] [PubMed] [Google Scholar]
- 13.Laghmani K, et al. Chronic metabolic acidosis enhances NHE-3 protein abundance and transport activity in the rat thick ascending limb by increasing NHE-3 mRNA. J Clin Invest. 1997;99:24–30. doi: 10.1172/JCI119128. [DOI] [PMC free article] [PubMed] [Google Scholar]
- 14.Chen M, et al. Endothelin-1 mRNA in glomerular and epithelial cells of kidney. Am J Physiol. 1993;265:F542–F550. doi: 10.1152/ajprenal.1993.265.4.F542. [DOI] [PubMed] [Google Scholar]
- 15.Ambühl PM, et al. Glucocorticoids enhance acid activation of Na+/H+ exchanger 3 (NHE3) J Clin Invest. 1999;103:429–435. doi: 10.1172/JCI2913. [DOI] [PMC free article] [PubMed] [Google Scholar]
- 16.Kelly MP, Quinn PA, Davies JE, Ng LL. Activity and expression of Na+-H+ exchanger isoforms 1 and 3 in kidney proximal tubules of hypertensive rats. Circ Res. 1997;80:853–860. doi: 10.1161/01.res.80.6.853. [DOI] [PubMed] [Google Scholar]
- 17.Peng Y, et al. ETB receptor activation leads to activation and phosphorylation of NHE3. Am J Physiol. 1999;276:C938–C945. doi: 10.1152/ajpcell.1999.276.4.C938. [DOI] [PubMed] [Google Scholar]
- 18.Garcia NH, Garvin JL. Endothelin’s biphasic effect on fluid absorption in the proximal straight tubule and its inhibitory cascade. J Clin Invest. 1994;93:2572–2577. doi: 10.1172/JCI117268. [DOI] [PMC free article] [PubMed] [Google Scholar]
- 19.Peng Y, et al. ETB receptor activation causes exocytic insertion of NHE3 in OKP cells. Am J Physiol. 2001;280:F34–F42. doi: 10.1152/ajprenal.2001.280.1.F34. [DOI] [PubMed] [Google Scholar]
- 20.Wesson DE. Endogenous endothelins mediate increased distal tubule acidification induced by dietary acid in rats. J Clin Invest. 1997;99:2203–2211. doi: 10.1172/JCI119393. [DOI] [PMC free article] [PubMed] [Google Scholar]
- 21.Horie S, et al. Role of protein kinase C and transcription factor AP-1 in the acid-induced increase in Na/H antiporter activity. Proc Natl Acad Sci USA. 1992;89:5236–5240. doi: 10.1073/pnas.89.12.5236. [DOI] [PMC free article] [PubMed] [Google Scholar]
- 22.Yamaji Y, Moe OW, Miller RT, Alpern RJ. Acid activation of immediate early genes in renal epithelial cells. J Clin Invest. 1994;94:1297–1303. doi: 10.1172/JCI117448. [DOI] [PMC free article] [PubMed] [Google Scholar]
- 23.Yang X, Laghmani K, Preisig PA, Yanagisawa M, Alpern RJ. Regulation of Na/H antiporter 3 (NHE3) activity by acid in OKP cells: role of the endothelin-B (ETB) receptor. J Am Soc Nephrol. 2000;11:12A. (Abstr.) [Google Scholar]
- 24.Mercier O, Bichara M, Paillard M, Prigent A. Effects of parathyroid hormone and urinary phosphate on collecting duct hydrogen secretion. Am J Physiol. 1986;251:F802–F809. doi: 10.1152/ajprenal.1986.251.5.F802. [DOI] [PubMed] [Google Scholar]
- 25.Schultheis PJ, et al. Renal and intestinal absorptive defects in mice lacking the NHE3 Na+/H+ exchanger. Nat Gen. 1998;19:282–285. doi: 10.1038/969. [DOI] [PubMed] [Google Scholar]
- 26.Alpern RJ, Sakhaee K. The clinical spectrum of chronic metabolic acidosis: homeostatic mechanisms produce significant morbidity. Am J Kidney Dis. 1997;29:291–302. doi: 10.1016/s0272-6386(97)90045-7. [DOI] [PubMed] [Google Scholar]
- 27.Licht C, Laghmani K, Preisig PA, Yanagisawa M, Alpern RJ. An autocrine role for endothelin-1 (ET-1) in acid regulation of the proximal tubule. J Am Soc Nephrol. 2000;11:6A . doi: 10.1111/j.1523-1755.2004.00506.x. (Abstr.) [DOI] [PubMed] [Google Scholar]
- 28.Puffenberger EG, et al. A missense mutation of the endothelin-B receptor gene in multigenic Hirschsprung’s disease. Cell. 1994;79:1257–1266. doi: 10.1016/0092-8674(94)90016-7. [DOI] [PubMed] [Google Scholar]
- 29.Ohuchi T, et al. Elevation of blood pressure by genetic and pharmacological disruption of the ETB receptor in mice. Am J Physiol. 1999;276:R1071–R1077. doi: 10.1152/ajpregu.1999.276.4.R1071. [DOI] [PubMed] [Google Scholar]


