

Abstract
The mouse submandibular gland (SMG) epithelium undergoes extensive morphogenetic branching during embryonic development as the first step in the establishment of its glandular structure. However, the specific signaling pathways required for SMG branching morphogenesis are not well understood. Using E13 mouse SMG organ cultures, we showed that inhibitors of phosphatidylinositol 3-kinase (PI 3-kinase), wortmannin and LY294002, substantially inhibited branching morphogenesis in SMG. Branching morphogenesis of epithelial rudiments denuded of mesenchyme was inhibited similarly, indicating that PI 3-kinase inhibitors act directly on the epithelium. Immunostaining and Western analysis demonstrated that the p85 isoform of PI 3-kinase is expressed in epithelium at levels higher than in the mesenchyme. A target of PI 3-kinase, Akt/protein kinase B (PKB), showed decreased phosphorylation at Ser473 by Western analysis in the presence of PI 3-kinase inhibitors. The major lipid product of PI 3-kinase, phosphatidylinositol 3,4,5-trisphosphate (PIP3), was added exogenously to SMG via a membrane-transporting carrier in the presence of PI 3-kinase inhibitors and was found to stimulate cleft formation, the first step of branching morphogenesis. Together, these data indicate that PI 3-kinase plays a role in the regulation of epithelial branching morphogenesis in mouse SMG acting through a PIP3 pathway.
Keywords: Branching morphogenesis; Salivary gland; Submandibular gland; Organ culture; Phosphatidylinositol 3-kinase; Phosphatidylinositol 3,4,5-trisphosphate; Akt; Inhibitors; Mouse; Time-lapse microscopy
Introduction
The submandibular gland is a classical model for the study of branching morphogenesis (Bernfield and Wessells, 1970; Grobstein and Cohen, 1965; Spooner and Wessells, 1972). During development, the submandibular gland initiates as a protrusion of the oral epithelium into the surrounding mesenchyme. The first step of branching morphogenesis is cleft formation, in which visible clefts, or indentations, form in the surface of the single bud. It is not known whether there is a signal to specify the location of the cleft, although there is some evidence that a stabilization event is required (Hieda and Nakanishi, 1997; Miyazaki, 1990). The clefts then deepen, to separate the single bud into multiple buds, until there is presumably a termination signal. This sequence of events then repeats and is known collectively as the process of branching morphogenesis. Although proliferation is ultimately required for gland growth, and later morphogenesis, early branching is not dependent on cell proliferation (Nakanishi et al., 1987; Spooner et al., 1989). Branching is instead dependent on multiple processes, such as cell– cell interactions, cell–matrix interactions, matrix degradation, and cell-shape changes (Hieda and Nakanishi, 1997).
Growth factors provide a driving force for many cellular processes. The two major growth factor families that have been implicated in the control of branching morphogenesis are the epidermal growth factor (EGF) (Kashimata and Gresik, 1997; Morita and Nogawa, 1999; Partanen and Thesleff, 1987) and the fibroblast growth factor (FGF) families (Hoffman et al., 2002). The involvement of EGFR1 in branching morphogenesis was confirmed by the observation that the EGFR1 null mouse showed reduced branching within the salivary gland epithelium (Jaskoll and Melnick, 1999). Using an inhibitor approach to study EGF signaling in the salivary gland, it was shown that inhibition of Erk1/2 (p44/p42 MAPK) signaling partially inhibits EGF-stimulated branching morphogenesis (Kashimata et al., 2000), suggesting that this signaling pathway participates in branching morphogenesis. The FGF family has also been implicated in early mouse submandibular gland development. The FGFR2IIIb-null mouse lacks salivary glands, as they undergo agenesis prior to initiation of branching morphogenesis (De Moerlooze et al., 2000; Sekine et al., 1999), and the FGF10-null mouse displays a similar phenotype (Ohuchi et al., 2000; Sekine et al., 1999). FGFR1 inhibitor SU5402 limits SMG branching morphogenesis in organ culture (Hoffman et al., 2002). The integrin family of extracellular matrix adhesion molecules plays a role in branching morphogenesis as well. In organ culture, anti-integrin α6 antibodies inhibit branching morphogenesis (Kadoya and Yamashina, 1993; Kadoya et al., 1995), and EGF can regulate integrin α6 expression in SMG (Kashimata and Gresik, 1997), which implicates integrin α6 pathways in EGF-stimulated branching morphogenesis. However, with the exception of Erk1/2, none of the intracellular signaling molecules necessary for branching morphogenesis have been identified.
Organ culture systems present a valuable intermediate between cell culture and in vivo studies that facilitates the study of developmental processes requiring tissue organization. To identify molecules involved in signaling during SMG branching morphogenesis, we utilized a chemical inhibitor screening approach in an organ culture system. While the gene profiling technique of array analysis has recently been applied to developing salivary glands, very few intracellular signaling molecules have been identified with this approach (Hoffman et al., 2002; Melnick et al., 2001) since genes of low abundance or high turnover are below the limits of detection. Additionally, gene profiling techniques cannot identify posttranslational events such as phosphorylation. However, using chemical inhibitors in a morphological assay, it is possible to interrupt signal transduction pathways and to ascertain whether specific molecules affect the process of branching morphogenesis.
In this study, we found that inhibitors of phosphoinositide 3-kinase (PI 3-kinase) inhibit branching morphogenesis. We also report that PI 3-kinase inhibitors act directly on the epithelium and that phosphatidylinositol 3,4,5-trisphosphate (PIP3), the downstream product of PI 3-kinase, can stimulate cleft formation. These data indicate that a PI 3-kinase pathway in which PIP3 formation is stimulated is involved in branching morphogenesis during submandibular gland development.
Materials and methods
In vitro organ culture
Timed-pregnant female mice (strain ICR) were obtained from Harlan (Indianapolis, IN), and embryos were removed at 12 dpc (embryonic day 12, or E12, which was prior to initiation of branching) or at 13 dpc (E13, after the initial round of branching). SMG at E13 in this mouse strain can be developmentally considered to be between the “late initial bud” and “pseudoglandular” stage described previously (Jaskoll et al., 2002). The epithelial SMG structures that undergo clefting have been referred to in the literature as “early terminal end buds,” “end pieces,” “lobules,” and “buds;” in this manuscript, we have referred to these structures simply as “buds.”
Mandible sections were isolated with a scalpel, and sub-mandibular glands with attached sublingual glands (hereafter referred to as SMG) were removed from these sections under a dissecting microscope (SV6, Carl Zeiss, Oberkochen, Germany). The SMG were cultured on membranes at the air/medium interface at 37°C for 1–72 h. Five or more glands were placed on Nuclepore Track-Etch Membranes (Whatman, Clifton, NJ) (13 mm, 0.1 μM) floating on 250 μL of DMFTV standard media [DMEM/F12 (1:1) (Invitrogen, Carlsbad, CA) supplemented with transferrin (1.25 μg/ml), ascorbic acid (3.75 μg/ml), penicillin (10 U/ml), and streptomycin (10 μg/ml)] in glass-bottom 50-mm microwell dishes (MatTek Corp, Ashland, MA). SMG were kept on ice until the inhibitors were added (time 0) and then were cultured at 37°C, 5% CO2 in a humid atmosphere for the indicated times. Media were generally replaced every 24 h.
For mesenchyme-free experiments, SMG were digested with 1.6 U/ml dispase (Roche, Basel, Switzerland) in Hanks’ salt solution (Invitrogen) at 37°C for 20 min and neutralized with DMEM/F12 + 5% BSA, and mesenchyme was removed from epithelium using tungsten needles (Takahashi and Nogawa, 1991). Epithelial rudiments were cultured on filters in 20 μl of 12 mg/ml Matrigel (BD Biosciences, San Jose, CA) (Royce et al., 1993) in the presence of 20 ng/ml EGF and 200 ng/ml FGF7, as described previously (Morita and Nogawa, 1999). In the absence of exogenous growth factors, the epithelial rudiments do not grow or branch (data not shown). Mesenchyme-free experiments included a minimum of three SMG per condition and were repeated at least three times.
Branching morphogenesis assays
Signal transduction inhibitors (Calbiochem, San Diego, CA, or Sigma-Aldrich, St. Louis, MO) were resuspended in DMSO, 50% ethanol, or DMEM-F12 media, depending on their solubility, and included in regular culture media at the concentrations indicated. For each experiment, at least five E13 SMG were used for each treatment, and at least three concentrations of each inhibitor were tested. Inhibitors were assayed at concentrations near their published IC50 values at subtoxic levels. Toxicity was recognized as an apparent darkening of the epithelial cells when imaged by brightfield microscopy and was defined operationally as a state at which the SMG would not resume proliferation after 24 h if the inhibitor-containing media were replaced with fresh media. The following compounds were found to be toxic in this system at these levels: herbimycin A, 1 μM; genistein, 250 μM; lavendustin, 500 μM; okadaic acid, 1 μM; and apigenin, 50 μM. Control media contained vehicle at the same concentration as was included with the inhibitor. DMSO concentrations did not exceed 0.2% v/v for any treatment and did not affect submandibular gland growth or morphology at this concentration. Inhibitor-containing media were replaced in all experiments at 24 h. Inhibitors were stored as recommended by the manufacturer and, when necessary, reconstituted immediately prior to the experiment.
Photographs were taken at 2, 22, and 44 h with a digital SLR camera (Fuji FinePix, Fuji, Tokyo, Japan) fitted on an Axiovert 25 microscope (Carl Zeiss), unless otherwise indicated. Initial photographs were taken 2 h after placing the cultures in the incubator; at this time, SMG have spread on the filter but have not yet started branching. The total number of buds per salivary gland were counted manually using a blinded procedure with predefined criteria, and the data were tabulated automatically by MetaMorph (Universal Imaging, Downingtown, PA; V4.6). Data were imported into GraphPad Prism software (V3.0a, San Diego, CA) for graphing and statistical analysis. For each treatment, the growth at each time point was assessed by dividing the number of buds by the starting number for each SMG individually, averaging these values, and expressing the results as fold change buds/gland in arbitrary units (AU). For the inhibitor screen and experiments in which multiple treatments were compared, average values for each treatment were normalized to control and expressed as a percentage of control. Results of the inhibitor screen are expressed as percent of control in AU from a representative experiment using five glands per treatment; each experiment was repeated at least once. The results reported in Table 1 were measured at the lowest concentration that produced maximum inhibition and did not result in toxicity after 24 h.
Table 1.
Effects of cell signaling modulators on salivary gland branching morphogenesis (E13)
| Inhibitor | Potential targets | Concentration (μM) |
Buds/gland % of control ± SEM
|
||
|---|---|---|---|---|---|
| Range | Optimala | 22 h | 44 h | ||
| Receptor tyrosine kinases | |||||
| Herbimycin A | Protein tyrosine kinases | 0.1–1 | 0.5 | 64 ± 9* | NDb |
| Genistein | Protein tyrosine kinases | 0.25–250 | 2.5 | 52 ± 14c | 9 ± 7c |
| Lavendustin | Protein kinases | 10–50 | 50 | 82 ± 13 | 61 ± 4* |
| ST638 | Tyrosine kinases, HGFR, phospholipase D | 50–100 | 100 | 94 ± 10 | ND |
| AG1433 | PDGFRβ, KDR/Flk-1 | 50 | 50 | 66 ± 7 | ND |
| Phosphatases | |||||
| Okadaic acid | Protein phosphatases PP2A, PP1, PP2B | 0.050–0.100 | 0.1 | 56 ± 25 | 62 ± 15 |
| Calyculin A | Phosphatases PP2A, PP1 | 0.001–20 | 0.1 | 78 ± 20 | 56 ± 9† |
| Vanadate | Tyrosine-phosphatases, Na+/K+ ATPase, acid and alkaline phosphatases | 0.4–200 | 40 | 79 ± 5 | 40 ± 6* |
| Cytoplasmic kinases/other | |||||
| KN-62 | Calmodulin-dependent protein kinase 2 | 1–20 | 10 | 113 ± 18 | 102 ± 14 |
| KN-93 | Calmodulin-dependent protein kinase 2 | 0.5–1 | 1 | 98 ± 22 | ND |
| SKF86002 | p38, cycloxygenase, 5-lipoxygenase | 1–20 | 20 | 110 ± 12 | 134 ± 22 |
| ZM336372 | cRaf, p38α, p38β2 | 0.02–2 | 2 | 101 ± 22 | 132 ± 25 |
| Apigenin | CK2, MAPK, PKC, FGFR | 25–50 | 40 | 79 ± 9 | 64 ± 15* |
| Rapamycin | p70S6K, mTOR | 0.0001–10 | 5 | 104 ± 7 | 111 ± 8 |
| Staurosporin | PKC, MLCK, PKA, PKG, CaMK | 0.001–0.020 | 20 | 87 ± 12d | 96 ± 9d |
| Lysophosphatidic acid | Activates PKC, adenyl cyclase, G proteins, tyrosine kinases, MAPK | 5–50 | 50 | 92 ± 20 | 113 ± 12 |
| LY294002 | PI 3-kinase | 0.5–50 | 25 | 22 ± 4* | 13 ± 3* |
| Wortmannin | PI 3-kinase | 0.001–0.100 | 0.01 | 56 ± 16† | 50 ± 14* |
Note. The number of lobules/rudiment for each treatment was counted at 22 and 44 h and normalized to control. Values are derived from a representative experiment, n = 5.
Concentration used to obtain data reported for 22 and 44 h, see Materials and methods.
Not done.
Quantitated using E12 SMG.
Reduced bud size.
P ≤ 0.05;
P ≤ 0.1 by unpaired, two-tailed t test assuming equal variance.
Statistical analysis was performed as indicated in the figures and text. For the inhibitor screen, the significance of the difference between the treatment reported and the control was determined by unpaired, two-tailed t test, assuming equal variance within each experiment, although the variance was different between experiments. One-way analysis of variance (ANOVA), was performed to determine the statistical difference between the means of each treatment for experiments in which multiple treatments were compared. The conservative Bonferroni’s Multiple Comparison Post-Test was combined with the ANOVA in order to compare differences between the means within an experiment.
For branching morphogenesis assays in which two inhibitors were combined, both were added at their approximate IC50 values for this organ culture system. The IC50 for each inhibitor was estimated from a previous independent dose-response experiment. Combination experiments were repeated at least three times, although data shown are from one representative experiment.
Time-lapse microscopy
SMG were precultured in microwell dishes on Nuclepore filters for 2 h in the presence of 20 μM LY or control media. For time-lapse microscopy, E13 SMG were incubated at 37°C with 5% CO2 and humidified air in an environmental chamber fitted on a Nikon Diaphot inverted microscope and imaged with a cooled CCD camera (Photometrics CH320; Roper Scientific, Trenton, NJ) or on an Axiovert 100 inverted microscope (Carl Zeiss) fitted with a cooled CCD camera (MicroMAX: 1300Y; Princeton Instruments, Mon-mouth Junction, NJ). Images were acquired using brightfield optics through a 5× objective once every 10 min for 20 h using MetaMorph Software. Images were adjusted for brightness, contrast, and alignment, as necessary, and were assembled into movies using MetaMorph.
Cleft formation assays
For cleft formation assays, PtdIns(3,4,5)P3 diC16 (PIP3) was added to E13 SMG cultures via the Shuttle PIP system (Echelon Research Laboratories, Salt Lake City, UT). PIP3 was mixed with carrier 1 (C1, neomycin sulfate) at a concentration of 50 μM for each, and complexes were allowed to form for 10 min at room temperature (RT). The PIP3-C1 complex was added to prewarmed SMG DMFTV media and then added to cultures. Uptake of PIP3 by the SMG during culture was initially confirmed by using a fluorescent confocal microscope (LSM510, Zeiss) to observe NBD-labeled PIP3 (PIP3-C6NBD, C16) in both the epithelium and mesenchyme of whole-mount SMG fixed with 3% paraformaldehyde in 1 × PBS for 15 min at RT, 10 min after addition of labeled PIP3 to the culture media. Cleft-forming assays were performed using unlabeled PIP3. For cleft formation assays, SMG were harvested as described, except that 5–12 SMG were set up on filters in ordered pairs such that pairs from the same embryo were compared ± PIP3. Additionally, they were maintained at RT until addition of PIP3-C1 or C1, after which they were cultured under normal conditions. PIP3-C1 or C1 was added once per hour by replacing the entire growth media. SMG were digitally photographed at 2 and 8 h. The numbers of clefts present at the surface of the epithelium were counted from digital images, tabulated in MetaMorph, and graphed using Prism software, as described for branching morphogenesis assays. Statistical analysis of PIP3 experiments was performed using paired, two-tailed t tests. Cleft formation assays were repeated three or more times with data shown from a representative experiment.
Immunofluorescence
E13 SMG were grown in organ culture for 24 h and fixed overnight at 4°C in 4% paraformaldehyde, 5% sucrose in 1× PBS. Fixed SMG were permeabilized and blocked in 1× PBS, 0.1% Triton X-100, 20% donkey serum, and Mouse on Mouse (M.O.M.) blocking reagent (Vector Laboratories, Burlingame, CA), as recommended by the manufacturer. SMG were incubated in primary antibody in diluent (1× PBS, 0.01% Triton X-100, containing 7% protein concentrate) (M.O.M. kit; Vector Laboratories) overnight at 4°C, and then with secondary antibody for 1 h at RT in diluent. SMG were washed 3 × 10 min in 1 × PBS containing 0.05% Tween 20 after each antibody incubation. Immunostaining was repeated at least three times.
Antibody concentrations and sources were as follows: PI 3-kinase, p85 1:100 (06-497; UBI, Watham, MA); rhodamine phalloidin, 1:350 (Molecular Probes, Eugene, OR); and anti-heparan sulfate proteoglycan (perlecan), 1:100 (MAB1948; Chemicon, Temecula, CA). Secondary antibodies for indirect immunofluorescence were cyanine dye-conjugated AffiniPure F(ab′)2 fragment donkey anti-mouse or -rabbit IgG (H + L), showing minimal cross-reactivity with serum proteins from multiple species (Jackson ImmunoResearch Laboratories, West Grove, PA).
Western analysis
SMG were grown in culture in the presence of inhibitors or vehicle control for the time periods indicated. For preparation of epithelial- or mesenchyme-enriched extracts, the cell types were enzymatically and physically separated as described in Materials and methods under “In vitro organ culture.” Whole E13 SMG, epithelium, or mesenchyme were placed in a microfuge tube and were either immediately frozen in a dry ice/methanol bath and stored at −80°C or solubilized in complete RIPA buffer (150 mM NaCl, 50 mM Tris-HCl, pH 7.5, 1% Triton X-100, 1% sodium de-oxycholate, 0.1% SDS, 1 mM sodium vanadate, 1 mM sodium fluoride, 1 mM phenylmethylsulfonyl fluoride, 1 mM EDTA, containing one complete mini protease inhibitor tablet (Roche) per 10 ml buffer). SMG in RIPA buffer were sonicated on ice at an amplitude of 40 for 10 s by using a probe sonicator, and the insoluble fraction was removed by centrifugation at 14,000× g at 4°C for 20 min. Protein concentrations were assayed using the Micro BCA protein assay (Pierce, Rockford, IL), and 5 or 10 μg of protein were loaded per lane on a 1.5-mm 4–12% SDS-PAGE gel (Invitrogen). Proteins were transferred to nitrocellulose and stained with Ponceau to confirm transfer efficiency. Membranes were blocked for 1 h in 5% nonfat milk in 1× TBS-T (Tris-buffered saline, 0.1% Tween 20) and incubated with primary antibody overnight at 4°C with 1% milk in 1× TBS-T, and secondary antibody for 1 h at RT in 1% milk, 1× TBS-T. Blots were washed after each antibody incubation in 1× TBS-T three times for 10 min. Blots were developed using a chemiluminescent development solution (Super Signal West Dura; Pierce) and analyzed with a Fuji LAS-100 chemiluminescent imager using exposure times at subsaturation levels. Blots were quantitated by using Image Gauge (V3.3) (Fuji) in profile mode, utilizing background subtraction and integration of pixel density within each band area. Pixel density for each band was normalized to actin for each lane to control for any loading error. Graphs were compiled in Prism, and results are shown in arbitrary units (AU). Each blot was repeated two to three times and each experiment repeated two to three times. Blots shown are representative, and the graphs were generated from the blots shown.
Antibodies obtained from the sources indicated were used at the following concentrations: PI 3-kinase p85, 1:4000 (06-497; UBI); Akt, 1:2500 (9272; Cell Signaling, Beverly, MA); phospho-Akt (Ser473), 1:2500 (9271S; Cell Signaling); β-actin, 1:10,000 (clone AC-74; Sigma); E-cadherin, 1:5000 (610181; BD Transduction); and vimentin 1:5000 (clone 13.2; Sigma). The secondary antibodies used were HRP-conjugated donkey anti-rabbit or -mouse immunoglobulin (Amersham-Pharmacia, Piscataway, NJ) and were used at 1:10,000.
Results
PI 3-kinase inhibitors affect salivary gland branching morphogenesis
In order to identify candidate signal transduction pathways required for branching morphogenesis during SMG development, we utilized an inhibitor screening strategy. We harvested submandibular glands from mouse embryos after a single round of branching (E13) and grew them in organ culture. To the culture media, we added signal transduction inhibitors and monitored gland branching in the presence of the inhibitors in comparison with control SMG. At 22 and 44 h, we photographed each SMG and then counted the number of buds per gland, as described in Materials and methods. The results of this initial inhibitor screen are summarized in Table 1.
We found that a number of inhibitors did not affect branching morphogenesis, while a few inhibited branching in a statistically significant manner. Not surprisingly, global inhibitors of receptor tyrosine kinases, including herbimycin, genistein, and lavendustin, significantly inhibited branching morphogenesis, yet these inhibitors do not identify a specific pathway. The phosphatase inhibitors, which might be expected to oppose kinase action, actually inhibited branching morphogenesis over a range of concentrations. Of the cytoplasmic kinase inhibitors tested, few showed significant effects. However, apigenin, an inhibitor of multiple kinases, showed a moderate inhibition of branching morphogenesis at high concentrations. Several inhibitors examined in this study showed minor effects on branching morphogenesis, yet these effects were not statistically significant.
In contrast, inhibitors of phosphatidylinositol 3-kinase (PI 3-kinase) had major effects on branching morphogenesis (Table 1); consequently, we focused on testing the role of the PI 3-kinase pathway. Fig. 1A shows time-lapse microscopy (see Movie 1 at http://wwwdir.nidcr.nih.gov/dirweb/cdbrb/DMD/larsen/DB/movies.asp) of a control SMG and a SMG treated with the PI 3-kinase inhibitor LY294002 (LY) at 20 μM. While the control gland undergoes multiple rounds of branching during the 20-h time period, the LY-treated gland undergoes only one round of branching. In the LY-treated SMG, the buds enlarge more than in control-treated glands prior to the initiation of clefting, and the process of cleft formation itself is slower, indicating that LY inhibits cleft formation—the initial step in SMG branching morphogenesis. The inhibition of branching morphogenesis by LY is generally consistent with a recent report in which LY was found to limit branching morphogenesis in the ureteric bud epithelium (Tang et al., 2002). However, in the kidney, PI 3-kinase is implicated in inhibiting ureteric bud outgrowth, rather than in cleft formation, which does not occur during ureteric branching.
Fig. 1.
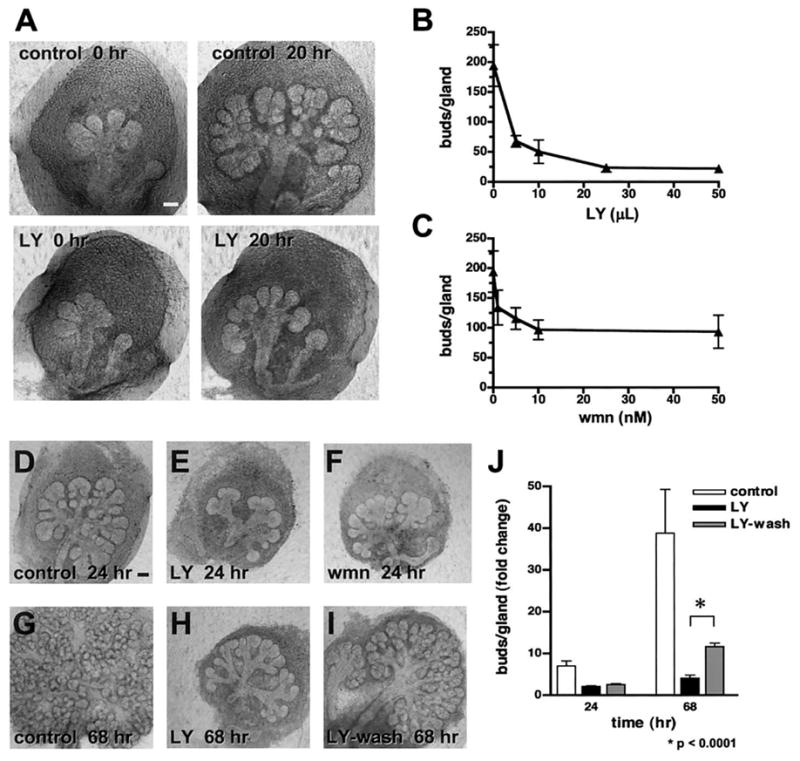
Inhibitors of PI 3-kinase inhibit salivary gland branching morphogenesis in organ culture. (A) E13 SMG were treated with 20 μM LY294002 or control media and observed with time-lapse microscopy for 20 h. Shown are the first and last images of control- and LY-treated SMG (see http://wwwdir.nidcr.nih.gov/dirweb/cdbrb/DMD/larsen/DB/movies.asp for Movie 1). There is a significant inhibition of SMG branching in the presence of 20 μM LY294002 relative to control glands at 20 h. (B, C) The PI 3-kinase inhibitors LY and wortmannin (wmn) were added to SMG organ cultures at increasing concentrations. Dose-response of LY (B) and wmn (C) in E13 SMG cultures show the number of buds per gland on the y-axis. Effects of LY on SMG branching can be reversed upon removal of inhibitor from the growth media. Shown are SMG at 24 h: control (D), 10 μM LY (E), and 50 nM wmn (F). After 68 h, the control glands (G) have continued branching, and SMG treated with LY (H) remain inhibited. (I) SMG treated with LY for 24 h and then switched to control media (LY-wash) have resumed branching. (J) Quantitation of inhibition with 10 μM LY at 24 h and recovery of SMG after removal of LY from the media, graphed as buds/gland, normalized to the number of buds per gland at 2 h, and expressed in arbitrary units (AU) vs time. Differences between all samples (except LY and LY-wash at 24 h) were significant by one-way ANOVA at P < 0.05, and the difference between LY and LY-wash at 68 h was significant at P < 0.0001 by unpaired, two-tailed t test, assuming equal variance. Scale bars, 100 μm.
The effects and specificity of the PI 3-kinase inhibitors were analyzed quantitatively by comparing the effects of two structurally distinct PI 3-kinase inhibitors: LY, which acts on the ATP-binding site, and wortmannin (wmn), a fungal metabolite that covalently binds PI 3-kinase and irreversibly blocks catalytic activity. Both LY (Fig. 1B) and wmn (Fig. 1C) effectively inhibited branching morphogenesis in E13 glands in a dose-dependent manner. We found that the IC50 values for LY and wmn in E13 SMG were approximately 4 μM and 4 nM, respectively, whereas the reported IC50 of LY is 1.4 μM and of wmn in purified cytosolic preparations is 5 nM. Therefore, the dose-dependent effectiveness of the PI 3-kinase inhibitors in SMG organ cultures was comparable to reported values.
In order to confirm that the inhibition by LY was non-toxic and reversible, we treated the glands with the inhibitor for 24 h, washed out the inhibitor at 24 h, and then examined the glands at 68 h (Fig. 1D–I). The effects of LY were fully reversible. Statistical significance of inhibition by LY was calculated for the washout experiment (Fig. 1D–I) and was found to be significant at P < 0.05 for 24 and 68 h by one-way ANOVA, as indicated in Fig. 1J. The difference between treatment with LY and the washout of LY was significant at P < 0.0001 by t test at 44 h after the removal of the inhibitor. Together, these data indicate that PI 3-kinase inhibitors substantially inhibit SMG branching morphogenesis, thereby indicating that PI 3-kinase is involved in salivary gland branching morphogenesis.
Inhibitors inhibit cleft formation and branching in the absence of mesenchyme
Since epithelial–mesenchymal interactions are implicated in SMG branching morphogenesis (Gilbert, 2000), we asked whether the PI 3-kinase inhibitors acted directly on the epithelium. We enzymatically and physically removed the mesenchyme from E13 epithelial rudiments and cultured the isolated epithelia in Matrigel (Royce et al., 1993), a basement membrane extract, in the presence of EGF and FGF7, which were previously shown to support growth and branching of submandibular gland rudiments in the absence of mesenchyme (Morita and Nogawa, 1999). Without mesenchyme, both LY294002 and wortmannin inhibited cleft formation and branching of submandibular epithelial rudiments (Fig. 2C and D, respectively) relative to the control (Fig. 2B) at 48 h. These data indicate that PI 3-kinase inhibitors act directly on the epithelium and that PI 3-kinase signaling in the mesenchyme may not be required for SMG branching morphogenesis.
Fig. 2.

PI 3-kinase inhibitors inhibit branching morphogenesis in SMG cultures denuded of mesenchyme. (A) E13 SMG were isolated, and mesenchyme was enzymatically and physically removed. (B) SMG lacking mesenchyme cultured in Matrigel for 48 h with media containing 20 ng/ml EGF and 200 ng/ml FGF7 undergo branching morphogenesis. (C, D) SMG epithelial rudiments grown in Matrigel with media containing EGF and FGF7 in the presence of PI 3-kinase inhibitors for 48 h show reduced branching: 20 μM LY (C), and 50 nM wmn (D), suggesting that PI 3-kinase inhibitors act directly on the epithelium. Scale bar, 100 μm.
PI 3-kinase is localized in embryonic salivary gland epithelium
The canonical class I PI 3-kinase is composed of a regulatory subunit and a catalytic p110 subunit, with the regulatory subunit necessary for targeting the catalytic subunit to the membrane via receptor tyrosine kinases and/or adapter molecules. The molecular targets of both LY and wmn include both class I and class II PI 3-kinases. While the IC50 values for the class I molecules are approximately 1 nM for wmn and 1 μm for LY, for the class II molecules, they are 50– 450 nM and 19 μM for wmn and LY, respectively (Fruman et al., 1998), indicating that, in this series of experiments, we are affecting primarily the class I PI 3-kinases. The regulatory subunit of the class I PI 3-kinases exists as two p85 isoforms, α and β, which are relatively similar, as well as a p55 isoform and two splice variants of the p85α. To confirm that PI 3-kinase is expressed in embryonic mouse salivary gland, we performed Western immunoblot analysis of total cell extracts from both E13 and E12 rudiments using an antibody recognizing both p85 isoforms as well as splice variants of the PI 3-kinase regulatory subunit. We detected a band of 85 kDa in both cell extracts (Fig. 3A), indicating PI 3-kinase is present at both prebranching and branching stages. To identify the tissue localization of PI 3-kinase, we performed immunostaining on whole-mount E13 rudiments and examined the expression pattern of the p85 subunit of PI 3-kinase by confocal microscopy. We compared the staining pattern of PI 3-kinase (Fig. 3B) with that of an anti-perlecan antibody (Fig. 3C) that recognizes the basement membrane so that we could distinguish between epithelium and mesenchyme. We also examined the staining pattern of phalloidin, which binds actin (Fig. 3D), as a control for tissue penetration. We detected PI 3-kinase in both the epithelium and mesenchyme, but levels were higher in the epithelium. The localization pattern was virtually identical to that obtained using a monoclonal PI 3-kinase p85 antibody (clone 4; BD Biosciences-Transduction) (data not shown).
Fig. 3.

PI 3-kinase is expressed in embryonic SMG. (A) Extracts from E12 and E13 SMG were probed with an antibody recognizing the p85 isoform of PI 3-kinase, and a band of apparent molecular weight 85 kDa was observed in both extracts. E13 SMG were fixed, immunostained, and examined by confocal microscopy. Shown is a single section of a single bud labeled with: (B) anti-p85 antibody, (C) the basement membrane marker perlecan, and (D) rhodamine-phalloidin that binds actin filaments and demonstrates effective penetration of labeled molecules. (E) Merge of three channels. PI 3-kinase was primarily localized in the epithelium (e) with some localization in the mesenchyme (m). Scale bar, 20 μm.
To confirm the preferential epithelial localization of PI 3-kinase, we physically separated the mesenchyme from the epithelium of E13 SMG, made cell extracts from each preparation, and compared the amounts of PI 3-kinase detectable in the epithelium-and mesenchyme-enriched extracts by Western blot analysis (Fig. 4A). The epithelial marker E-cadherin and the mesenchymal marker vimentin confirmed the effectiveness of the cell separation technique. Western analysis of the epithelial and mesenchymal cells confirmed the preferential expression of the p85 subunit in the epithelium (Fig. 4A). RT-PCR using cDNA prepared from RNA from the epithelial and mesenchymal compartments likewise indicated that PI 3-kinase mRNA is expressed 2.5-fold higher in the epithelium than in the mesenchyme (data not shown).
Fig. 4.

Western analysis of PI 3-kinase and downstream target Akt in E13 SMG. (A) Epithelium (E)- and mesenchyme (M)-enriched cell extracts were generated and analyzed by Western analysis. The epithelial marker E-cadherin and the mesenchymal marker vimentin were used to confirm the effectiveness of the separation. In agreement with immunolocalization, PI 3-kinase was expressed primarily in the epithelium, while Akt was in both cellular compartments. (B) Quantitation of the Western analysis in (A), graphed as the relative pixel density of each band relative to the actin control for each lane. (C) Whole SMG were treated with LY (25 μM) or wmn (50 nM) for 1.5, 3, 7, or 25 h. Extracts were analyzed by Western analysis with anti-pAkt (Ser473), Akt, and actin antibodies on blots that were stripped and reprobed. (D) Quantitation of the Western blot in (C), graphed as the relative pixel density of each band relative to the actin controls for each lane and normalized to control at each time point, indicates that the level of phosphorylation of Akt at Ser473 correlates with increasing time of incubation with LY. Treatment with wmn shows a similar effect at 25 h and at 1.5–7 h (data not shown).
Akt is expressed in both epithelium and mesenchyme, and dephosphorylation of Akt at Ser473 is detected in the presence of LY294002
Since a major indirect target of PI 3-kinase in most cell types is the Ser/Thr kinase Akt/PKB (protein kinase B), we examined expression of Akt by Western analysis on the epithelial- and mesenchymal-enriched extracts (Fig. 4A) and quantitated these results (Fig. 4B). Akt was detectable in both epithelium and mesenchyme at equivalent levels. To confirm the expression pattern of Akt, we immunostained whole-mount developing salivary glands and examined them by confocal microscopy. In confirmation of the Western analysis, we found Akt expression detectable in both epithelium and mesenchyme (data not shown).
Regulation of the activity is complex and involves translocation to Akt membrane, which can be induced by PIP3 (Stephens et al., 1998), which is followed by phosphorylation at Thr308 and Ser473. Phosphorylation at Thr308 is mediated by phosphotidylinositol-dependent protein kinase 1 (PDK1) in response to PI 3-kinase activation. While the source of phosphorylation at Ser473 is not known, it is the site that must be phosphorylated for activation (For review, see Scheid and Woodgett, 2001). To determine whether PI 3-kinase inhibitors affect the phosphorylation status, and therefore the activity, of Akt, we harvested total salivary gland extracts and examined Akt phosphorylation by Western blotting. As shown in Fig. 4C, and quantitated in Fig. 4D, we found that the level of Akt phosphorylation at Ser473 was suppressed by inhibition of PI 3-kinase in a time-dependent manner. From 1.5 to 7 h, there was increasing inhibition of Akt phosphorylation (Fig. 4D). Although after 24 h in the presence of the LY294002 inhibitor, pAkt was still substantially suppressed (data not shown), the levels were further decreased following addition of new inhibitor at 24 h, as shown in Fig. 4D (total time, 25 h). Additionally, we localized the activated phosphorylated form of Akt, pAkt (Ser473), which was detectable in both the epithelium and mesenchyme, but was not detectable in SMG treated with LY for 3 h (data not shown). These findings confirm that the PI 3-kinase inhibitor effectively penetrated into the epithelium. Further, these data indicate that inactivation of Akt correlates with inhibition of PI 3-kinase during SMG development and suggest that Akt may play a role in branching morphogenesis.
PIP3 stimulates branching
To determine whether modulation of a downstream effector of PI 3-kinase affects branching morphogenesis, we used the lipid PIP3, formed as a result of a phosphorylation of PIP2 at its 3′ position by PI 3-kinase. To confirm that PIP3 was able to penetrate into the SMG, we examined the distribution of a fluorescently labeled form of PIP3 coupled to a membrane carrier. PIP3 was detected in both the epithelial and mesenchymal compartments after 10 min (data not shown). In order to determine whether the SMG could be rescued from the inhibitory effects of PI 3-kinase inhibitors by the addition of PIP3 to the system, we added nonlabeled PIP3 at 1-h intervals and examined the SMG morphology at 8 h. The short half-life of PIP3 necessitated the hourly addition of PIP3. Since we assayed for effects of PIP3 at a time point during branching and prior to completion of a cycle, we assayed cleft, rather than bud, formation. We found that, in the presence of LY294002 (20 μM), a significant decrease in cleft number was detectable relative to control (P < 0.05; Fig. 5E). In the presence of 10 μM LY, PIP3 stimulated cleft formation (Fig. 5B) relative to control (Fig. 5A), as can be seen in the higher magnification view of Fig. 5B in Fig. 5D relative to its pair in Fig. 5C. When this experiment was quantitated (Fig. 5E), it was found that PIP3-stimulated cleft formation was statistically significant relative to control in the presence of 5 μM LY. These data indicate that PIP3 may be involved in stimulation of cleft formation during branching morphogenesis.
Fig. 5.

PIP3 stimulates branching in SMG in the presence of LY inhibitor. Eight pairs of E13 glands were treated with media containing 10 μM LY + carrier C1 (A and C) or 10 μM LY + C1 + PIP3 (B and D). PIP3 stimulated cleft formation in the presence of 10 mM LY (see arrow in high magnification view in D) relative to a paired gland in (C). (E) Clefts per gland were counted and graphed relative to the number of clefts/gland at time zero and expressed in AU. Scale bar, 100 μm (A, B) and 50 μm (C, D).
PI3-kinase signaling is partially independent of known pathways
We wished to determine whether the PI 3-kinase-mediated pathway that we have identified is part of or is independent of the pathways currently known to be involved in SMG branching morphogenesis. We performed branching assays using LY in combination with other signal transduction inhibitors. When a maximal dose of LY (10 μM; Fig. 6B) was compared with a maximal dose of the Erk1/2 inhibitor PD98059 (50 μM; Fig. 6C), the inhibition of branching by LY was more significant. When maximal doses of LY and PD were combined, there was no significant increase in the inhibition provided by LY alone (Fig. 6D). When this combination experiment was quantitated and the statistical significance evaluated by one-way ANOVA (Fig. 6E), the values were found to be significantly different (P < 0.0001). The effects of LY and PD98059 were both significantly different from control and from each other (P < 0.0001), while the difference between LY and LY + PD98059 was not (P > 0.05; Fig. 6B), as determined by Bonferroni’s Multiple Comparison Post-Test. We also combined LY and PD at concentrations near their IC50 levels and found the same result (data not shown). These data show that, while the effects of LY on branching morphogenesis are larger than the effects of the Erk 1/2 inhibitor, there is not an additive effect, indicating that PI 3-kinase may be acting as part of the same pathway as Erk1/2.
Fig. 6.
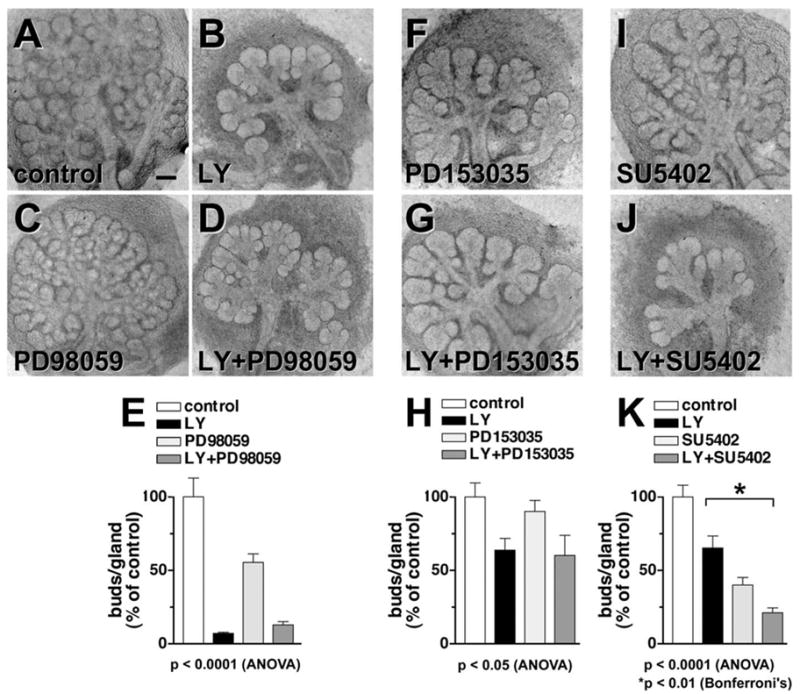
PI 3-kinase inhibitors have effects on SMG distinct from those of other signaling molecules. After 44 h, compared with control SMG (A), 10 μM LY-treated E13 SMG (B) show fewer and larger rounded buds, while 50 μM PD98059-treated SMG (C) show a reduced number of buds. The combination of 10 μM LY and 50 μM PD98059 (D) showed no significant difference from LY alone, quantitated in (E). SMG treated with an inhibitor of EGFR signaling, PD153035 at 50 pM (F), show a decrease in bud number relative to control (A). (G) With the combination of LY (5 μM) and PD15035 (50 pM), there is little difference from LY alone, which can be observed quantitatively (H). (I) SMG treated with 1.5 μM SU5402, an inhibitor of FGFR1 signaling, show elongated stalks and abnormal bud structure. (J) SMG treated with both LY (5 μM) and SU5402 (2 μM) show a composite morphology reminiscent of both inhibitors, and an additive inhibitory effect when quantitated (K). Scale bar, 100 μm.
Since Erk1/2 have been shown to act downstream of EGF signaling, we compared the effects of LY with that of an EGF receptor (EGFR) inhibitor. We added LY at its approximate IC50 value for this system (5 μ M; Fig. 6B) and compared it with a maximal dose of a specific EGFR inhibitor, PD153035 (50 pM; Fig. 6F). Again, the effect of LY was larger than the effect of the EGFR inhibitor, and when the two inhibitors were combined at these concentrations, the effects were not additive (Fig. 6G). The quantitation and statistical analysis of this experiment, shown in Fig. 6H, indicated that the means are significant by ANOVA (P < 0.05). However, there was no significant difference between LY alone and LY + PD153035. The same result was found when combining LY with larger doses of PD153035 as well as with other inhibitors of EGFR, including PD168393, PD156273, and the tyrophostin AG 1478 (data not shown). These results are consistent with the hypothesis that PI 3-kinase signaling is a component of the EGFR mediated pathway.
Because the effects of the PI 3-kinase inhibitor on SMG branching morphogenesis are larger than that of either the EGFR or the Erk inhibitor, we questioned whether PI 3-kinase could be a component of more than one signaling pathway. Recently, the FGFR inhibitor SU5402 (SU) was found to inhibit branching morphogenesis (Hoffman et al., 2002). We added SU at a concentration close to its IC50 in this system (2 μM; Fig. 6I) and found that it appeared to limit the process of branching morphogenesis but also affected the bud shape and increased the length of the ducts, as reported previously (Hoffman et al., 2002). When LY and SU5402 were combined, the contributions of both inhibitors were apparent in the resulting morphology (Fig. 6J) in that the SMG showed elongated irregular ducts typical of the SU5402 treatment and the large, smooth rounded buds typical of LY treatment. Quantitation of this experiment (Fig. 6K) again indicated significant differences between the mean values by ANOVA (P < 0.0001). However, there was an additive effect with LY and SU, and the difference between LY and LY + SU5402 was significant by Bonferroni’s Multiple Comparison Test (P < 0.01). These data indicate that PI 3-kinase does not appear to be a component of signaling via FGFR1 during SMG branching morphogenesis. However, we cannot rule out the possibility that PI 3-kinase contributes to another signaling pathway involved in branching morphogenesis in addition to its apparent contribution to EGF-mediated signaling.
Discussion
In this study, we have shown that inhibitors of PI 3-kinase negatively regulate branching morphogenesis in SMG by acting directly on the epithelium. Consistent with a role in branching, PI 3-kinase is localized primarily within the epithelium. We have rescued the effect of the PI 3-kinase inhibitors by addition of an immediate target of PI 3-kinase, PIP3. We also report that phosphorylation of Akt, another downstream effector of PI 3-kinase, decreases (at Ser473) with increasing incubation time with PI 3-kinase inhibitors and correlates with inhibition of branching morphogenesis. Together, these data indicate that PI 3-kinase is involved in branching morphogenesis and that its effects are mediated through signaling via PIP3 and possibly Akt. Since the addition of PIP3 can stimulate cleft formation, we propose a model in which PIP3-dependent signaling initiates cleft formation. Alternatively, PIP3 may not initiate cleft formation but may provide a cleft-stabilizing signal. PIP3 is generated by phosphorylation of PIP2, which also has signal transduction properties (Czech, 2000). These data suggest that the formation of PIP3, and not the reduction in PIP2 levels, is the critical event downstream of PI 3-kinase signaling during branching morphogenesis. Since little is known regarding the mechanism of cleft formation, the role of PIP3 in SMG branching morphogenesis will be the subject of future studies.
Because the specificity of the chemical inhibitors is a concern in inhibitor studies (Davies et al., 2000), we have used two chemically independent PI 3-kinase inhibitors, LY294002 (LY) and wortmannin (wmn), and observed the same effects on branching morphogenesis with both. Wmn has been reported to affect PI4Kβ (Meyers and Cantley, 1997), although not at the levels used in this study. LY has inhibitory effects on the mammalian target of rapamycin (mTOR) (Brunn et al., 1996), yet mTOR does not appear to be a target in SMG branching morphogenesis, since rapamycin itself had no effect on branching (Table 1). LY has also been reported to inhibit DNA-dependent protein kinase (Hartley et al., 1995) and casein kinase-2 (CK2) (Davies et al., 2000). While we found that apigenin, a CK2 inhibitor, did inhibit branching morphogenesis (Table 1), apigenin is not specific for CK2 and affects a dozen different kinases (Pinna, 2002). With the lack of specific CK2 inhibitors, it is currently difficult to test the role of CK2 in branching morphogenesis. Nevertheless, as a result of these studies, we can conclude that PI 3-kinase is involved in branching morphogenesis; however, we cannot exclude the possibility of a contributions from other molecules.
PI 3-kinase is a mediator of many signal transduction pathways in many systems, which include both EGF- and FGF-stimulated signaling (Carballada et al., 2001; Okano et al., 2000; Toker, 2000). In agreement with previous data in which inhibitors of EGFR moderately inhibit branching morphogenesis (Kashimata and Gresik, 1997; Kashimata et al., 2000), we have shown that the highly specific EGFR inhibitor (reported IC50 of 25 pM) inhibits branching morphogenesis in our SMG organ cultures. Likewise, we found that PD98059 moderately inhibited branching morphogenesis (Fig. 6C) similar to previous reports (Kashimata et al., 2000). In our culture system, not dependent on externally added growth factors, the effects of the PI 3-kinase inhibitor LY were greater than the effects of the MAP kinase inhibitor PD98059 (Fig. 6E). When LY was combined with either PD98059 or PD153035, there was no additive effect in this system. However, when combined with the FGFR1 inhibitor, SU5402, there was a combinatorial effect on branching morphogenesis, suggesting that LY and SU5402 affect separate pathways. Additional evidence in support of the hypothesis that PI 3-kinase is not a component of FGF signaling comes from the results of the mesenchyme-free cultures. It was previously reported that, in mesenchyme-free cultures, EGF stimulates bud formation, while FGF7 stimulates duct elongation (Morita and Nogawa, 1999). In our mesenchyme-free cultures, LY (Fig. 2C) and wmn (Fig. 2D) appear to allow ductal extension but inhibit branching. Together, these data indicate that PI 3-kinase is a downstream effector of EGF, but not FGF, action during SMG branching morphogenesis.
While the EGFR inhibitor PD153035 is more specific (Bridges et al., 1996) than the tryophostin RG50864 (Nowak et al., 1997), which was previously used to demonstrate the significance of EGF signaling during SMG development (Kashimata and Gresik, 1997), it inhibits not only EGFR1 (ErbB1) but also the EGFR family members ErbB2, -3, and -4, indicating that one or more of these family members may be involved in SMG branching morphogenesis. In fact, EGFR1 is not a strong activator of PI 3-kinase (Yarden and Sliwkowski, 2001). Further, it has been reported that the EGF family member most effective in stimulating PI 3-kinase activation is ErbB3 (Soltoff et al., 1994). During SMG branching morphogenesis, it is not known which ErbB family member simulates PI 3-kinase.
The fact that the inhibitory effects of PI 3-kinase inhibitors appear to be greater than that of EGF pathway inhibitors indicates that PI 3-kinase may participate in an additional pathway involved in branching morphogenesis. Another stimulator of branching morphogenesis is integrin α6, as was shown by the inhibition of branching by integrin α6 inhibitory antibodies in organ culture (Kadoya et al., 1995), yet the mechanism remains unknown. We added a function-inhibiting integrin α6 antibody (GoH3) to SMG cultures and assayed for phosphorylation of Akt at Ser473 as an indicator of PI 3-kinase activity. However, we found that there was no effect on Akt phosphorylation by GoH3 (data not shown), suggesting that PI 3-kinase does not mediate integrin α6 signaling. The possibility remains that PI 3-kinase contributes to an additional, possibly unknown, pathway involved in SMG branching morphogenesis.
What additional downstream mediators of PI 3-kinase might be involved in branching morphogenesis is not known. Since loss of Akt phosphorylation correlates with addition of LY and inhibition of branching, Akt may also be involved. Consistent with this possibility is the fact that ML-9 inhibits branching morphogenesis at 35 μM (data not shown). Although ML-9 inhibits Akt phosphorylation (Hernandez et al., 2001), it is also an inhibitor of myosin-light chain kinase and protein kinase A at these levels. Rapamycin, besides inhibiting mTOR, also inhibits p70S6 kinase (p70S6K), which is a downstream mediator of some PI 3-kinase activities. However, since rapamycin did not inhibit branching morphogenesis (Table 1), p70S6K does not appear to play a role in branching morphogenesis. Additional molecules activated by PI 3-kinase signaling, including isoforms of protein kinase C (Nakanishi et al., 1993; Toker et al., 1994) and Rac (Hawkins et al., 1995), are potential targets involved in branching morphogenesis. Future studies will seek to identify specific molecules down-stream of PI 3-kinase/PIP3 in branching morphogenesis.
Proliferation, migration, cell-shape change, matrix synthesis, matrix degradation, and other changes in cell physiology are components of the process of branching morphogenesis. The processes are different in each branching organ. In contrast to the kidney, in which branching morphogenesis initiates with ureteric bud outgrowth, branching initiates with cleft formation in the SMG. It is interesting that PI 3-kinase plays a role in the initiation of branching in the kidney and SMG, despite the different mechanisms involved. In the SMG, it is clear that PI 3-kinase/PIP3 plays a role in initiation of cleft formation, although it is not clear whether other physiological mechanisms are involved, except that the effects of PI 3-kinase do not appear to depend on changes in proliferation. In the presence of PI 3-kinase inhibitors, proliferation within the epithelium is maintained, as determined by BrdU incorporation assays (data not shown). It is not known whether PI 3-kinase can affect some cell migratory processes during SMG cleft formation as it does during the active cell migration during ureteric bud outgrowth (Tang et al., 2002). In the future, it will be interesting to identify the downstream mediators of PI 3-kinase/PIP3 signaling in order to understand the detailed mechanisms of this pathway during mouse SMG branching morphogenesis.
Supplementary Material
Acknowledgments
We thank Catherine Galbraith for critical reading of this manuscript and Harry Grant for proofreading. This work was partially supported by NIH Grant DE-14322 (to M.L.).
References
- Bernfield MR, Wessells NK. Intra- and extracellular control of epithelial morphogenesis. Symp Soc Dev Biol. 1970;29:195–249. doi: 10.1016/b978-0-12-395534-0.50014-5. [DOI] [PubMed] [Google Scholar]
- Bridges AJ, Zhou H, Cody DR, Rewcastle GW, McMichael A, Showalter HD, Fry DW, Kraker AJ, Denny WA. Tyrosine kinase inhibitors. 8 An unusually steep structure-activity relationship for analogues of 4-(3-bromoanilino)-6,7-dimethoxyquinazoline (PD 153035), a potent inhibitor of the epidermal growth factor receptor. J Med Chem. 1996;39:267–276. doi: 10.1021/jm9503613. [DOI] [PubMed] [Google Scholar]
- Brunn GJ, Williams J, Sabers C, Wiederrecht G, Lawrence JC, Jr, Abraham RT. Direct inhibition of the signaling functions of the mammalian target of rapamycin by the phosphoinositide 3-kinase inhibitors, wortmannin and LY294002. EMBO J. 1996;15:5256–5267. [PMC free article] [PubMed] [Google Scholar]
- Carballada R, Yasuo H, Lemaire P. Phosphatidylinositol-3 kinase acts in parallel to the ERK MAP kinase in the FGF pathway during Xenopus mesoderm induction. Development. 2001;128:35– 44. doi: 10.1242/dev.128.1.35. [DOI] [PubMed] [Google Scholar]
- Czech MP. PIP2 and PIP3: complex roles at the cell surface. Cell. 2000;100:603– 606. doi: 10.1016/s0092-8674(00)80696-0. [DOI] [PubMed] [Google Scholar]
- Davies SP, Reddy H, Caivano M, Cohen P. Specificity and mechanism of action of some commonly used protein kinase inhibitors. Biochem J. 2000;351:95–105. doi: 10.1042/0264-6021:3510095. [DOI] [PMC free article] [PubMed] [Google Scholar]
- De Moerlooze L, Spencer-Dene B, Revest J, Hajihosseini M, Rosewell I, Dickson C. An important role for the IIIb isoform of fibroblast growth factor receptor 2 (FGFR2) in mesenchymal–epithelial signalling during mouse organogenesis. Development. 2000;127:483–492. doi: 10.1242/dev.127.3.483. [DOI] [PubMed] [Google Scholar]
- Fruman DA, Meyers RE, Cantley LC. Phosphoinositide kinases. Annu Rev Biochem. 1998;67:481–507. doi: 10.1146/annurev.biochem.67.1.481. [DOI] [PubMed] [Google Scholar]
- Gilbert SF. Developmental Biology. Sinauer Associates, Inc.; Sunderland, MA: 2000. [Google Scholar]
- Grobstein C, Cohen J. Collagenase: effect on the morphogenesis of embryonic salivary epithelium in vitro. Science. 1965;150:626– 628. doi: 10.1126/science.150.3696.626. [DOI] [PubMed] [Google Scholar]
- Hartley KO, Gell D, Smith GC, Zhang H, Divecha N, Connelly MA, Admon A, Lees-Miller SP, Anderson CW, Jackson SP. DNA-dependent protein kinase catalytic subunit: a relative of phosphatidylinositol 3-kinase and the ataxia telangiectasia gene product. Cell. 1995;82:849– 856. doi: 10.1016/0092-8674(95)90482-4. [DOI] [PubMed] [Google Scholar]
- Hawkins PT, Eguinoa A, Qiu RG, Stokoe D, Cooke FT, Walters R, Wennstrom S, Claesson-Welsh L, Evans T, Symons M, et al. PDGF stimulates an increase in GTP-Rac via activation of phosphoinositide 3-kinase. Curr Biol. 1995;5:393– 403. doi: 10.1016/s0960-9822(95)00080-7. [DOI] [PubMed] [Google Scholar]
- Hernandez R, Teruel T, Lorenzo M. Akt mediates insulin induction of glucose uptake and up-regulation of GLUT4 gene expression in brown adipocytes. FEBS Lett. 2001;494:225–231. doi: 10.1016/s0014-5793(01)02353-5. [DOI] [PubMed] [Google Scholar]
- Hieda Y, Nakanishi Y. Epithelial morphogenesis in mouse embryonic submandibular gland: its relationships to the tissue organization of epithelium and mesenchyme. Dev Growth Differ. 1997;39:1– 8. doi: 10.1046/j.1440-169x.1997.00001.x. [DOI] [PubMed] [Google Scholar]
- Hoffman MP, Kidder B, Steinberg Z, Lakhani S, Ho S, Kleinman HK, Larsen M. Gene expression profiles of mouse submandibular gland development: FGFR1 regulates branching morphogenesis in vitro through BMP- and FGF-dependant mechanisms. Development. 2002;129:5767–5778. doi: 10.1242/dev.00172. [DOI] [PubMed] [Google Scholar]
- Jaskoll T, Melnick M. Submandibular gland morphogenesis: stage-specific expression of TGF-alpha/EGF, IGF, TGF-beta, TNF, and IL-6 signal transduction in normal embryonic mice and the phenotypic effects of TGF-beta2, TGF-beta3, and EGF-r null mutations. Anat Rec. 1999;256:252–268. doi: 10.1002/(SICI)1097-0185(19991101)256:3<252::AID-AR5>3.0.CO;2-6. [DOI] [PubMed] [Google Scholar]
- Jaskoll T, Zhou YM, Chai Y, Makarenkova HP, Collinson JM, West JD, Hajihosseini MK, Lee J, Melnick M. Embryonic submandibular gland morphogenesis: stage-specific protein localization of FGFs, BMPs, Pax6 and Pax9 in normal mice and abnormal SMG phenotypes in FgfR2-IIIc(+/Delta), BMP7(−/−) and Pax6(−/−) Mice. Cells Tissues Organs. 2002;170:83–98. doi: 10.1159/000046183. [DOI] [PubMed] [Google Scholar]
- Kadoya Y, Kadoya K, Durbeej M, Holmvall K, Sorokin L, Ekblom P. Antibodies against domain E3 of laminin-1 and integrin alpha 6 subunit perturb branching epithelial morphogenesis of submandibular gland, but by different modes. J Cell Biol. 1995;129:521–534. doi: 10.1083/jcb.129.2.521. [DOI] [PMC free article] [PubMed] [Google Scholar]
- Kadoya Y, Yamashina S. Distribution of alpha 6 integrin subunit in developing mouse submandibular gland. J Histochem Cytochem. 1993;41:1707–1714. doi: 10.1177/41.11.8409377. [DOI] [PubMed] [Google Scholar]
- Kashimata M, Gresik EW. Epidermal growth factor system is a physiological regulator of development of the mouse fetal submandibular gland and regulates expression of the alpha6-integrin subunit. Dev Dyn. 1997;208:149–161. doi: 10.1002/(SICI)1097-0177(199702)208:2<149::AID-AJA2>3.0.CO;2-I. [DOI] [PubMed] [Google Scholar]
- Kashimata M, Sayeed S, Ka A, Onetti-Muda A, Sakagami H, Faraggiana T, Gresik EW. The ERK-1/2 signaling pathway is involved in the stimulation of branching morphogenesis of fetal mouse submandibular glands by EGF. Dev Biol. 2000;220:183–196. doi: 10.1006/dbio.2000.9639. [DOI] [PubMed] [Google Scholar]
- Melnick M, Chen H, Min Zhou Y, Jaskoll T. The functional genomic response of developing embryonic submandibular glands to NF-kappaB inhibition. BMC Dev Biol. 2001;1:15. doi: 10.1186/1471-213X-1-15. [DOI] [PMC free article] [PubMed] [Google Scholar]
- Meyers R, Cantley LC. Cloning and characterization of a wortmannin-sensitive human phosphatidylinositol 4-kinase. J Biol Chem. 1997;272:4384– 4390. doi: 10.1074/jbc.272.7.4384. [DOI] [PubMed] [Google Scholar]
- Miyazaki M. Branching morphogenesis in the embryonic mouse submandibular gland: a scanning electron microscopic study. Arch Histol Cytol. 1990;53:157–165. doi: 10.1679/aohc.53.157. [DOI] [PubMed] [Google Scholar]
- Morita K, Nogawa H. EGF-dependent lobule formation and FGF7-dependent stalk elongation in branching morphogenesis of mouse salivary epithelium in vitro. Dev Dyn. 1999;215:148–154. doi: 10.1002/(SICI)1097-0177(199906)215:2<148::AID-DVDY7>3.0.CO;2-V. [DOI] [PubMed] [Google Scholar]
- Nakanishi H, Brewer KA, Exton JH. Activation of the zeta isozyme of protein kinase C by phosphatidylinositol 3,4,5-trisphosphate. J Biol Chem. 1993;268:13–16. [PubMed] [Google Scholar]
- Nakanishi Y, Morita T, Nogawa H. Cell proliferation is not required for the initiation of early cleft formation in mouse embryonic submandibular epithelium in vitro. Development. 1987;99:429– 437. doi: 10.1242/dev.99.3.429. [DOI] [PubMed] [Google Scholar]
- Nowak F, Jacquemin-Sablon A, Pierre J. Epidermal growth factor receptor signaling cascade as target for tyrphostin (RG 50864) in epithelial cells. Paradoxical effects on mitogen-activated protein kinase kinase and mitogen-activated protein kinase activities. Biochem Pharmacol. 1997;53:287–298. doi: 10.1016/s0006-2952(96)00688-0. [DOI] [PubMed] [Google Scholar]
- Ohuchi H, Hori Y, Yamasaki M, Harada H, Sekine K, Kato S, Itoh N. FGF10 acts as a major ligand for FGF receptor 2 IIIb in mouse multi-organ development. Biochem Biophys Res Commun. 2000;277:643– 649. doi: 10.1006/bbrc.2000.3721. [DOI] [PubMed] [Google Scholar]
- Okano J, Gaslightwala I, Birnbaum MJ, Rustgi AK, Nakagawa H. Akt/Protein kinase B isoforms are differentially regulated by epidermal growth factor stimulation. J Biol Chem. 2000;275:30934–30942. doi: 10.1074/jbc.M004112200. [DOI] [PubMed] [Google Scholar]
- Partanen AM, Thesleff I. Localization and quantitation of 125I-epidermal growth factor binding in mouse embryonic tooth and other embryonic tissues at different developmental stages. Dev Biol. 1987;120:186–197. doi: 10.1016/0012-1606(87)90117-5. [DOI] [PubMed] [Google Scholar]
- Pinna LA. Protein kinase CK2: a challenge to canons. J Cell Sci. 2002;115:3823–3878. doi: 10.1242/jcs.00074. [DOI] [PubMed] [Google Scholar]
- Royce LS, Kibbey MC, Mertz P, Kleinman HK, Baum BJ. Human neoplastic submandibular intercalated duct cells express an acinar phenotype when cultured on a basement membrane matrix. Differentiation. 1993;52:247–255. doi: 10.1111/j.1432-0436.1993.tb00637.x. [DOI] [PubMed] [Google Scholar]
- Scheid MP, Woodgett JR. PKB/AKT: functional insights from genetic models. Nat Rev Mol Cell Biol. 2001;2:760–768. doi: 10.1038/35096067. [DOI] [PubMed] [Google Scholar]
- Sekine K, Ohuchi H, Fujiwara M, Yamasaki M, Yoshizawa T, Sato T, Yagishita N, Matsui D, Koga Y, Itoh N, Kato S. Fgf10 is essential for limb and lung formation. Nat Genet. 1999;21:138–141. doi: 10.1038/5096. [DOI] [PubMed] [Google Scholar]
- Soltoff SP, Carraway KL, 3rd, Prigent SA, Gullick WG, Cantley LC. ErbB3 is involved in activation of phosphatidylinositol 3-kinase by epidermal growth factor. Mol Cell Biol. 1994;14:3550–3558. doi: 10.1128/mcb.14.6.3550. [DOI] [PMC free article] [PubMed] [Google Scholar]
- Spooner BS, Bassett KE, Spooner BS., Jr Embryonic salivary gland epithelial branching activity is experimentally independent of epithelial expansion activity. Dev Biol. 1989;133:569–575. doi: 10.1016/0012-1606(89)90059-6. [DOI] [PubMed] [Google Scholar]
- Spooner BS, Wessells NK. An analysis of salivary gland morphogenesis: role of cytoplasmic microfilaments and microtubules. Dev Biol. 1972;27:38–54. doi: 10.1016/0012-1606(72)90111-x. [DOI] [PubMed] [Google Scholar]
- Stephens L, Anderson K, Stokoe D, Erdjument-Bromage H, Painter GF, Holmes AB, Gaffney PR, Reese CB, McCormick F, Tempst P, Coadwell J, Hawkins PT. Protein kinase B kinases that mediate phosphatidylinositol 3,4,5-trisphosphate-dependent activation of protein kinase B. Science. 1998;279:710–714. doi: 10.1126/science.279.5351.710. [DOI] [PubMed] [Google Scholar]
- Takahashi Y, Nogawa H. Branching morphogenesis of mouse salivary epithelium in basement membrane-like substratum separated from mesenchyme by the membrane filter. Development. 1991;111:327–335. doi: 10.1242/dev.111.2.327. [DOI] [PubMed] [Google Scholar]
- Tang MJ, Cai Y, Tsai SJ, Wang YK, Dressler GR. Ureteric bud outgrowth in response to RET activation is mediated by phosphatidylinositol 3-kinase. Dev Biol. 2002;243:128–136. doi: 10.1006/dbio.2001.0557. [DOI] [PubMed] [Google Scholar]
- Toker A. Protein kinases as mediators of phosphoinositide 3-kinase signaling. Mol Pharmacol. 2000;57:652– 658. [PubMed] [Google Scholar]
- Toker A, Meyer M, Reddy KK, Falck JR, Aneja R, Aneja S, Parra A, Burns DJ, Ballas LM, Cantley LC. Activation of protein kinase C family members by the novel polyphosphoinositides PtdIns-3,4-P2 and PtdIns-3,4,5-P3. J Biol Chem. 1994;269:32358 –32367. [PubMed] [Google Scholar]
- Yarden Y, Sliwkowski MX. Untangling the ErbB signalling network. Nat Rev Mol Cell Biol. 2001;2:127–137. doi: 10.1038/35052073. [DOI] [PubMed] [Google Scholar]
Associated Data
This section collects any data citations, data availability statements, or supplementary materials included in this article.