

Abstract
Background
We have shown previously that input impedance of the pulmonary vasculature provides a comprehensive characterization of right ventricular afterload by including compliance. However, impedance-based compliance assessment requires invasive measurements. Here, we develop and validate a noninvasive method to measure pulmonary artery (PA) compliance using ultrasound color M-mode (CMM) Doppler tissue imaging (DTI).
Methods
Dynamic compliance (Cdyn) of the PA was obtained from CMM DTI and continuous wave Doppler measurement of the tricuspid regurgitant velocity. Cdyn was calculated as: [(Ds − Dd)/(Dd × Ps)] × 104; where Ds = systolic diameter, Dd = diastolic diameter, and Ps = systolic pressure. The method was validated both in vitro and in 13 patients in the catheterization laboratory, and then tested on 27 pediatric patients with pulmonary hypertension, with comparison with 10 age-matched control subjects. Cdyn was also measured in an additional 13 patients undergoing reactivity studies.
Results
Instantaneous diameter measured using CMM DTI agreed well with intravascular ultrasound measurements in the in vitro models. Clinically, Cdyn calculated by CMM DTI agreed with Cdyn calculated using invasive techniques (23.4 ± 16.8 vs 29.1 ± 20.6%/100 mm Hg; P = not significant). Patients with pulmonary hypertension had significantly lower peak wall velocity values and lower Cdyn values than control subjects (P < .01). Cdyn values followed an exponentially decaying relationship with PA pressure, indicating the nonlinear stress–strain behavior of these arteries. Reactivity in Cdyn agreed with reactivity measured using impedance techniques.
Conclusion
The Cdyn method provides a noninvasive means of assessing PA compliance and should be useful as an additional measure of vascular reactivity subsequent to pulmonary vascular resistance in patients with pulmonary hypertension.
Evaluation of pediatric patients with pulmonary hypertension (PH) remains a major challenge. Children may develop PH secondary to an underlying condition such as a congenital heart defect involving increased flow as in a left-to-right shunt or a defect causing increased pulmonary venous pressure such as left ventricular diastolic dysfunction. Other children may develop PH from intrinsic vascular changes, also known as idiopathic or primary PH. Regardless of cause, PH exerts increased workload on the right ventricle.
Conventional methods of evaluating right ventricular workload are predicated on assuming steady-state conditions and neglect pulsatility, which manifests as a result of the compliance of the upstream pulmonary vasculature, ie, the elastic (vs downstream resistance) vessels. The measurement of pulmonary vascular resistance (PVR) in particular, which is the current standard for determining vaso-reactivity of the pulmonary circulation, focuses on the distal pulmonary vessels and does not provide information about proximal pulmonary artery (PA). Neglecting the compliance of the proximal arteries does not take into the account the work performed by these vessels to continue moving blood down the vascular tree during diastole.
Using invasively obtained input impedance of the pulmonary vasculature in patients with PH, we have shown that compliance measurement can be an important addition to the clinician’s arsenal for evaluating pulmonary vascular reactivity and vascular function.1 However, the invasive nature of this method limits its use. Here, we present a noninvasive means of measuring PA compliance for use both as an independent measure of upstream vascular compliance, and as an additional parameter to evaluate reactivity, subsequent to PVR.
Methods
In Vitro Validation
The method uses color M-mode (CMM) Doppler tissue imaging (DTI) to obtain instantaneous diameter of the PA, and couples this with noninvasively obtained peak systolic PA pressure by measurement of the tricuspid regurgitant (TR) jet velocity by continuous wave Doppler, to measure compliance. The CMM DTI method is a newly developed technique to measure instantaneous diameter. We first evaluated the use of CMM DTI in measuring diameter using a previously described in vitro model of an elastic PA.1 The method for obtaining diameter from CMM DTI is discussed below. Diameters obtained from CMM DTI were compared with diameters obtained from intravascular ultrasound (IVUS).
Clinical Studies
Approval for this study was obtained from our institutional review board. Informed consent and, when appropriate, informed assent was obtained from each patient and/or a parent. The study population consisted of 3 groups. Group I consisted of patients seen in the clinical echocardiography laboratory ranging in age from 0.75 to 17 years (mean age: 10.1 ± 4.8 years) with normal PA dynamics but measurable TR jets (N = 10). Patients of group II ranged in age from 0.67 to 17 years (mean age: 8.1 ± 5.5 years; 19 boys) and had PH (secondary or primary) with Doppler-measured TR jet velocities greater than 2.5 m/s (N = 27). Each patient underwent echocardiography evaluation. Furthermore, a subset (N = 13) of patients from group II underwent simultaneous cardiac catheterization for standard indications; these data were used to compare the noninvasive compliance measurement against an invasive standard. Lastly, an additional 13 patients being evaluated for reactivity in the catheterization laboratory using oxygen and/or nitric oxide were studied. These patients ranged in age from 0.5 to 12 years (mean age: 5.4 ± 3.6 years; 6 boys) and comprised group III.
Calculation of Dynamic Compliance
Dynamic compliance (Cdyn) was calculated using the following formula1,2:
where Ds is systolic diameter, Dd is diastolic diameter, and Ps is systolic pressure. Cdyn has been shown to be superior to other methods such as the pressure–strain modulus for assessing arterial compliance during PH.2 However, Cdyn has required invasive methods for the measurement of Ds and Dd (through IVUS) and Ps (through pressure catheters). Here we propose the use of CMM DTI to accurately obtain Ds and Dd and Doppler measurement of the TR jet to obtain Ps for the noninvasive measurement of arterial compliance in PH.
Echocardiographic Measurements
CMM DTI studies were performed using a commercially available scanner (Vivid 5, GE Medical Systems, Milwaukee, Wis). Images were obtained with a flat phased-array probe appropriate to patient size (2.5, 3.5, 5.0, or 10 MHz). Patients were positioned supine with slight extension of the neck for acquisition of the suprasternal short-axis view of the right PA (RPA). The probe was aligned parallel to the RPA and scaling was adjusted to maximize view of the arterial walls. The DTI mode was activated in B-mode imaging to examine arterial motion; once a suitable image was obtained, the mode was changed to CMM with the beam line aligned perpendicular to the superior and inferior walls of the RPA. Such a window ensured that wall motion was aligned with the ultrasound beam line, which minimizes angle-dependent errors in DTI data. The use of CMM combined with DTI produced higher spatial (1.6–1.9 mm) and temporal (5 milliseconds) resolution than conventional echocardiography, which allowed for precise measurement of the instantaneous diameter of the RPA over the cardiac cycle. Moreover, integrating velocity to obtain diameter produces a well-smoothed diameter trace and does not require edge detection, both superior qualities when compared with conventional M-mode methods. Studies were saved in digital format for offline analysis.
Offline Analysis
Offline analysis was performed using custom software (MATLAB programming environment, Mathworks Inc, Natick, Mass). The software uses simple automated graphic tools for precise determination of the location of the wall lumen interface of the PA. Information such as diameter, wall location, velocity, and acceleration are simultaneously displayed as functions of time.
Using the simultaneously recorded electrocardiogram, the start and end time for a specific region of interest were defined as the beginning of the P wave and the beginning of the next P wave, respectively. These points were chosen to provide a graphic display of all of the mechanical events during one cardiac cycle between the start and end time. The start and end depths of the specific region of interest were then selected to include all of the superior and inferior walls of the RPA, with the lumen approximately in the middle.
A multistep iterative process was used to obtain the instantaneous diameter from the CMM DTI data. The process begins with identification of the initial tissue–blood interface from the conventional M-mode image. This forms the initial guess for the wall location. The CMM DTI data from this point are then used to extract the local wall velocity of superior and inferior walls of the RPA by performing a digital integration to obtain local position of both walls,3 comparing this position with the position where the CMM DTI data were originally determined, and iterating until the difference is negligible. This process produced the local instantaneous position of the luminal surface of both walls of the RPA, from which simple subtraction produced the local diameter. Note that this method uses local, relative information to produce diameter and so is not affected by global motion such as cardiac motion, which will affect both walls equally and, thus, will be canceled out during the subtraction process. A total of 3 separate cardiac cycles were analyzed for each patient.
Reproducibility
To assess reproducibility of CMM DTI, intraobserver and interobserver variability for Ds and Dd were assessed. Echocardiographic measurements were performed on the same data by two separate experienced observers (K. D. and B. D.) on two separate days. Variability was expressed as a mean percentage error between measurements [ie, (measurement A − measurement B)/mean of both measurements].
Validation Using Invasive Measurement of Pressure
Of the 27 patients from group II, 13 underwent simultaneous tranthoracic echocardiograms and cardiac catheterization. All procedures were performed under standardized general anesthesia. All patients underwent complete hemodynamic evaluation of the pulmonary and systemic vascular beds. PA pressures were measured directly using standard fluid-filled catheters. Cdyn calculated using invasive pressure data was compared with Cdyn calculated using the noninvasive technique.
Reactivity Analysis
We have previously shown that measuring compliance may be an additional useful parameter to comprehensively characterize pulmonary vascular reactivity in patients undergoing vasodilator challenge.1 However, this prior method used invasive techniques to obtain compliance. Therefore, we also studied whether noninvasively measured Cdyn could be used to assess compliance reactivity in an additional 13 patients undergoing reactivity testing in the catheterization laboratory. Reactivity assessed using noninvasively obtained Cdyn was compared with reactivity assessed using conventional methods (hemodynamics: PVR), and using the previously reported impedance method.1
Statistical Analysis
All values are given as mean ± SD. Cdyn measured invasively was compared with Cdyn measured noninvasively in the 13 patients who underwent cardiac catheterization using a paired Student t test. Unpaired Student t test was used to examine differences between compliance measured in the 27 patients with PH versus the 10 healthy control subjects. Nonlinear regression was used to examine changes in compliance with PA pressure. The level of statistical significance for all tests was set at .05.
Results
In Vitro Validation
Figure 1, A, shows instantaneous diameter measured using IVUS and using CMM DTI for one of the elastic mock arteries used in vitro, and Figure 1, B, shows an agreement analysis for all data points. As can be seen, good agreement between the two methods was found. In fact, CMM DTI provides a more temporally resolved trace of diameter because it has better temporal resolution than IVUS.
Figure 1.
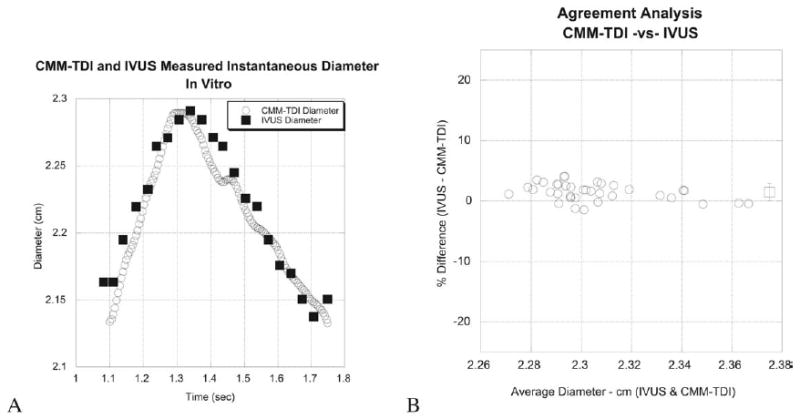
In vitro validation of color M-mode Doppler tissue imaging (CMM-TDI) to measure instantaneous diameter compared with intravascular ultrasound (IVUS).
Clinical Studies
Demographic data for the control and hypertensive subjects are provided in Tables 1 and 2. Excellent CMM DTI could be obtained on all control subjects and patients with PH. Figure 2, A, shows the 2-dimensional echocardiographic image used to position the CMM DTI beam line with the RPA below the overriding aorta. Figure 2, B, shows a sample CMM DTI, with color corresponding to local wall velocity. Results from the custom software used to extract instantaneous diameter are shown in Figure 3, for normal pulmonary hemodynamics and for a patient with PH. Note the decreased wall velocity, increased mean diameter, and decreased range of diameter change over the cycle for the patient with PH.
Table 1.
Group I data (control subjects)
| Patient | Age, yr | Wt, kg | Reason for echocardiogram | Cdyn (% change/100 mm Hg) |
|---|---|---|---|---|
| Nl 1 | 12 | 37.8 | Arrhythmia | 114.42 |
| Nl 2 | 9 | 25.7 | Syncope | 61.23 |
| Nl 3 | 5 | 15.4 | Murmur | 107.05 |
| Nl 4 | 12 | 32.5 | Chest pain | 250.82 |
| Nl 5 | 17 | 54.5 | Murmur | 121.86 |
| Nl 6 | 13 | 49.5 | Rule out Marfan’s syndrome | 38.14 |
| Nl 7 | 15 | 40.8 | Chromosomal anomaly | 144.93 |
| Nl 8 | 7 | 18.0 | Murmur | 57.08 |
| Nl 9 | 10 | 67.9 | Tachycardia | 46.15 |
| Nl 10 | .75 | 9.1 | Murmur | 96.17 |
Cdyn, dynamic compliance; Wt, weight.
Table 2.
Group II (patients with pulmonary hypertension) data
| Patient | Age, yr | Weight, kg | Sex | Diagnosis | Cdyn (%/100 mm Hg) |
|---|---|---|---|---|---|
| PH 1 | 0.67 | 7.2 | F | S/P ASD | 82.33 |
| PH 2 | .91 | 8.0 | F | S/P ASD, PDA | 45.01 |
| PH 3 | 14 | 38 | F | S/P ASD PDA | 37.76 |
| PH 4 | 11 | 55.4 | F | Portal HTN | 15.54 |
| PH 5 | 14 | 55.5 | M | PPH | 9.05 |
| PH 6 | 12 | 45.8 | M | PPH | 6.06 |
| PH 7 | 8 | 29.9 | F | S/P ASD PDA | 21.70 |
| PH 8 | 5 | 22.9 | F | PPH | 36.96 |
| PH 9 | 2 | 14.7 | F | S/P ASD | 41.68 |
| PH 10 | 15 | 67.2 | F | PPH | 11.31 |
| PH 11 | 7 | 14.9 | F | DS | 55.58 |
| PH 12 | 2 | 10.3 | M | S/P VSD, CoA | 14.90 |
| PH 13 | 9 | 48.2 | M | PPH | 77.88 |
| PH 14 | 4 | 17.9 | F | PPH | 58.64 |
| PH 15 | 3 | 12.2 | F | PPH | 36.11 |
| PH 16 | 16 | 52.8 | F | PPH | 4.96 |
| PH 17 | .75 | 6.5 | M | DS, VSD | 59.49 |
| PH 18 | 10 | 25.0 | M | S/P ASD | 22.54 |
| PH 19 | 2 | 13.4 | F | TAPVR | 33.33 |
| PH 20 | 4 | 16.0 | F | S/P ASD | 76.45 |
| PH 21 | 2 | 9.3 | F | S/P VSD PDA | 21.78 |
| PH 22 | 14 | 51.9 | F | PPH | 24.50 |
| PH 23 | 17 | 69.5 | M | PPH | 65.15 |
| PH 24 | 2 | 10.4 | F | ASD | 48.02 |
| PH 25 | 15 | 54.2 | M | PPH | 22.95 |
| PH 26 | 12 | 55.2 | F | PPH | 16.26 |
| PH 27 | 12 | 55.5 | M | PPH | 19.38 |
Cdyn, dynamic compliance; F, female; M, male.
Figure 2.
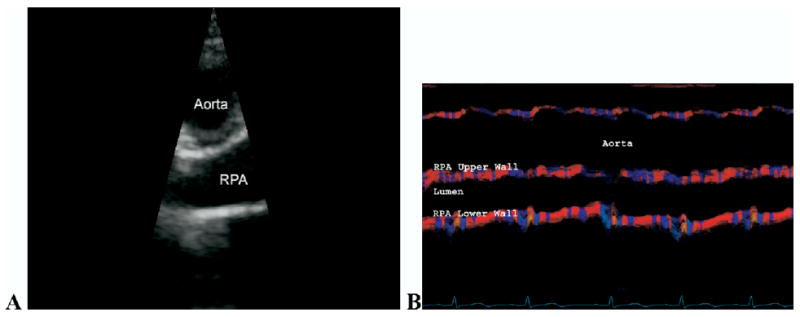
Two-dimensional echocardiographic view (A) used to line color M-mode Doppler tissue imaging (CMM DTI) beam line and corresponding CMM DTI of right pulmonary artery (RPA) (B).
Figure 3.
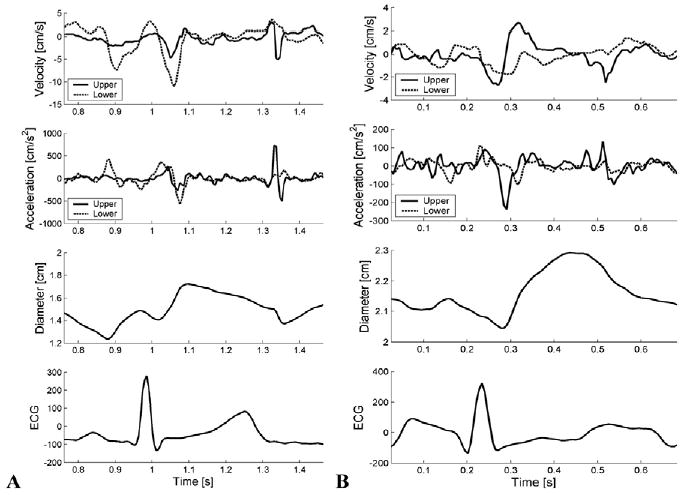
Results from analysis of color M-mode Doppler tissue imaging measurements from individual with normal pulmonary hemodynamics (A) and patient with pulmonary hypertension (B), showing instantaneous velocity, acceleration, and diameter of upper and lower walls of right pulmonary artery. Note different Y-axis scales between normotensive and hypertensive results. ECG, Electrocardiogram.
Cdyn calculated noninvasively correlated well with Cdyn calculated invasively, as shown in Figure 4, with some overestimation (∼25%). The SE was 8.56%. The overestimation should have minimal impact on clinical use because the method will most likely be used in a manner similar to current use of PVR in clinical challenge, which evaluates changes from baseline values. Statistically, no significant difference in invasive versus noninvasive Cdyn values were found (paired Student t test means: 23.4 ± 16.8 vs 29.1 ± 20.6%/100 mm Hg; P = not significant).
Figure 4.
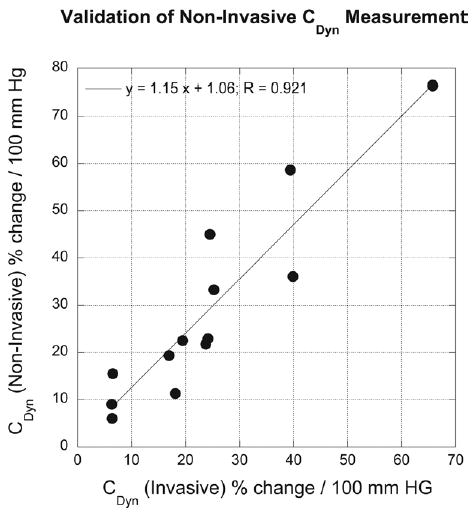
Comparison of invasively versus noninvasively obtained dynamic compliance (Cdyn) values for subset of patients of group II studied in catheterization laboratory.
The CMM DTI method produces wall velocities, which also could be used as an indication of arterial stiffening. Figure 5, A, shows the peak RPA wall velocities averaged over all control subjects and over all patients with PH. A mean value of 4.40 ± 0.55 cm/s was found for the control subjects; this decreased to a mean of 2.94 ± 0.45 cm/s (P < .001) for the patients with PH.
Figure 5.
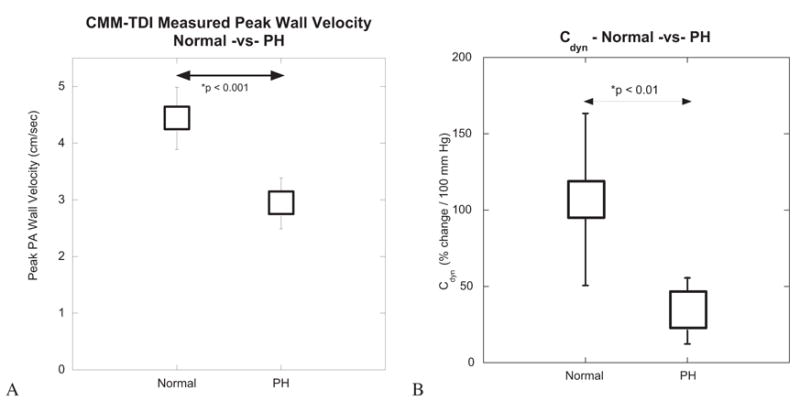
Mean and SD for peak wall velocity (A) and dynamic compliance (Cdyn) (B) obtained from patients of group I. CMM-TDI, Color M-mode Doppler tissue imaging; PA, pulmonary artery; PH, pulmonary hypertension.
Normal values of Cdyn measured noninvasively ranged from 38.14% to 250.82% change in diameter/100 mm Hg. Values of Cdyn for the patients with PH ranged from 4.05% to 82.23% change in diameter/100 mm Hg. The difference between normal and PH values of Cdyn was statistically significant (P < .01) (Figure 5).
When all Cdyn values are plotted against PA pressure, an inverse relationship is seen (Figure 6). As PA pressure increases, Cdyn decreases in highly nonlinear fashion. The nonlinearity is the manifestation of the nonlinear stress–strain behavior of PAs.4–7
Figure 6.
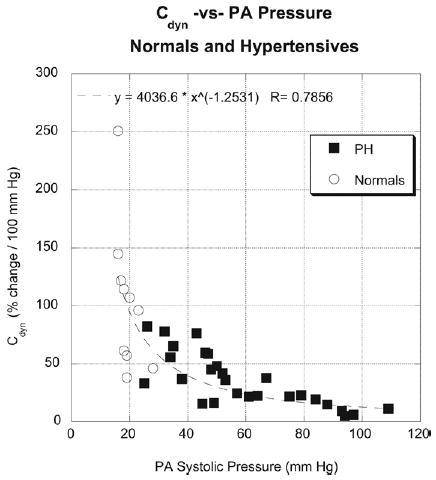
Dynamic compliance (Cdyn) plotted against pulmonary artery (PA) systolic pressure for both control subjects (circles) and patients with pulmonary hypertension (squares). Note nonlinear relationship, indicating mechanical response of PAs to pressure.
An additional study on a separate set of patients (group III) was conducted to examine whether Cdyn could be used to evaluate reactivity in compliance. These were performed on 13 additional patients undergoing reactivity testing in the catheterization laboratory. Data for Cdyn against mean PA pressure for each of the 6 patients are shown in Figure 7 and in Table 3. Baseline (for pressure and Cdyn) and postchallenge values are shown. Several trends are clear: first, all data points continue to exhibit the nonlinear compliance-versus-pressure relationship seen in Figure 6; second, percent change in Cdyn from baseline could be used to evaluate reactivity in compliance, similar to current assessment of reactivity using mean pressure and/or PVR; third, differences were found between the conventional classification of reactivity based on PVR changes, and classification of compliance reactivity based on Cdyn changes (Table 3). Thus, the inclusion of compliance reactivity provides additional information on the hemodynamic status of the entire pulmonary vasculature.
Figure 7.
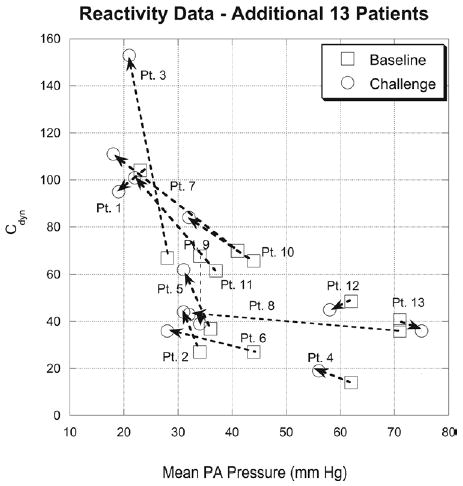
Dynamic compliance (Cdyn) against mean pulmonary artery (PA) pressure for 13 additional patients (group III) undergoing reactivity testing (oxygen and/or nitric oxide) in catheterization laboratory. Baseline (room air) (squares) and challenge (circles) conditions are shown for each patient. Changes in Cdyn with changes in pressure can be used to evaluate reactivity in compliance.
Table 3.
Reactivity data for an additional 13 patients
| Patient No. | MPAP (base) | MPAP (chall) | Cdyn (base) | Cdyn (chall) | Hemodynamic classification | Impedance classification | Cdyn classification |
|---|---|---|---|---|---|---|---|
| 1 | 23 | 19 | 103.77 | 95.90 | Normal | Normal | Nonreactive |
| 2 | 35 | 32 | 27.16 | 43.20 | Nonreactive | PH-Reactive | Reactive |
| 3 | 28 | 21 | 67.83 | 153.16 | Reactive | Normal | Reactive |
| 4 | 62 | 56 | 15.85 | 19.22 | Nonreactive | PH-Nonreactive | Nonreactive |
| 5 | 36 | 31 | 37.98 | 62.54 | Nonreactive | PH-Reactive | Reactive |
| 6 | 47 | 28 | 27.56 | 35.63 | Reactive | PH-Nonreactive | Nonreactive |
| 7 | 41 | 22 | 69.94 | 101.34 | Reactive | PH-Reactive | Reactive |
| 8 | 71 | 31 | 36.05 | 44 | Reactive | PH-Reactive | Reactive |
| 9 | 34 | 34 | 67.73 | 38.70 | Nonreactive | PH-Nonreactive | Nonreactive |
| 10 | 44 | 32 | 65.88 | 84.04 | Reactive | PH-Reactive | Reactive |
| 11 | 37 | 18 | 61.52 | 110.46 | Reactive | PH-Reactive | Reactive |
| 12 | 62 | 58 | 48.60 | 45.06 | Nonreactive | PH-Nonreactive | Nonreactive |
| 13 | 71 | 75 | 40.73 | 35.68 | Nonreactive | PH-Nonreactive | Nonreactive |
Cdyn, dynamic compliance; chall, challenge; MPAP, mean pulmonary artery pressure.
Interobserver and intraobserver variability for the noninvasive Cdyn measurements were 4.7% and 4.2%, respectively.
Discussion
The prognosis and management of pediatric PH primarily depend on assessment of vasoreactivity.4,8 Conventionally, vasoreactivity has been measured by PVR, and recent work has shown the use of PVR with clinical challenge to predict outcomes in children with idiopathic PH.9 Although PVR provides valuable information, there are several important limitations to its exclusive use. First, PVR requires the use of invasive methods. We have recently introduced a novel noninvasive method of estimating PVR using ultrasound CMM flow propagation measurements,5 and so have made progress with this issue. Secondly, PVR is a steady-state parameter that measures opposition to continuous flow, thereby neglecting the dynamic and pulsatile nature of the pulmonary circulation.6,7 The dynamic nature of cardiac pumping requires a coordinated effort between ventricular work during systole and arterial work during diastole to most efficiently move blood into the peripheral vasculature over the cardiac cycle. Diastolic work by the proximal arteries depends strongly on proximal artery compliance. Neglecting this through the sole measurement of PVR produces an incomplete picture of right heart loading and efficiency of the pulmonary vasculature. When evaluating efficacy of treatments for primary PH or when determining reactivity of the pulmonary vasculature for presurgical planning in secondary PH, the addition of compliance evaluation should provide the most comprehensive means of quantifying right ventricular afterload and pulmonary vascular efficiency. Such an evaluation may be especially useful when coupled with currently used protocols for challenging the pulmonary vasculature using vasodilators because changes in proximal PA compliance with challenge would indicate that any potential stiffness of the artery under baseline conditions may be caused by the strain–stiffening effect that manifests at higher PA pressures than as a result of structural changes in wall properties (ie, true structural remodeling). Strain–stiffening of the artery may be relieved purely by decreasing mean PA pressure through a pulmonary vasodilator; conversely, structural remodeling of the wall will not reverse because of acutely lowered pressures. This may provide an additional means of sorting through the vagaries of hemodynamic response in these complex cases. We have recently reported on a novel parameter, reactivity in compliance, which should provide just such an assessment of strain–stiffening versus structural remodeling in the proximal pulmonary vasculature.1 However, the invasive nature of this method precludes it from being used for routine follow-up or evaluation of novel therapies. The current study extends this prior work to the noninvasive area, which we believe is an important advance. The potential to evaluate compliance and reactivity noninvasively promises the possibility of bedside evaluation of such patients, remote-site examination, and potentially decreased risks.
Noninvasive measures of arterial stiffness have been reported previously.10–15 These have focused on measures of changes in arterial area (pulsatility) or diameter (distensibility), or extraction of circumferential strain from such changes. We have shown use in CMM DTI for assessing PA pulsatility as well.16 The primary limitation of these methods is that they provide a measure of arterial deformation only without indication of the level of deforming force (pressure). In this regard, use of compliance, which includes pressure, should provide the best representation of the mechanical response of the arterial wall in the clinical situation. Deformation-only measures may be useful in situations where changes in function are to be determined, such as in reactivity testing, when an adequate TR jet may not be available.
The use of CMM DTI produces certain advantages when measuring diameter. Because CMM DTI has much better temporal resolution than conventional 2-dimensional imaging, it can track time-dependent changes in arterial motion to the same degree as conventional M-mode imaging. However, unlike conventional M-mode imaging, which only provides structural information, CMM DTI is most sensitive to arterial motion. By measuring wall velocity and then integrating to obtain local wall position, the method produces smoother diameter versus time traces than conventional M-mode, primarily because some sort of edge-detection method is needed to obtain instantaneous diameter using conventional M-mode. Such edge-detection methods are notorious in producing “jagged” edges, which require smoothing during postprocessing. Secondly, because wall velocity is instantaneous obtained, it can be used by itself for estimating the degree of arterial stiffening between PH and normotensive conditions, and thereby provides a quick method for assessing PA stiffness. These studies show peak wall velocities of approximately 4 cm/s for healthy control subjects; this decreases to 2.9 cm/s for patients with PH. Lastly, the capability of obtaining instantaneous diameter versus time data allows additional types of analyses, especially in the catheterization laboratory where associated pressure data can also be digitized simultaneously into the ultrasound scanner. For example, Figure 8 displays preliminary data showing diameter–pressure curves of the PA for a control subject and a patients with PH, obtained using a combination of the CMM DTI method and simultaneously digitized pressure data. Such types of analysis may be used when access to invasive data is available, as when studies are performed in the catheterization laboratory, and may provide an increased level of accuracy because the entire diameter–pressure curve can be used for analysis. However, it must be understood that CMM DTI poses several limitations as well, which we discuss briefly below.
Figure 8.
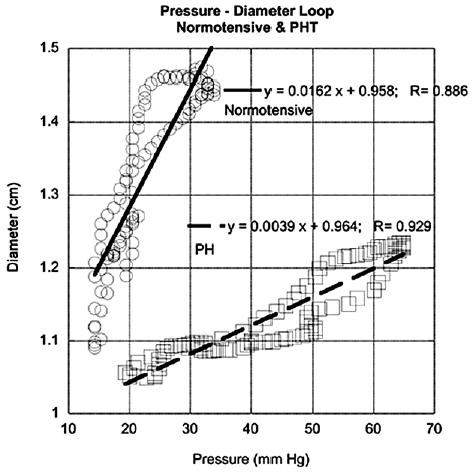
Preliminary data showing diameter–pressure plots obtained using color M-mode Doppler tissue imaging (CMM DTI) and invasively measured pressure digitized simultaneously into ultrasound scanner for control subject and patient with pulmonary hypertension (PH). Ability to obtain instantaneous diameter data allows such potentially more sophisticated types of analysis to be performed using CMM DTI.
The use of the TR jet to obtain Cdyn is a necessary requirement, which should be applicable to the large majority of pediatric patients with PH, but that also produces limitations in the method. The most obvious limitation is the relatively small number of individuals with normal pulmonary hemodynamics who have an easily identifiable and measurable TR Doppler jet envelope. In our studies, 30 control subjects were initially selected; however, only 10 of these had a measurable TR Doppler envelope. In contrast, 27 of 30 patients with PH had measurable TR Doppler envelopes. The second limitation is that use of the TR jet velocity provides peak Ps only; ideally, both diastolic pressure and Ps are needed to capture true mechanical compliance. This may produce problems when using this method for patients with high peak pulmonary pressures but normal compliance, such as those with moderate to severe pulmonary regurgitation, where potentially higher TR jet velocities would cause a false decrease in Cdyn values and so indicate decreased compliance. Conversely, pulmonary regurgitation may also impose additional wall-motion changes; studying the true accuracy of this method in patients with PH would be warranted. The agreement between Cdyn measured invasively and that measured noninvasively was most likely increased by the large variability we see in Cdyn, especially for normal pulmonary dynamics. However, this issue is of less importance because the proposed approach for using Cdyn involves examination of changes (ie, reactivity) from a baseline value for a particular patient. Nevertheless, a wider study documenting variability in Cdyn for a spectrum of pressure and flow conditions (eg, high pressure, high flow; high pressure, low flow) is warranted.
The wide range of compliance values seen for the control subjects indicates the high degree of mechanical flexibility inherent in the upstream PAs. We have documented such variability in animal models of normotensive and hypertensive PAs using biomechanical testing coupled with sophisticated finite element analysis techniques,17 and believe the compliance capacity of these arteries is an essential feature of the normal pulmonary vasculature. Understanding the relationships between compliance and associate physiologic parameters such as age and body surface area would be of interest for future studies. Nevertheless, our study provides some guidance for clinical use of this method. When control subjects and patients with hypertension were grouped together, a threshold of 40% change/100 mm Hg for Cdyn could be set as the change from normal compliance (values > 40) and stiff vessels (values < 40). Baseline evaluation of a patient can, thus, provide initial indication of whether the PAs have stiffened. Subsequent evaluation using vaso-dilator challenge would then indicate whether structural remodeling has taken place (nonreactive in compliance), or whether the artery is undergoing strain–stiffening (reactive in compliance). Based on our studies, the use of 40% change/100 mm Hg could be recommended as a threshold; cases where Cdyn increases beyond 15% to 20% of the baseline value with vasodilator challenge would, thus, be classified as reactive in compliance. Note that the 40% value should be considered an initial proposal, and further studies to more extensively document the range of normal and hypertensive values for Cdyn over a range of causes are needed to better guide ultimate clinical application.
Besides the limitations imposed by the TR jet measurement technique, there are other limitations that should be mentioned. We used the RPA for PA diameter measurements in place of the main PA. Several reasons underlie this choice. First, because both are functionally elastic arteries, they would be expected to have similar wall architecture, characterized predominantly by elastin lamellar layers in the medial layer and collagen reinforcement in the adventitia and, thus, similar mechanical response. Second, the RPA is well visualized by the suprasternal view (short or long axis) and this window has been used for evaluation of PA size and distensibility18; it is far more difficult to obtain a view where the main PA runs perpendicular to the ultrasound beam line, a necessary requirement to ensure minimal angulation errors in the CMM DTI data. Third, the suprasternal view allows M-mode imaging to be performed, which has superior resolution to 2-dimensional echocardiography. Fourth, RPA diameter measurements have been used in prior angiographic studies evaluating PA distensibility and we wished to maintain continuity with prior work.19 Because of the study design, changes in arterial wall compliance could not be correlated with histologic changes such as those seen with IVUS; this requires further investigation. Of particular interest would be the time course of changes in PA compliance and wall histology after correction of cardiac defects associated with increased PA pressure, which may lead to a better understanding of the pathogenesis of pulmonary vascular disease. CMM DTI, being a spectral estimation technique similar to conventional color Doppler imaging, also has decreased spatial resolution when compared with conventional Doppler or traditional pulse echocardiographic amplitude imaging modalities. For example, the spectral estimation technique used in CMM DTI to obtain velocity is time-limited to allow rapid imaging, which may cause increased uncertainty in measuring wall velocity. Although the 5-millisecond temporal resolution of the method should be sufficient to track most wall-motion phenomena, it may still be incapable of tracking very rapid changes in wall motion. Likewise, the color Doppler method for measuring local velocity, which requires relatively larger pulse lengths and multiple pulses, decreases spatial resolution; still, the resultant spatial resolution obtained in our study (1.6–1.9 mm) should be sufficient to capture motion of the PA wall. Lastly, certain anesthetic agents may alter vascular tone during the catheterization. However, in these studies, the majority of the patients undergoing catheterization received a combination of sevoflurane, isoflurane, propofol, and remifentanyl. Patients received inhaled sevoflurane and isoflurane for induction and were maintained on intravenous propofol and remifentanyl during the procedure. The remaining patients received conscious sedation in the form of intravenous fentanyl. None of these agents should alter vascular tone.
We conclude the CMM DTI appears to be a promising noninvasive means of assessing pulmonary vascular compliance in patients with PH and should prove useful in examining reactivity in compliance as a subsequent parameter to PVR in evaluating and sorting these patients.
Acknowledgments
Supported in part by grants from the National Institutes of Health (HL 067393, HL 072738).
References
- 1.Weinberg C, Hertzberg J, Ivy DD, Kirby KS, Chen KC, Valdes-Cruz LM, et al. Extraction of pulmonary vascular compliance, PVR and RV work from single-pressure and Doppler flow measurements in children with pulmonary hypertension–a new method for evaluating reactivity: in vitro and clinical studies. Circulation. 2004;110:2609–17. doi: 10.1161/01.CIR.0000146818.60588.40. [DOI] [PubMed] [Google Scholar]
- 2.Weinberg C, Hertzberg J, Shandas R. Utility of intravascular ultrasound to measure local compliance of the pediatric pulmonary artery: in vitro studies. J Am Soc Echocardiogr. 2002;15:1507–14. doi: 10.1067/mje.2002.126821. [DOI] [PubMed] [Google Scholar]
- 3.Press WH, Teukolsky SA, Vetterling WT, Flannery BP. Numerical recipes in C: the art of scientific computing. 2. New York: Cambridge University Press; 1992. p. 131. [Google Scholar]
- 4.Berner M, Beghetti M, Spahr-Schopfer I, Oberhansli I, Friedli B. Inhaled nitric oxide to test the vasodilator capacity of the pulmonary vascular bed in children with long-standing pulmonary hypertension and congenital heart disease. Am J Cardiol. 1996;77:532–5. doi: 10.1016/s0002-9149(97)89353-8. [DOI] [PubMed] [Google Scholar]
- 5.Shandas R, Weinberg C, Ivy DD, Nicol E, DeGroff CG, Hertzberg J, et al. Development of a noninvasive ultrasound color M-mode means of estimating pulmonary vascular resistance in pediatric pulmonary hypertension: mathematical analysis, in vitro validation, and preliminary clinical studies. Circulation. 2001;104:908–14. doi: 10.1161/hc3301.094926. [DOI] [PubMed] [Google Scholar]
- 6.Hoffman J. Diagnosis and treatment of pulmonary vascular disease. Birth Defects. 1972;8:9–18. [Google Scholar]
- 7.Berger RMF. Possibilities and impossibilities in the evaluation of pulmonary vascular disease in congenital heart defects. Eur Heart J. 2000;21:17–27. doi: 10.1053/euhj.1999.1698. [DOI] [PubMed] [Google Scholar]
- 8.Rashid A, Ivy D. Severe pediatric pulmonary hypertension: new management strategies. Arch Dis Child. 2005;90:92–8. doi: 10.1136/adc.2003.048744. [DOI] [PMC free article] [PubMed] [Google Scholar]
- 9.Yung D, Widlitz AC, Rosenzweig EB, Kerstein D, Maislin G, Barst RF. Outcomes in children with idiopathic pulmonary arterieal hypertension. Circulation. 2004;110:660–5. doi: 10.1161/01.CIR.0000138104.83366.E9. [DOI] [PubMed] [Google Scholar]
- 10.Bonnefous O, Montaudon M, Sananes JC, Denis E. Noninvasive echocardiographic techniques for arterial wall characterization. IEEE Ultrason Symp. 1996;2:1059–64. [Google Scholar]
- 11.Eriksson A, Greiff E, Loupas T, Persson M, Pesque P. Arterial pulse wave velocity with tissue Doppler imaging. Ultrasound Med Biol. 2002;28:571–80. doi: 10.1016/s0301-5629(02)00495-7. [DOI] [PubMed] [Google Scholar]
- 12.Pelle G, Pascal O, Adnot S, Gueret P, Dubois-Rande JL, Belhassen L. Characterization of peripheral arterial wall motion by Doppler tissue echocardiography: a validation study. J Am Soc Echocardiogr. 2002;15:1218–25. doi: 10.1067/mje.2002.124517. [DOI] [PubMed] [Google Scholar]
- 13.Schmidt-Trucksass A, Grathwohl D, Schmid A, Boragk A, Upmeier C, Keul J, et al. Assessment of carotid wall motion and stiffness with tissue Doppler imaging. Ultrasound Med Biol. 1998;24:639–46. doi: 10.1016/s0301-5629(98)00023-4. [DOI] [PubMed] [Google Scholar]
- 14.Eryol NK, Topsakal R, Cicek Y, Abaci A, Oguzhan A, Basar E, et al. Color Doppler tissue imaging in assessing the elastic properties of the aorta and in the predicting coronary artery disease. Jpn Heart J. 2002;43:219–30. doi: 10.1536/jhj.43.219. [DOI] [PubMed] [Google Scholar]
- 15.Studinger P, Lenard Z, Reneman R, Kollai M. Measurement of aortic arch distension wave with the echo-track technique. Ultrasound Med Biol. 2000;26:1285–91. doi: 10.1016/s0301-5629(00)00264-7. [DOI] [PubMed] [Google Scholar]
- 16.Das BB, Lanning CJ, Dyer KL, Ivy DD, Valdes-Cruz LM, Shandas R. Evaluation of pulmonary artery pulsatility in pulmonary hypertension using color M-mode tissue Doppler imaging in infants and children. Pediatr Res. 2004;55:51A. [Google Scholar]
- 17.Zhang Y, Dunn M, Drexler ES, McCowan CN, Slifka AJ, Ivy D, et al. A microstructural hyperelastic model of pulmonary arteries under normo- and hypertensive conditions. Ann Biomed Eng. 2005;35:1042–52. doi: 10.1007/s10439-005-5771-2. [DOI] [PubMed] [Google Scholar]
- 18.Pasierski TJ, Starling RC, Binkely PF, Pearson AC. Echocardiographic evaluation of pulmonary artery distensibility. Chest. 1993;104:1080–3. doi: 10.1378/chest.103.4.1080. [DOI] [PubMed] [Google Scholar]
- 19.Moore NR, Scott JP, Flower CDR, Higenbottam TW. The relationship between pulmonary artery pressure and pulmonary artery diameter in pulmonary hypertension. Clin Radiol. 1988;39:486–9. doi: 10.1016/s0009-9260(88)80205-8. [DOI] [PubMed] [Google Scholar]