Abstract
cDNA microarray technology is used to profile complex diseases and discover novel disease-related genes. In inflammatory disease such as rheumatoid arthritis, expression patterns of diverse cell types contribute to the pathology. We have monitored gene expression in this disease state with a microarray of selected human genes of probable significance in inflammation as well as with genes expressed in peripheral human blood cells. Messenger RNA from cultured macrophages, chondrocyte cell lines, primary chondrocytes, and synoviocytes provided expression profiles for the selected cytokines, chemokines, DNA binding proteins, and matrix-degrading metalloproteinases. Comparisons between tissue samples of rheumatoid arthritis and inflammatory bowel disease verified the involvement of many genes and revealed novel participation of the cytokine interleukin 3, chemokine Groα and the metalloproteinase matrix metallo-elastase in both diseases. From the peripheral blood library, tissue inhibitor of metalloproteinase 1, ferritin light chain, and manganese superoxide dismutase genes were identified as expressed differentially in rheumatoid arthritis compared with inflammatory bowel disease. These results successfully demonstrate the use of the cDNA microarray system as a general approach for dissecting human diseases.
Keywords: inflammation, human genome analysis, gene discovery
The recently described cDNA microarray or DNA-chip technology allows expression monitoring of hundreds and thousands of genes simultaneously and provides a format for identifying genes as well as changes in their activity (1, 2). Using this technology, two-color fluorescence patterns of differential gene expression in the root versus the shoot tissue of Arabidopsis were obtained in a specific array of 48 genes (1). In another study using a 1000 gene array from a human peripheral blood library, novel genes expressed by T cells were identified upon heat shock and protein kinase C activation (3).
The technology uses cDNA sequences or cDNA inserts of a library for PCR amplification that are arrayed on a glass slide with high speed robotics at a density of 1000 cDNA sequences per cm2. These microarrays serve as gene targets for hybridization to cDNA probes prepared from RNA samples of cells or tissues. A two-color fluorescence labeling technique is used in the preparation of the cDNA probes such that a simultaneous hybridization but separate detection of signals provides the comparative analysis and the relative abundance of specific genes expressed (1, 2). Microarrays can be constructed from specific cDNA clones of interest, a cDNA library, or a select number of open reading frames from a genome sequencing database to allow a large-scale functional analysis of expressed sequences.
Because of the wide spectrum of genes and endogenous mediators involved, the microarray technology is well suited for analyzing chronic diseases. In rheumatoid arthritis (RA), inflammation of the joint is caused by the gene products of many different cell types present in the synovium and cartilage tissues plus those infiltrating from the circulating blood. The autoimmune and inflammatory nature of the disease is a cumulative result of genetic susceptibility factors and multiple responses, paracrine and autocrine in nature, from macrophages, T cells, plasma cells, neutrophils, synovial fibroblasts, chondrocytes, etc. Growth factors, inflammatory cytokines (4), and the chemokines (5) are the important mediators of this inflammatory process. The ensuing destruction of the cartilage and bone by the invading synovial tissue includes the actions of prostaglandins and leukotrienes (6), and the matrix degrading metalloproteinases (MMPs). The MMPs are an important class of Zn-dependent metallo-endoproteinases that can collectively degrade the proteoglycan and collagen components of the connective tissue matrix (7).
This paper presents a study in which the involvement of select classes of molecules in RA was examined. Also investigated were 1000 human genes randomly selected from a peripheral human blood cell library. Their differential and quantitative expression analysis in cells of the joint tissue, in diseased RA tissue and in inflammatory bowel disease (IBD) tissues was conducted to demonstrate the utility of the microarray method to analyze complex diseases by their pattern of gene expression. Such a survey provides insight not only into the underlying cause of the pathology, but also provides the opportunity to selectively target genes for disease intervention by appropriate drug development and gene therapies.
METHODS
Microarray Design, Development, and Preparation.
Two approaches for the fabrication of cDNA microarrays were used in this study. In the first approach, known human genes of probable significance in RA were identified. Regions of the clones, preferably 1 kb in length, were selected by their proximity to the 3′ end of the cDNA and for areas of least identity to related and repetitive sequences. Primers were synthesized to amplify the target regions by standard PCR protocols (3). Products were verified by gel electrophoresis and purified with Qiaquick 96-well purification kit (Qiagen, Chatsworth, CA), lyophilized (Savant), and resuspended in 5 μl of 3× standard saline citrate (SSC) buffer for arraying. In the second approach, the microarray containing the 1056 human genes from the peripheral blood lymphocyte library was prepared as described (3).
Tissue Specimens.
Rheumatoid synovial tissue was obtained from patients with late stage classic RA undergoing remedial synovectomy or arthroplasty of the knee. Synovial tissue was separated from any associated connective tissue or fat. One gram of each synovial specimen was subjected to RNA extraction within 40 min of surgical excision, or explants were cultured in serum-free medium to examine any changes under in vitro conditions. For IBD, specimens of macroscopically inflamed lower intestinal mucosa were obtained from patients with Crohn disease undergoing remedial surgery. The hypertrophied mucosal tissue was separated from underlying connective tissue and extracted for RNA.
Cultured Cells.
The Mono Mac-6 (MM6) monocytic cells (8) were grown in RPMI medium. Human chondrosarcoma SW1353 cells, primary human chondrocytes, and synoviocytes (9, 10) were cultured in DMEM; all culture media were supplemented with 10% fetal bovine serum, 100 μg/ml streptomycin, and 500 units/ml penicillin. Treatment of cells with lipopolysaccharide (LPS) endotoxin at 30 ng/ml, phorbol 12-myristate 13-acetate (PMA) at 50 ng/ml, tumor necrosis factor α (TNF-α) at 50 ng/ml, interleukin (IL)-1β at 30 ng/ml, or transforming growth factor-β (TGF-β) at 100 ng/ml is described in the figure legends.
Fluorescent Probe, Hybridization, and Scanning.
Isolation of mRNA, probe preparation, and quantitation with Arabidopsis control mRNAs was essentially as described (3) except for the following minor modification. Following the reverse transcriptase step, the appropriate Cy3- and Cy5-labeled samples were pooled; mRNA degraded by heating the sample to 65°C for 10 min with the addition of 5 μl of 0.5M NaOH plus 0.5 ml of 10 mM EDTA. The pooled cDNA was purified from unincorporated nucleotides by gel filtration in Centri-spin columns (Princeton Separations, Adelphia, NJ). Samples were lyophilized and dissolved in 6 μl of hybridization buffer (5× SSC plus 0.2% SDS). Hybridizations, washes, scanning, quantitation procedures, and pseudocolor representations of fluorescent images have been described (3). Scans for the two fluorescent probes were normalized either to the fluorescence intensity of Arabidopsis mRNAs spiked into the labeling reactions (see Figs. 2, 3, 4) or to the signal intensity of β-actin and glyceraldehyde-3-phosphate dehydrogenase (GAPDH; see Fig. 5).
Figure 2.
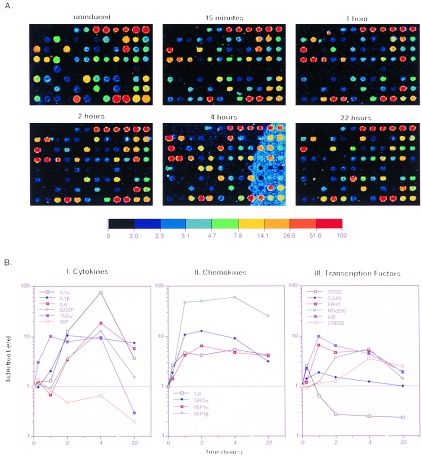
Time course for LPS/PMA-induced MM6 cells. Array elements are described in Fig. 1. (A) Pseudocolor representations of fluorescent scans correspond to gene expression levels at each time point. The array is made up of 8 Arabidopsis control targets and 86 human cDNA targets, the majority of which are genes with known or suspected involvement in inflammation. The color bars provide a comparative calibration scale between arrays and are derived from the Arabidopsis mRNA samples that are introduced in equal amounts during probe preparation. Fluorescent probes were made by labeling mRNA from untreated MM6 cells or LPS and PMA treated cells. mRNA was isolated at indicated times after induction. (B I–III) The two-color samples were cohybridized, and microarray scans provided the data for the levels of select transcripts at different time points relative to abundance at time zero. The analysis was performed using normalized data collected from 8-bit images.
Figure 3.
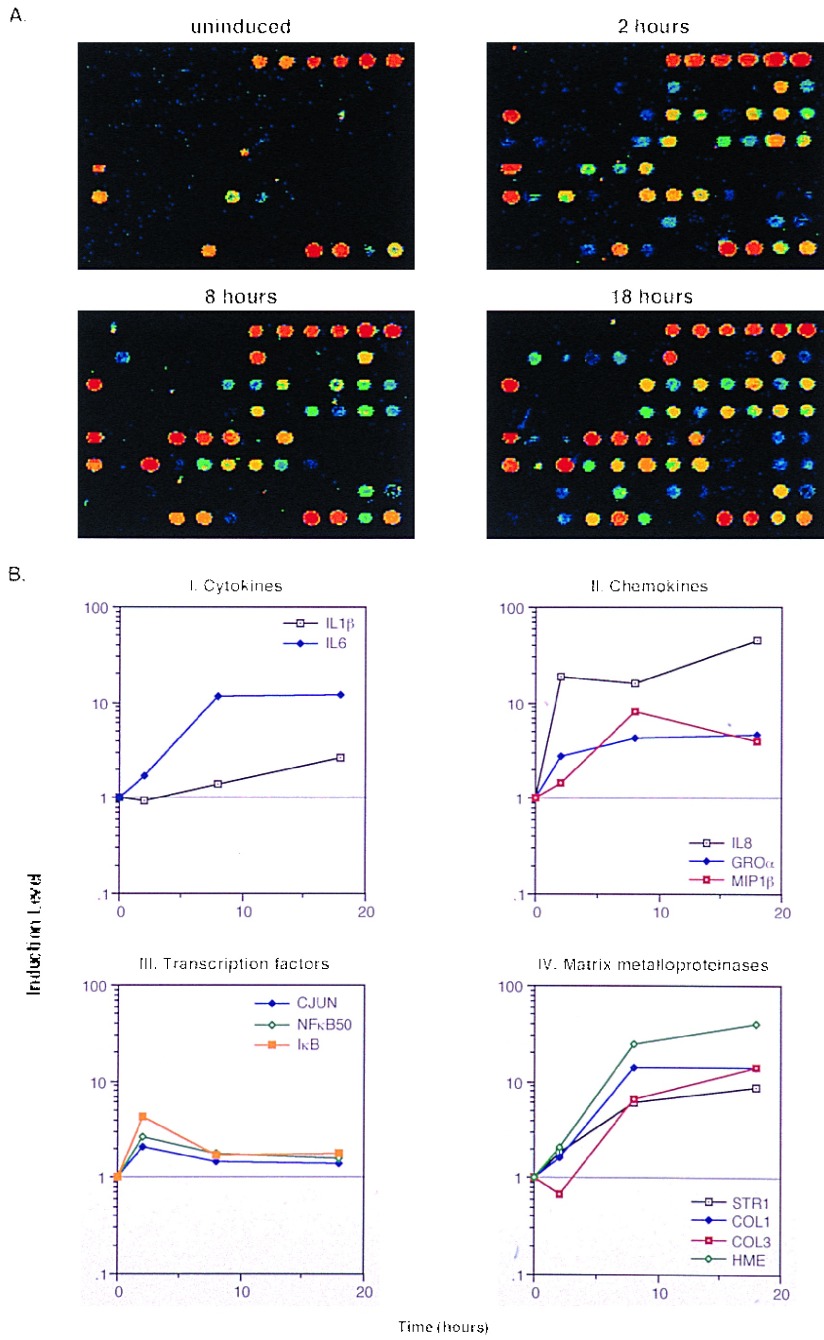
Time course for IL-1β and TNF-induced SW1353 cells using the inflammation array (Fig. 1). (A) Pseudocolor representation of fluorescent scans correspond to gene expression levels at each time point. (B I–IV) Relative levels of selected genes at different time points compared with time zero.
Figure 4.
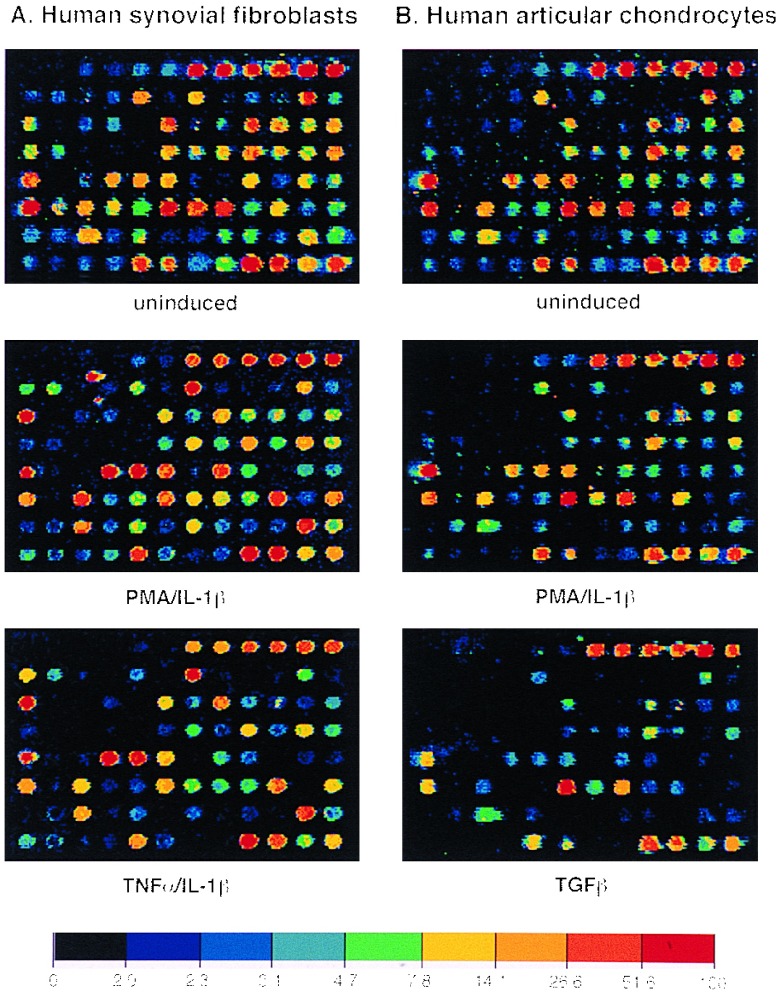
Expression profiles for early passage primary synoviocytes and chondrocytes isolated from RA tissue, cultured in the presence of 10% fetal calf serum and activated with PMA and IL-1β, or TNF and IL-1β, or TGF-β for 18 hr. The color bars provide a comparative calibration scale between arrays and are derived from the Arabidopsis mRNA samples that are introduced in equal amounts during probe preparation
Figure 5.
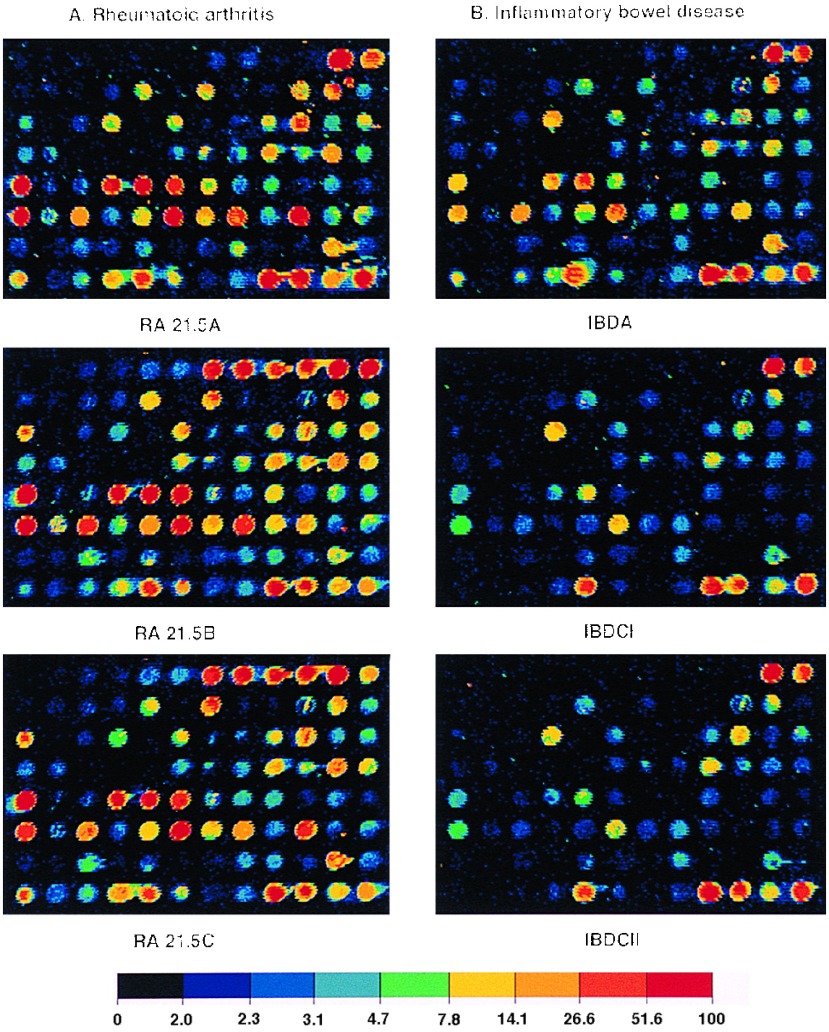
Expression profiles of RA tissue (A) and IBD tissue (B). mRNA from RA tissue samples obtained from the same individual was isolated directly after excision (RA 21.5A) or maintained in culture without serum for 2 hr (RA 21.5B) or for 6 hr (RA 21.5C). Profiles from tissue samples of two other individuals (data not shown) were remarkably similar to the ones shown here. IBD-A and IBD-CI are from mRNA samples prepared directly after surgery from two separate individuals. For the IBD-CII probe, the tissue sample was cultured in medium without serum for 2 hr before mRNA preparation.
RESULTS
Ninety-Six-Gene Microarray Design.
The actions of cytokines, growth factors, chemokines, transcription factors, MMPs, prostaglandins, and leukotrienes are well recognized in inflammatory disease, particularly RA (11–14). Fig. 1 displays the selected genes for this study and also includes control cDNAs of housekeeping genes such as β-actin and GAPDH and genes from Arabidopsis for signal normalization and quantitation (row A, columns 1–12).
Figure 1.
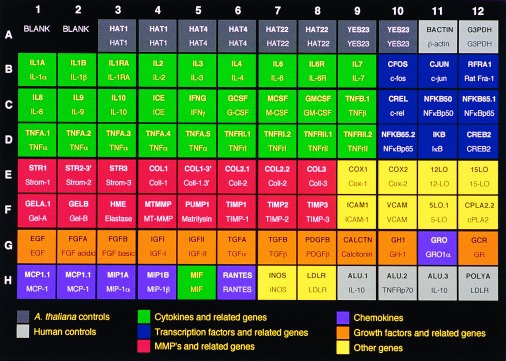
Ninety-six-element microarray design. The target element name and the corresponding gene are shown in the layout. Some genes have more than one target element to guarantee specificity of signal. For TNF the targets represent decreasing lengths of 1, 0.8, 0.6, 0.4, and 0.2 kb from left to right.
Defining Microarray Assay Conditions.
Different lengths and concentrations of target DNA were tested by arraying PCR-amplified products ranging from 0.2 to 1.2 kb at concentrations of 1 μg/μl or less. No significant difference in the signal levels was observed within this range of target size and only with 0.2-kb length was a signal reduced upon an 8-fold dilution of the 1 μg/μl sample (data not shown). In this study the average length of the targets was 1 kb, with a few exceptions in the range of ≈300 bp, arrayed at a concentration of 1 μg/μl. Normally one PCR provided sufficient material to fabricate up to 1000 microarray targets.
In considering positional effects in the development of the targets for the microarrays, selection was biased toward the 3′ proximal regions, because the signal was reduced if the target fragment was biased toward the 5′ end (data not shown). This result was anticipated since the hybridizing probe is prepared by reverse transcription with oligo(dT)-primed mRNA and is richer in 3′ proximal sequences. Cross-hybridizations of probes to targets of a gene family were analyzed with the matrix metalloproteinases as the example because they can show regions of sequence identities of greater than 70%. With collagenase-1 (Col-1) and collagenase-2 (Col-2) genes as targets with up to 70% sequence identity, and stromelysin-1 (Strom-1) and stromelysin-2 (Strom-2) genes with different degrees of identity, our results showed that a short region of overlap, even with 70–90% sequence identity, produced a low level of cross-hybridization. However, shorter regions of identity spread over the length of the target resulted in cross-hybridization (data not shown). For closely related genes, targets were designed by avoiding long stretches of homology. For members of a gene family two or more target regions were included to discriminate between specificity of signal versus cross-hybridization.
Monitoring Differential Expression in Cultured Cell Lines.
In RA tissue, the monocyte/macrophage population plays a prominent role in phagocytic and immunomodulatory activities. Typically these cells, when triggered by an immunogen, produce the proinflammatroy cytokines TNF and IL-1. We have used the monocyte cell line MM6 and monitored changes in gene expression upon activation with LPS endotoxin, a component of Gram-negative bacterial membranes, and PMA, which augments the action of LPS on TNF production (15). RNA was isolated at different times after induction and used for cDNA probe preparation. From this time course it was clear that TNF expression was induced within 15 min of treatment, reached maximum levels in 1 hr, remained high until 4 hr and subsequently declined (Fig. 2A). Many other cytokine genes were also transiently activated, such as IL-1α and -β, IL-6, and granulocyte colony-stimulating factor (GCSF). Prominent chemokines activated were IL-8, macrophage inflammatory protein (MIP)-1β, more so than MIP-1α, and Groα or melanoma growth stimulatory factor. Migration inhibitory factor (MIF) expressed in the uninduced state declined in LPS-activated cells. Of the immediate early genes, the noticeable ones were c-fos, fra-1, c-jun, NF-κBp50, and IκB, with c-rel expression observed even in the uninduced state (Fig. 2B). These expression patterns are consistent with reported patterns of activation of certain LPS- and PMA-induced genes (12). Demonstrated here is the unique ability of this system to allow parallel visualization of a large number of gene activities over a period of time.
SW1353 cells is a line derived from malignant tumors of the cartilage and behaves much like the chondrocytes upon stimulation with TNF and IL-1 in the expression of MMPs (9). In addition to confirming our earlier observations with Northern blots on Strom-1, Col-1, and Col-3 expression (9), gelatinase (Gel) A, putative metalloproteinase (PUMP)-1 membrane-type matrix metalloproteinase, tissue inhibitors of matrix metalloproteinases or tissue inhibitor of metalloproteinase 1 (TIMP-1), -2, and -3 were also expressed by these cells together with the human matrix metallo-elastase (HME; Fig. 3A). HME induction was estimated to be ≈50-fold and was greater than any of the other MMPs examined (Fig. 3B). This result was unexpected because HME is reportedly expressed only by alveolar macrophage and placental cells (16). Expression of the cytokines and chemokines, IL-6, IL-8, MIF, and MIP-1β was also noted. A variety of other genes, including certain transcription factors, were also up-regulated (Fig. 3), but the overall time-dependent expression of genes in the SW1353 cells was qualitatively distinct from the MM6 cells.
Quantitation of differential gene expression (Figs. 2B and 3B) was achieved with the simultaneous hybridization of Cy3-labeled cDNA from untreated cells and Cy5-labeled cDNA from treated samples. The estimated increases in expression from these microarrays for a select number of genes including IL-1β, IL-8, MIP-1β, TNF, HME, Col-1, Col-3, Strom-1, and Strom-2 were compared with data collected from dot blot analysis. Results (not shown) were in close agreement and confirmed our earlier observations on the use of the microarray method for the quantitation of gene expression (3).
Expression Profiles in Primary Chondrocytes and Synoviocytes of Human RA Tissue.
Given the sensitivity and the specificity of this method, expression profiles of primary synoviocytes and chondrocytes from diseased tissue were examined. Without prior exposure to inducing agents, low level expression of c-jun, GCSF, IL-3, TNF-β, MIF, and RANTES (regulated upon activation, normal T cell expressed and secreted) was seen as well as expression of MMPs, GelA, Strom-1, Col-1, and the three TIMPs. In this case, Col-2 hybridization was considered to be nonspecific because the second Col-2 target taken from the 3′ end of the gene gave no signal. Treatment more so with PMA and IL-1, than TNF and IL-1, produced a dramatic up-regulation in expression of several genes in both of these primary cell types. These genes are as follows: the cytokine IL-6, the chemokines IL-8 and Gro-1α, and the MMPs; Strom-1, Col-1, Col-3, and HME; and the adhesion molecule, vascular cell adhesion molecule 1 (VCAM-1). The surprise again is HME expression in these primary cells, for reasons discussed above. From these results, the expression profiles of synoviocytes and the chondrocytes appear very similar; the differences are more quantitative than qualitative. Treatment of the primary chondrocytes with the anabolic growth factor TGF-β had an interesting profile in that it produced a remarkable down-regulation of genes expressed in both the untreated and induced state (Fig. 4).
Given the demonstrated effectiveness of this technology, a comparative analysis of two different inflammatory disease states was conducted with probes made from RA tissue and IBD samples. RA samples were from late stage rheumatoid synovial tissue, and IBD specimens were obtained from inflamed lower intestinal mucosa of patients with Crohn disease. With both the 96-element known gene microarray and the 1000-gene microarray of cDNAs selected from a peripheral human blood cell library (3), distinct differences in gene expression patterns were evident. On the 96-gene array, RA tissue samples from different affected individuals gave similar profiles (data not shown) as did different samples from the same individual (Fig. 5). These patterns were notably similar to those observed with primary synoviocytes and chondrocytes (Fig. 4). Included in the list of prominently up-regulated genes are IL-6, the MMPs Strom-1, Col-1, GelA, HME, and in certain samples PUMP, TIMPs, particularly TIMP-1 and TIMP-3, and the adhesion molecule VCAM. Discernible levels of macrophage chemotactic protein 1 (MCP-1), MIF and RANTES were also noted. IBD samples were in comparison, rather subdued although IL-1 converting enzyme (ICE), TIMP-1, and MIF were notable in all the three different IBD samples examined here. In IBD-A, one of three individual samples, ICE, VCAM, Groα, and MMP expression was more pronounced than in the others.
We also made use of a peripheral blood cDNA library (3) to identify genes expressed by lymphocytes infiltrating the inflamed tissues from the circulating blood. With the 1046-element array of randomly selected cDNAs from this library, probes made from RA and IBD samples showed hybridizations to a large number of genes. Of these, many were common between the two disease tissues while others were differentially expressed (data not shown). A complete survey of these genes was beyond the scope of this study, but for this report we picked three genes that were up-regulated in the RA tissue relative to IBD. These cDNAs were sequenced and identified by comparison to the GenBank database. They are TIMP-1, apoferritin light chain, and manganese superoxide dismutase (MnSOD). Differential expression of MnSOD was only observed in samples of RA tissue explants maintained in growth medium without serum for anywhere between 2 to 16 hr. These results also indicate that the expression profile of genes can be altered when explants are transferred to culture conditions.
DISCUSSION
The speed, ease, and feasibility of simultaneously monitoring differential expression of hundreds of genes with the cDNA microarray based system (1–3) is demonstrated here in the analysis of a complex disease such as RA. Many different cell types in the RA tissue; macrophages, lymphocytes, plasma cells, neutrophils, synoviocytes, chondrocytes, etc. are known to contribute to the development of the disease with the expression of gene products known to be proinflammatory. They include the cytokines, chemokines, growth factors, MMPs, eicosanoids, and others (7, 11–14), and the design of the 96-element known gene microarray was based on this knowledge and depended on the availability of the genes. The technology was validated by confirming earlier observations on the expression of TNF by the monocyte cell line MM6, and of Col-1 and Col-3 expression in the chondrosarcoma cells and articular chondrocytes (9, 12). In our time-dependent survey the chronological order of gene activities in and between gene families was compared and the results have provided unprecedented profiles of the cytokines (TNF, IL-1, IL-6, GCSF, and MIF), chemokines (MIP-1α, MIP-1β, IL-8, and Gro-1), certain transcription factors, and the matrix metalloproteinases (GelA, Strom-1, Col-1, Col-3, HME) in the macrophage cell line MM6 and in the SW1353 chondrosarcoma cells.
Earlier reports of cytokine production in the diseased state had established a model in which TNF is a major participant in RA. Its expression reportedly preceded that of the other cytokines and effector molecules (4). Our results strongly support these results as demonstrated in the time course of the MM6 cells where TNF induction preceded that of IL-1α and IL-β followed by IL-6 and GCSF. These expression profiles demonstrate the utility of the microarrays in determining the hierarachy of signaling events.
In the SW1353 chondrosarcoma cells, all the known MMPs and TIMPs were examined simultaneously. HME expression was discovered, which previously had been observed in only the stromal cells and alveolar macrophages of smoker’s lungs and in placental tissue. Its presence in cells of the RA tissue is meaningful because its activity can cause significant destruction of elastin and basement membrane components (16, 17). Expression profiles of synovial fibroblasts and articular chondrocytes were remarkably similar and not too different from the SW1353 cells, indicating that the fibroblast and the chondrocyte can play equally aggressive roles in joint erosion. Prominent genes expressed were the MMPs, but chemokines and cytokines were also produced by these cells. The effect of the anabolic growth factor TGF-β was profoundly evident in demonstrating the down regulation of these catabolic activities.
RA tissue samples undeniably reflected profiles similar to the cell types examined. Active genes observed were IL-3, IL-6, ICE, the MMPs including HME and TIMPs, chemokines IL-8, Groα, MIP, MIF, and RANTES, and the adhesion molecule VCAM. Of the growth factors, fibroblast growth factor β was observed most frequently. In comparison, the expression patterns in the other inflammatory state (i.e., IBD) were not as marked as in the RA samples, at least as obtained from the tissue samples selected for this study.
As an alternative approach, the 1046 cDNA microarray of randomly selected genes from a lymphocyte library was used to identify genes expressed in RA tissue (3). Many genes on this array hybridized with probes made from both RA and IBD tissue samples. The results are not surprising because inflammatory tissue is abundantly supplied with cell types infiltrating from the circulating blood, made apparent also by the high levels of chemokine expression in RA tissue. Because of the magnitude of the effort required to identify all the hybridized genes, we have for this report chosen to describe only three differentially expressed genes mainly to verify this method of analysis.
Of the large number of genes observed here, a fair number were already known as active participants in inflammatory disease. These are TNF, IL-1, IL-6, IL-8, GCSF, RANTES, and VCAM. The novel participants not previously reported are HME, IL-3, ICE, and Groα. With our discovery of HME expression in RA, this gene becomes a target for drug intervention. ICE is a cysteine protease well known for its IL-1β processing activity (18), and recognized for its role in apoptotic cell death (19). Its expression in RA tissue is intriguing. IL-3 is recognized for its growth-promoting activity in hematopoietic cell lineages, is a product of activated T cells (20), and its expression in synoviocytes and chondrocytes of RA tissue is a novel observation.
Like IL-8, Groα, is a C-X-C subgroup chemokine and is a potent neutrophil and basophil chemoattractant. It down-regulates the expression of types I and III interstitial collagens (21, 22) and is seen here produced by the MM6 cells, in primary synoviocytes, and in RA tissue. With the presence of RANTES, MCP, and MIP-1β, the C-C chemokines (23) migration and infiltration of monocytes, particularly T cells, into the tissue is also enhanced (5) and aid in the trafficking and recruitment of leukocytes into the RA tissue. Their activation, phagocytosis, degranulation, and respiratory bursts could be responsible for the induction of MnSOD in RA. MnSOD is also induced by TNF and IL-1 and serves a protective function against oxidative damage. The induction of the ferritin light chain encoding gene in this tissue may be for reasons similar to those for MnSOD. Ferritin is the major intracellular iron storage protein and it is responsive to intracellular oxidative stress and reactive oxygen intermediates generated during inflammation (24, 25). The active expression of TIMP-1 in RA tissue, as detected by the 1000-element array, is no surprise because our results have repeatedly shown TIMP-1 to be expressed in the constitutive and induced states of RA cells and tissues.
The suitability of the cDNA microarray technology for profiling diseases and for identifying disease related genes is well documented here. This technology could provide new targets for drug development and disease therapies, and in doing so allow for improved treatment of chronic diseases that are challenging because of their complexity.
Acknowledgments
We would like to thank the following individuals for their help in obtaining reagents or providing cDNA clones to use as templates in target preparation: N. Arai, P. Cannon, D. R. Cohen, T. Curran, V. Dixit, D. A. Geller, G. I. Goldberg, M. Karin, M. Lotz, L. Matrisian, G. Nolan, C. Lopez-Otin, T. Schall, S. Shapiro, I. Verma, and H. Van Wart. Support for R.W.D., M.S., and R.A.H. was provided by the National Institutes of Health (Grants R37HG00198 and HG00205).
ABBREVIATIONS
- RA
rheumatoid arthritis
- MMP
matrix-degrading metalloproteinase
- IBD
inflammatory bowel disease
- LPS
lipopolysaccharide
- PMA
phorbol 12-myristate 13-acetate
- TNF-α
tumor necrosis factor α
- IL
interleukin
- TGF-β
transforming growth factor β
- GCSF
granulocyte colony-stimulating factor
- MIP
macrophage inflammatory protein
- MIF
migration inhibitory factor
- HME
human matrix metallo-elastase
- RANTES
regulated upon activation, normal T cell expressed and secreted
- Gel
gelatinase
- VCAM
vascular cell adhesion molecule
- ICE
IL-1 converting enzyme
- PUMP
putative metalloproteinase
- MnSOD
manganese superoxide dismutase
- TIMP
tissue inhibitor of metalloproteinase
- MCP
macrophage chemotactic protein
References
- 1.Schena M, Shalon D, Davis R W, Brown P O. Science. 1995;270:467–470. doi: 10.1126/science.270.5235.467. [DOI] [PubMed] [Google Scholar]
- 2.Shalon D, Smith S, Brown P O. Genome Res. 1996;6:639–645. doi: 10.1101/gr.6.7.639. [DOI] [PubMed] [Google Scholar]
- 3.Schena M, Shalon D, Heller R, Chai A, Brown P O, Davis R W. Proc Natl Acad Sci USA. 1996;93:10614–10619. doi: 10.1073/pnas.93.20.10614. [DOI] [PMC free article] [PubMed] [Google Scholar]
- 4.Feldmann M, Brennan F M, Maini R N. Rheumatoid Arthritis Cell. 1996;85:307–310. doi: 10.1016/s0092-8674(00)81109-5. [DOI] [PubMed] [Google Scholar]
- 5.Schall T J. In: The Cytokine Handbook. 2nd Ed. Thomson A W, editor. New York: Academic; 1994. pp. 410–460. [Google Scholar]
- 6.Lotz, M. F., Blanco, J., Von Kempis, J., Dudler, J., Maier, R., Villiger P. M. & Geng, Y. (1995) J. Rheumatol. 22, Supplement 43, 104–108. [PubMed]
- 7.Birkedal-Hansen H, Moore W G I, Bodden M K, Windsor L J, Birkedal-Hansen B, DeCarlo A, Engler J A. Crit Rev Oral Biol Med. 1993;4:197–250. doi: 10.1177/10454411930040020401. [DOI] [PubMed] [Google Scholar]
- 8.Zeigler-Heitbrock H W L, Thiel E, Futterer A, Volker H, Wirtz A, Reithmuller G. Int J Cancer. 1988;41:456–461. doi: 10.1002/ijc.2910410324. [DOI] [PubMed] [Google Scholar]
- 9.Borden P, Solymar D, Sucharczuk A, Lindman B, Cannon P, Heller R A. J Biol Chem. 1996;271:23577–23581. doi: 10.1074/jbc.271.38.23577. [DOI] [PubMed] [Google Scholar]
- 10.Gadher S J, Woolley D E. Rheumatol Int. 1987;7:13–22. doi: 10.1007/BF00267337. [DOI] [PubMed] [Google Scholar]
- 11.Harris E D., Jr New Engl J Med. 1990;322:1277–1289. doi: 10.1056/NEJM199005033221805. [DOI] [PubMed] [Google Scholar]
- 12.Firestein G S. In: Textbook of Rheumatology. 5th Ed. Kelly W N, Harris E D, Ruddy S, Sledge C B, editors. Philadelphia: Saunders; 1996. pp. 5001–5047. [Google Scholar]
- 13.Alvaro-Garcia J M, Zvaifler, Nathan J, Brown C B, Kaushansky K, Firestein Gary S. J Immunol. 1991;146:3365–3371. [PubMed] [Google Scholar]
- 14.Firestein G S, Alvaro-Grarcia J M, Maki R. J Immunol. 1990;144:3347–3352. [PubMed] [Google Scholar]
- 15.Pradines-Figueres A, Raetz C R H. J Biol Chem. 1992;267:23261–23268. [PubMed] [Google Scholar]
- 16.Shapiro S D, Kobayashi D L, Ley T J. J Biol Chem. 1993;208:23824–23829. [PubMed] [Google Scholar]
- 17.Shipley M J, Wesselschmidt R L, Kobayashi D K, Ley T J, Shapiro S D. Proc Natl Acad Sci USA. 1996;93:3042–3946. doi: 10.1073/pnas.93.9.3942. [DOI] [PMC free article] [PubMed] [Google Scholar]
- 18.Cerreti D P, Kozlosky C J, Mosley B, Nelson N, Van Ness K, Greenstreet T A, March C J, Kronheim S R, Druck T, Cannizaro L A, Huebner K, Black R A. Science. 1992;256:97–100. doi: 10.1126/science.1373520. [DOI] [PubMed] [Google Scholar]
- 19.Miura M, Zhu H, Rotello R, Hartweig E A, Yuan J. Cell. 1993;75:653–660. doi: 10.1016/0092-8674(93)90486-a. [DOI] [PubMed] [Google Scholar]
- 20.Arai K, Lee F, Miyajima A, Shoichiro M, Arai N, Takashi Y. Annu Rev Biochem. 1990;59:783–836. doi: 10.1146/annurev.bi.59.070190.004031. [DOI] [PubMed] [Google Scholar]
- 21.Geiser T, Dewald B, Ehrengruber M U, Lewis I C, Baggiolini M. J Biol Chem. 1993;268:15419–15424. [PubMed] [Google Scholar]
- 22.Unemori E N, Amento E P, Bauer E A, Horuk R. J Biol Chem. 1993;268:1338–1342. [PubMed] [Google Scholar]
- 23.Robinson E, Keystone E C, Schall T J, Gillet N, Fish E N. Clin Exp Immunol. 1995;101:398–407. doi: 10.1111/j.1365-2249.1995.tb03126.x. [DOI] [PMC free article] [PubMed] [Google Scholar]
- 24.Roeser H. In: Iron Metabolism in Biochemistry and Medicine. Jacobs A, Worwood M, editors. Vol. 2. New York: Academic; 1980. pp. 605–640. [Google Scholar]
- 25.Kwak E L, Larochelle D A, Beaumont C, Torti S V, Torti F M. J Biol Chem. 1995;270:15285–15293. doi: 10.1074/jbc.270.25.15285. [DOI] [PubMed] [Google Scholar]


