Abstract
To test whether human GATA-1 (hGATA-1) is involved in the transcriptional control of globin gene switching, we produced transgenic mice overexpressing hGATA-1, crossed them with mice carrying a human β-globin locus yeast artificial chromosome (βYAC), and analyzed globin gene expression in their progeny. Mice carrying both the hGATA-1 and the βYAC transgenes had normal levels of γ- and β-globin mRNA and no distortion in the rate or in the timing of γ-to-β switch, indicating that hGATA-1 is not involved in the developmental control of γ- and β-globin genes. In contrast, mice carrying the hGATA-1 and the βYAC transgenes had 5- to 6-fold lower expression of the human ɛ globin gene compared with βYAC mice lacking the hGATA-1 transgene. These results provide direct in vivo evidence that hGATA-1 is a specific repressor of human ɛ gene expression. Our findings also suggest that binary transgenic mouse systems based on overexpression of transcriptional factors can be used to investigate the trans control of human globin gene switching. Systems as the one we describe here should be useful in the study of any developmentally controlled human gene for which transgenic mice are available.
The β-globin gene locus consists of five transcribed genes, ɛ, Gγ, Aγ, δ, β, and a regulatory element, the locus control region (LCR), located 6–20 kb upstream of the ɛ gene (1). Globin gene expression changes during development from embryonic ɛ in the yolk sac to Gγ and Aγ in the fetus and to exclusive β gene expression in the adult. Studies of the control of globin gene switching have used transgenic mice carrying recombinants in which the human globin genes have been linked to sequences of the LCR (1). Previous work in transgenic mice using a 3.7-kb fragment of the human ɛ globin gene have shown that ɛ gene expression is totally restricted in embryonic cells and it is absent in the cells of the definitive erythropoiesis, indicating that the ɛ gene sequence used for production of the transgenic animals contained all the information required for ɛ gene silencing (2, 3). Transgenic mice carrying constructs in which γ gene coding sequences were linked to the ɛ gene promoter demonstrated that all the information required for ɛ gene silencing resides in the ɛ gene promoter (3, 4). A sequence located between positions −177 and −392 of the ɛ gene promoter has been shown by transient assays to exhibit properties of a transcriptional silencer (5). Deletion of this sequence resulted in continuation of ɛ gene expression in adult transgenic mice, providing evidence that it acts as a silencer in vivo (6). Subsequent studies showed that GATA-1 and YY1 motifs contained in this sequence are involved in the switch-off of the ɛ gene (7).
The studies described in this paper examine whether overexpression of human GATA-1 (hGATA-1) can modulate human globin gene expression in transgenic mice carrying a human β-globin locus yeast artificial chromosome (βYAC). We wished to know whether GATA-1 overexpression will suppress ɛ gene expression and whether it will affect the γ- to β-globin gene switch. We found that GATA-1 overexpression does not affect the expression of the γ- or the β-globin genes or the rate or the timing of the γ-to-β gene switch. In contrast, GATA-1 overexpression results in a striking repression of the human ɛ globin gene in embryonic cells. These results provide direct in vivo evidence that GATA-1 acts as an ɛ gene repressor and suggest that binary transgenic mice systems based on transcription factor overexpression can be used to detect the erythroid-specific or ubiquitous transcription factors that contribute to the developmental control of globin genes.
MATERIALS AND METHODS
Construction of hGATA-1 Expression Plasmid.
A 3.7-kb SnaBI/BglII fragment containing the human β-globin gene was cloned in a pUC18 vector. The hGATA-1 cDNA was released from plasmid pMT2PCX (a gift from David Martin, Fred Hutchinson Cancer Research Center, Seattle), with sequential digestions with EcoRI (which was made blunt-ended) and NcoI. This fragment was ligated into the β plasmid digested with NcoI and PmlI (which was made blunt-ended). The hybrid gene with β promoter and GATA-1 coding sequences is in correct reading frame because the initial codons in both genes are located in the NcoI recognition sites. The final construct was completed by digesting the hybrid gene with ScaI and Asp718I and ligating it to a new μLCR plasmid restricted with the same enzymes. The new μLCR was modified from a previously published μLCR (8) by extending the DNA sequence 5′ to HS4 site of the original μLCR by 0.6 kb. This new μLCR construct contains the major and minor DNase I-hypersensitive sites of HS1, HS2, HS3, and HS4. The new μLCRβprGATA-1 DNA was purified from plasmid vector after NotI and SphI double digestion and used for microinjection of fertilized oocytes.
Transgenic Mice.
Transgenic mice carrying the hGATA-1 expression construct were produced as previously described (9). Transgenic mice carrying a βYAC have been described in a previous publication (10). hGATA-1 male transgenic mice were bred with female transgenics carrying the βYAC. Offspring doubly hemizygous for hGATA-1 and a human globin transgene as well as offspring carrying the human globin transgene but lacking the hGATA-1 transgene were identified by Southern blotting. In all the studies described in this paper, double hemizygous transgenic animals were compared with single hemizygous transgenic animals of the same litter. To study the effects of GATA-1 on globin gene expression, staged pregnancies were interrupted at days 9, 10, 11, 12, 13, and 16 of development. Samples from blood and yolk sac from embryos at days 9 and 10 and blood and liver from fetuses at days 11, 12, 13, and 16 were collected. At least three double hemizygous embryos or fetuses and at least three single hemizygous controls were collected in each of the above stated days of development from each line. Embryos from matings of a hGATA-1 hemizygous male with three different βYAC transgenic lines (designated later as lines A, B, and C) were analyzed.
RNA Isolation and Globin RNase Protection Assays.
Total RNA isolation from transgenic tissues and RNase protection assays were performed as described before (11). RNA probes for the human β and γ mRNAs and for murine α and ζ mRNAs were described previously (9). A human ɛ probe, pT7Hɛ(188), was constructed as follows. A point mutation was introduced by PCR in the exon 2 of human ɛ-globin gene, which created a PmlI restriction site. The mutated gene was cut with PmlI and HpaII and cloned into a ClaI/PvuII-linearized pSP73. This probe produced a 188-bp protected fragment from ɛ gene exon 2. The mouse βh1 probe was described by Chada et al. (12), and the mouse ɛy probe was described by Baron and Maniatis (13). The level of human and murine globin gene expression was quantitated by a PhosphorImager (Molecular Dynamics). To correct for experimental variation and differences in copy numbers between the transgenic lines, levels of human globin gene mRNA were expressed as percent of murine α mRNA after correction for number of human transgenes and murine endogenous genes.
Detection of hGATA-1 mRNA.
Reverse transcription–PCR assay. Expression of the hGATA-1 gene in transgenic mice was detected by reverse transcription–PCR. Total RNA was isolated from yolk sac, fetal liver, and adult blood as described. One microgram of total RNA was reverse-transcribed with Moloney murine leukemia virus transcriptase (GIBCO/BRL) using a GATA-1 3′ oligomer (5′-TAGAGGCCGCAGGCATTG-3′) as a primer. Since this exactly identical sequence is present in the exon 5 of both the hGATA-1 and mGATA-1 genes, the two GATA-1 cDNAs were produced simultaneously. Five microliters of cDNA products was amplified by PCR with Taq DNA polymerase (Perkin–Elmer). [α-32P]dCTP was included in PCR to radioactively label the products. Two primers were used: the 3′ GATA-1 oligomer described above and a 5′ GATA-1 oligomer (5′-CTCATCCGGCCCAAGAAGC-3′). The sequence of the 5′ GATA-1 oligomer is identical in both the human and mouse genes and it is located in the exon 4 of the GATA-1 genes. The use of one set of primers and amplification of the same length mRNA assured production of comparable yields from two different templates. The ratio of hGATA-1 over murine GATA-1 (mGATA-1) PCR products was in linear range when fewer than 34 amplifying cycles were used (the ratio of hGATA-1 over mGATA-1 was 0.765 at cycle 28, 0.777 at cycle 30, 0.714 at cycle 32, and 0.752 at cycle 34, respectively). Thirty cycles were applied in all experiments. To distinguish between the hGATA-1 and mGATA-1 homoduplexes from the heteroduplex that may be formed from the human and mouse PCR products, double digestion with BamHI and BsmI was performed. BamHI cuts only the human PCR products, yielding a 107-bp fragment; BsmI only cuts the mouse PCR products, yielding a 97-bp fragment; and neither of them cuts the heteroduplex, which is retained as a 134-bp fragment. The digested PCR products were fractionated by electrophoresis in a 6% polyacrylamide gel. Signals were quantitated by a PhosphorImager. The human-to-mouse GATA-1 ratio was calculated using the following formula, assuming that one-half of the heteroduplex consists of hGATA-1 and the other half consists of mGATA-1: ratio (human/mouse) = (A + C/2)/(B + C/2), where A is the human homoduplex signal, B is the mouse homoduplex signal, and C is the human/mouse heteroduplex signal.
RNase protection.
The RNA probe for the mGATA-1 mRNA was a gift from S. H. Orkin (Harvard Medical School, Boston). Since the hGATA-1 mRNA was transcribed from the human β-globin promoter, a new probe was made that covered 50-bp β promoter (from the cap site to the initiation codon) and 199-bp GATA sequence (from the initiation codon to StuI site). The same RNase protection procedure was applied as in the globin mRNA measurements, except that the hybridization temperature was 52°C instead of 48°C.
RESULTS
Transgenic Mice Overexpressing the hGATA-1.
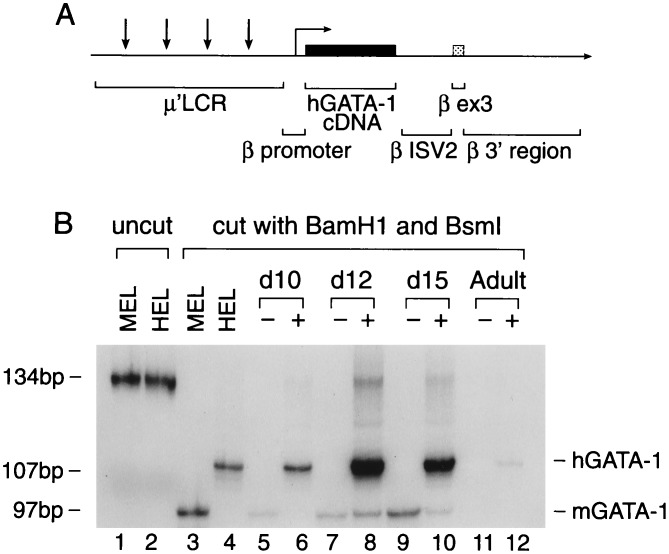
The hGATA-1 construct used for production of transgenic mice is shown in Fig. 1A. It contains the hGATA-1 cDNA driven by the β-globin gene promoter and a 3.1-kb μLCR sequence. This new μLCR cassette contains the major DNase I-hypersensitive sites 1, 2, 3, and 4, including the HS4 core sequences missing from a 2.5-kb μLCR construct (8) we have used in previous studies. Based on our experience with the μLCRβ transgenic mice (14), we used the combination of μLCR and β gene promoter to guarantee high hGATA-1 expression in definitive as well as embryonic erythroid cells. Thirteen hGATA-1 founders were produced, but only three transmitted the hGATA-1 transgene to their progeny. One line carrying four copies of the hGATA-1 transgene was used for studies of hGATA-1 expression in F2 progeny.
Figure 1.
hGATA-1 cDNA expression in transgenic mice. (A) The hGATA-1 cDNA (solid box) is driven by a 267-bp human β-globin promoter placed downstream from a 3.1-kb new μLCR (shown as μ′LCR). The 3′ end of the hGATA-1 cDNA is linked to intron 2, exon 3, and the 3′ enhancer of the β-globin gene. Vertical arrows show the position of the four DNase I-hypersensitive sites of the LCR. (B) Expression of hGATA-1 cDNA in transgenic mice detected by reverse transcription–PCR. RNA was isolated from the yolk sac, fetal liver, and adult blood samples of transgenic animals. After reverse transcription, the cDNA were amplified by PCR using a set of primers that perfectly hybridized with both mGATA-1 and hGATA-1 cDNA. The PCR products from the mGATA-1 and hGATA-1 amplification were identical in length (134 bp), but they could be discriminated by BamHI restriction, which yielded a 107-bp fragment from the hGATA-1, and BsmI restriction, which yielded a 97-bp from the mGATA-1.
RNase protection assays on fetal liver-derived RNA disclosed the expected fragments for hGATA-1 and mGATA-1, but expression was weak, not allowing quantitative determinations. For this reason we applied the reverse transcription–PCR assay described in Materials and Methods to measure the ratio of hGATA-1 mRNA to mGATA-1 mRNA in several embryos and fetuses. The hGATA-1:mGATA-1 ratio in the 10-day yolk sac was 13.3 ± 2.1, while it was 9.41 ± 1.18 and 11.64 ± 1.36 in the day 12 and day 15 fetal liver samples, respectively. We could not detect mGATA-1 mRNA in the adult red cells; however, hGATA-1 mRNA was present in the red cells of the adult transgenics, although its level was lower than the level in fetuses and embryos.
Overexpression of hGATA-1 Represses Human ɛ Gene Expression.
To investigate the effect of hGATA-1 overexpression on human globin gene expression, male hGATA-1 mice were mated with females carrying βYAC. Dated pregnancies were arranged, and the expression of globin genes was analyzed daily from gestational day 9 to 16. The pattern of developmental expression of the human globin genes in mice carrying the βYAC but not the hGATA-1 transgene was compared with globin gene expression in mice that had inherited the βYAC transgene as well as the hGATA-1 transgene.
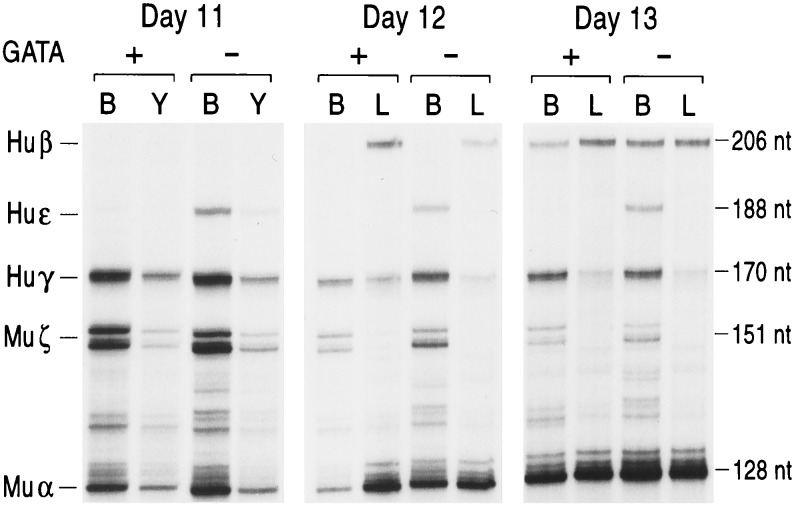
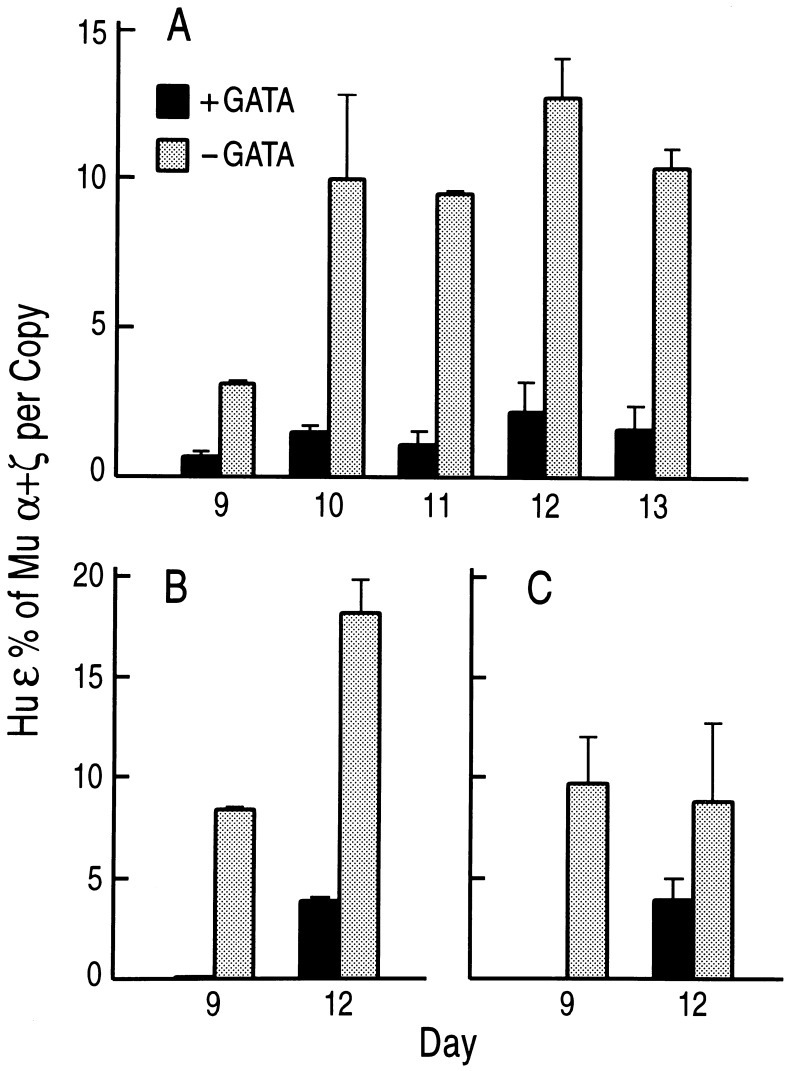
Results of RNase protection are shown in Fig. 2, while in Fig. 3, the levels of human ɛ mRNA are expressed as percent of murine α+ζ mRNA, corrected per copy of transgene and copy of the endogenous α plus ζ gene.
Figure 2.
Human globin gene expression in βYAC fetuses also carrying a hGATA-1 transgene (+) or lacking a hGATA-1 transgene (−). Expression of the human ɛ, γ, and β genes measured by quantitative RNase protection assay. The results shown here are from the βYAC line A bred with a mouse carrying four copies of the hGATA-1 construct. Similar results were obtained with βYAC transgenic lines B and C. Lanes: B, blood; Y, yolk sac; L, liver. The protected fragment sizes are 206 bp for human β mRNA, 170 bp for γ mRNA, and 188 bp for human ɛ mRNA. Murine (Mu) α and ζ mRNAs are internal controls. hGATA-1-positive or -negative animals in a litter were identified by Southern blot hybridization.
Figure 3.
Comparison of human ɛ gene expression in βYAC mice carrying or lacking the hGATA-1 transgene. The solid columns represent expression of the human ɛ gene in hGATA(+) mice, the hatched columns show ɛ expression in hGATA(−) mice. Gestational ages are shown on the horizontal axis. Human ɛ mRNA level is expressed as a percentage of the murine α plus ζ mRNA (both human and murine mRNA expression was corrected for copy number). Each column represents the mean of mRNA quantitations of several fetuses; the bars in each column indicate standard deviations. (A–C) Results from the mating of hGATA-1 mice with mice from the βYAC lines A–C, respectively.
The levels of human ɛ mRNA in yolk sac cells and embryonic blood of βYAC mice change during development so that the lowest values are observed in the 9-day yolk sac cells, and the highest values are observed in the 12- to 13-day yolk sac and peripheral blood. Depending on the age of the embryo, the level of human ɛ mRNA in βYAC embryos ranges from 4–5% to 15–25% of murine α+ζ. As shown in Figs. 2 and 3, all the βYAC embryos and fetuses carrying the hGATA-1 transgene had strikingly lower ɛ gene expression compared with their βYAC littermates, which did not have a hGATA-1 transgene. In line A, the level of ɛ mRNA in the day 9 hGATA-1 embryos was only 20% of the level of mRNA in their littermates lacking the hGATA-1 transgene. The level of ɛ mRNA in the days 10–13 βYAC embryos carrying the hGATA-1 transgene ranged from 15 to 20% of the level in their littermates lacking the hGATA-1 transgene. In lines B and C, the day 9 embryos carrying the hGATA-1 transgene had barely detectable human ɛ mRNA (Fig. 3). These results provide direct in vivo evidence that GATA-1 is a repressor of human ɛ gene expression.
hGATA-1 Overexpression Does Not Repress the Murine Embryonic Globin Genes.
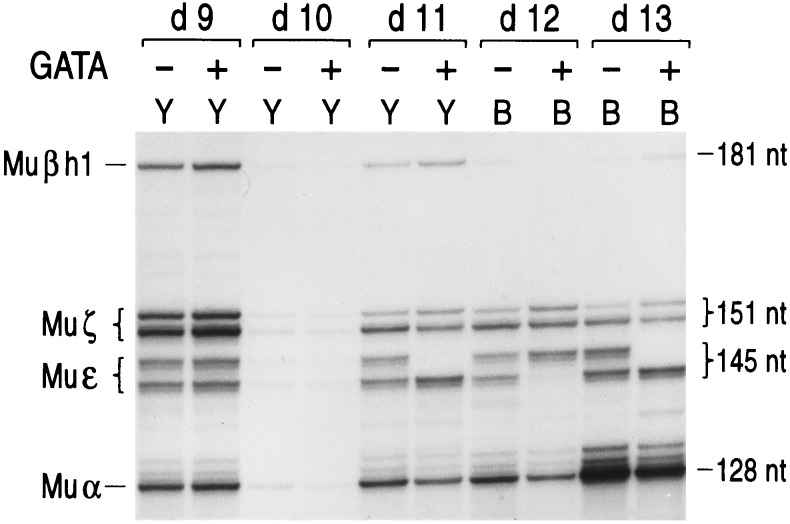
Probes detecting the murine ɛ, βh1, βmin, and βmaj mRNA species were used to examine the effect of hGATA-1 on murine globin gene expression. As shown in Fig. 4, there was no difference in the expression of the murine embryonic α, ζ, ɛy, and βh1 genes between mice carrying the hGATA-1 transgene or lacking this transgene. No difference was detected in the murine β gene expression between hGATA-1-positive and -negative littermates (data not shown).
Figure 4.
Murine globin gene expression in hGATA(+) and hGATA(−) mice. Expression of murine βh1, ζ, ɛ, and α globin gene is measured by RNase protection. The protected fragment sizes are 181 bp for βh1 mRNA; 151 bp for ζ mRNA; 145 bp for ɛ mRNA; and 128 bp for mRNA. Notice that there is no difference in expression of ɛy, βh1, βmaj, or βmin mRNA between hGATA(+) and hGATA(−) littermates. The mouse ɛy probe detects two bands in some mice and only one in others because the mouse strains used have two alleles of the ɛy gene that are transcribed at different cap sites.
hGATA-1 Overexpression Does Not Affect γ or β-Globin Gene Expression or the γ-to-β Switch.
In βYAC mice, the human β gene (like the murine β major and β minor genes) is expressed only after the definitive stage of erythropoiesis starts in the liver of the 11-day embryos. The γ genes, like their orthologue, the murine embryonic gene βh1, are expressed during the yolk sac erythropoiesis; however, unlike the murine βh1 gene, γ gene expression continues in the fetal liver erythropoiesis and switches off around birth.
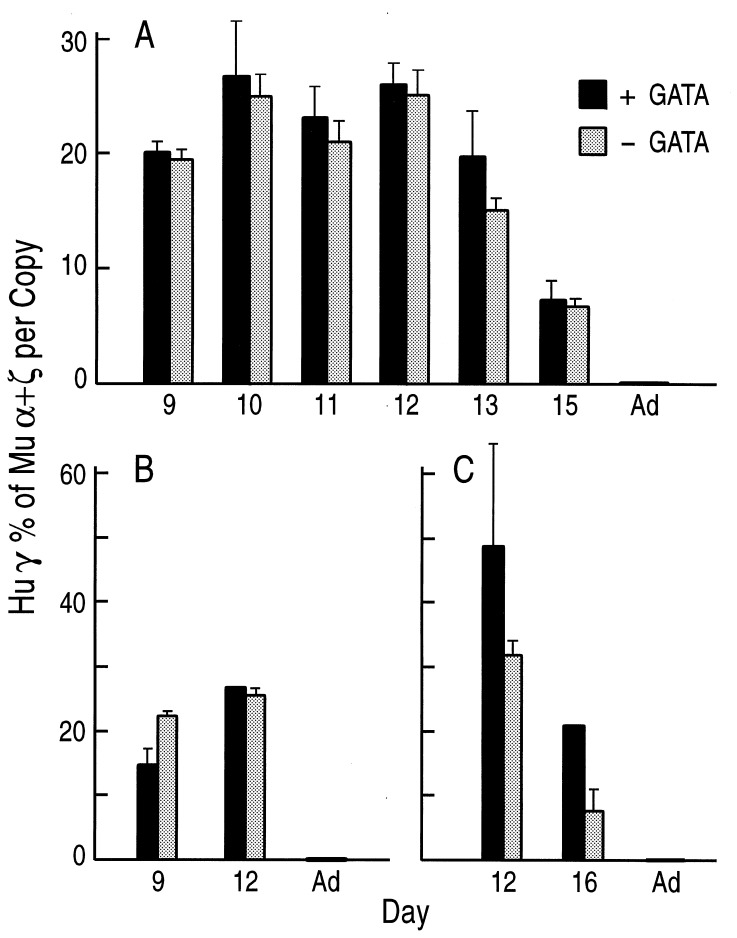
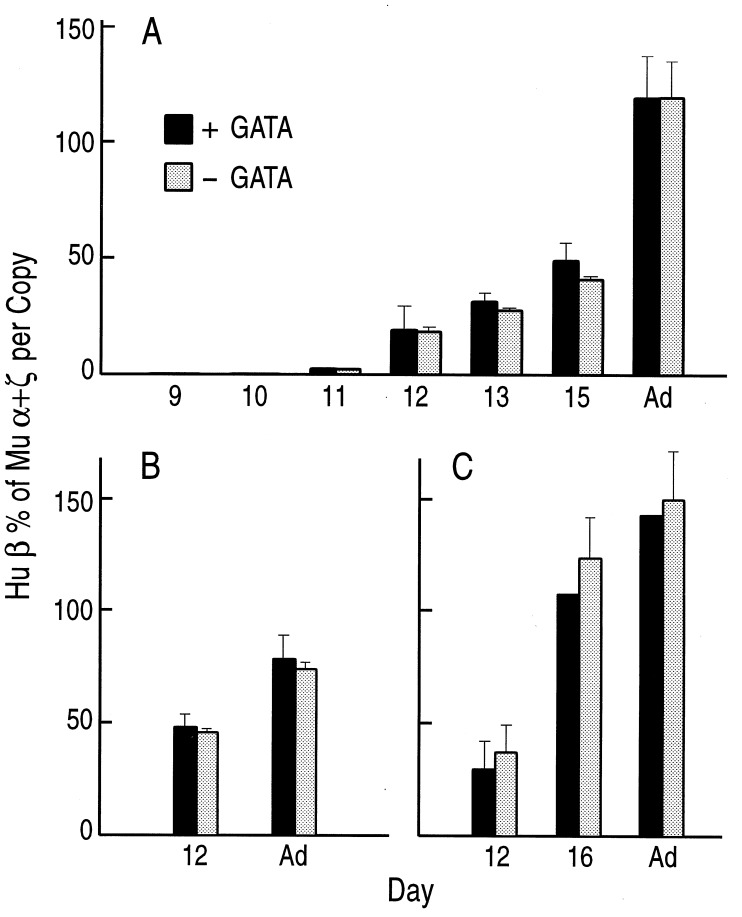
As shown in Figs. 2, 5, and 6, γ and β-globin mRNA levels in βYAC mice carrying the hGATA-1 transgene displayed the expected, for βYAC transgenic mice, developmental patterns. Furthermore, no significant quantitative differences in γ or β gene expression were detected between βYAC mice carrying or lacking the hGATA-1 transgenes. In all lines, γ gene expression follows the expected developmental pattern—i.e., it is highest in the 10–12 days of development, it declines thereafter, and it is extinguished in the adult (Fig. 5). γ mRNA levels were slightly higher in the embryos and fetuses carrying the hGATA-1 transgene compared with their littermates lacking the transgene (Fig. 5); however, these differences were not statistically significant. In all embryos and fetuses we analyzed there was essentially no differences in the level of β mRNA between the βYAC mice carrying the hGATA-1 transgene or lacking the transgene (Figs. 2 and 6). These results indicate that hGATA-1 overexpression does not affect the developmental pattern of γ or β-globin genes or the γ-to-β switch.
Figure 5.
Comparison of human γ gene expression in hGATA(+) (solid column) and hGATA(−) (stippled column) βYAC transgenic littermates. (A–C) Results of mating of the same hGATA-1 male with females of βYAC lines A–C, respectively. Notice that there are no differences in γ gene expression between hGATA(+) and hGATA(−) embryos or fetuses.
Figure 6.
Comparison of human β gene expression in hGATA(+) (solid column) and hGATA(−) (stippled column) βYAC transgenic littermates. (A–C) Results of matings of a hGATA-1 male with females of βYAC lines A–C, respectively. Notice that there is no difference in human β gene expression between hGATA(+)and hGATA(−) littermates.
DISCUSSION
It is generally assumed that changes in the transcriptional milieu of erythroid cells bring about the switch from embryonic to fetal to adult globin gene expression during ontogeny. However, little is known about the factors that contribute to these developmental stage-specific transcriptional environments. Recently, EKLF has been identified as a transcriptional factor (15) that is required for β-globin gene activation in the adult stage of erythropoiesis (16, 17). Whether transcriptional factors that play a dominant role in the activation of ɛ and γ globin genes exist, remains unknown. It has been suggested that the developmental stage specificity of transcriptional environments is defined by the relative abundance of erythroid-specific and constitutive transcriptional factors (18–21). Evidence in support of this hypothesis has been obtained from studies of human ɛ gene silencing in transgenic mice (7). A sequence located between positions −177 and −392 of the human ɛ gene promoter contains a silencer (5), the deletion of which results in continuation of ɛ gene expression in adult transgenic mice (6). Three transcriptional factors, GATA-1, YY1, and a SP-1-like protein, interact with structural motifs located in this silencer (7, 22). Studies in transgenic mice carrying constructs with ɛ promoter mutations abolishing binding of these factors in their motifs contained in the silencer, have shown that GATA-1 acts as ɛ gene repressor when it binds to position −208ɛ but not when it binds to a GATA motif located in position −163ɛ or to the two GATA motifs flanking position −269ɛ; YY1 is a strong ɛ gene repressor when it binds to a YY1 motif at position −269ɛ while the SP1-like protein binding at −379ɛ acts as a weak ɛ gene repressor (7). In addition to providing evidence in support of the combinatorial nature of ɛ gene silencing, this study also revealed the major difficulty of the analysis of the role of transcriptional factors on globin gene switching: a factor like GATA-1 can act either as a repressor or as an activator, depending on the location of the transcriptional motif on which it binds. Therefore, the in vivo testing of the effects of transcriptional factors that have multiple motifs spread along the flanking sequences of all the globin genes (such as GATA-1, YY1, or SP1) requires production of a large number of globin gene mutants and expression studies of these mutants in transgenic mice. Alternative methods that will allow a survey of the effect of a transcriptional factor on the overall process of globin gene switching and on the quantitative expression of each globin gene in the embryo, the fetus, and the adult are required.
The work described in this paper shows that a transgenic binary system based on transcriptional factor overexpression can be used for that purpose. We show that by analyzing globin gene expression during the development of the hGATA-1/βYAC doubly hemizygous transgenic mice, we can assess the effect of GATA-1 on the expression of human globin genes in all stages of ontogeny. We found that hGATA-1 overexpression has no effect on the level of γ or β genes or on the rate or on the timing of the γ-to-β gene switch. Since there is no γ gene repression, a previous suggestion (23), subsequently retracted (24), that GATA-1 is a γ gene repressor appears to be unlikely. The only effect of GATA-1 was ɛ gene repression. It is obvious that similar binary transgenic systems can be used in the analysis of the effects on globin gene switching of any other erythroid specific or ubiquitous transcriptional factor. Previous studies have shown that expression of transgenes containing the LCR and a β- or a γ-globin gene promoter are expressed only in the cells of the erythroid lineage (25–30). Overexpression of transcriptional factors can therefore be limited to the cells of the erythroid lineage diminishing the possibility of deleterious effects on the embryonic development of transgenic mice. Although our studies focus on the control of globin genes, it is obvious that binary systems of the type we describe here will be useful in the analysis of any developmentally regulated human gene for which transgenic mice are available.
While hGATA-1 overexpression severely suppresses human ɛ gene expression, it does not affect the expression of the murine ɛy embryonic gene. This discrepancy can be explained by the differences in the sequence of human ɛ and human ɛy promoters. These two promoters differ significantly in the sequences corresponding to the human ɛ gene silencer. Specifically, the ɛy gene lacks the GATA motif at −208ɛ and the YY1 motif at −269ɛ—i.e., two motifs involved in human ɛ gene silencing (7). Apparently the −177 to −392 ɛ gene silencer is a rather recent evolutionary addition to the mechanism that controls the switch-off of the ɛ globin gene. Recent evidence obtained using transgenic mice carrying ɛ gene promoter truncations indicates that, in addition to the −177 and −392ɛ gene sequence, sequences located 3′ to position −177ɛ—i.e., in the proximal ɛ gene promoter—are required for ɛ gene silencing (Q.L., C.C., and G.S., unpublished work). These proximal sequences perhaps play the major role in the silencing of the murine ɛy gene.
Acknowledgments
These studies were supported by National Institutes of Health Grants DK45365, HL20899, and HL53750.
ABBREVIATIONS
- LCR
locus control region
- βYAC
human β-globin locus yeast artificial chromosome
- hGATA-1 and mGATA-1
human and murine GATA-1, respectively
References
- 1.Stamatoyannopoulos G, Nienhuis A W. In: Molecular Basis of Blood Diseases. Stamatoyannopoulos G, Nienhuis A W, Majerus P, Varmus H, editors. Vol. 2. Philadelphia: Saunders; 1994. pp. 107–155. [Google Scholar]
- 2.Raich N, Enver T, Nakamoto B, Josephson B, Papayannopoulou T, Stamatoyannopoulos G. Science. 1990;250:1147–1149. doi: 10.1126/science.2251502. [DOI] [PubMed] [Google Scholar]
- 3.Shih D M, Wall R J, Shapiro S G. Nucleic Acids Res. 1990;18:5465–5472. doi: 10.1093/nar/18.18.5465. [DOI] [PMC free article] [PubMed] [Google Scholar]
- 4.Shih D M, Wall R J, Shapiro S G. J Biol Chem. 1993;268:3066–3071. [PubMed] [Google Scholar]
- 5.Cao S X, Gutman P D, Dave H P G, Schechter A N. Proc Natl Acad Sci USA. 1989;86:5306–5309. doi: 10.1073/pnas.86.14.5306. [DOI] [PMC free article] [PubMed] [Google Scholar]
- 6.Raich N, Papayannopoulou T, Stamatoyannopoulos G, Enver T. Blood. 1992;79:861–864. [PubMed] [Google Scholar]
- 7.Raich N, Clegg C H, Grofti J, Romeo P, Stamatoyannopoulos G. EMBO J. 1995;14:801–809. doi: 10.1002/j.1460-2075.1995.tb07058.x. [DOI] [PMC free article] [PubMed] [Google Scholar]
- 8.Forrester W C, Novak U, Gelinas R, Groudine M. Proc Natl Acad Sci USA. 1989;86:5439–5443. doi: 10.1073/pnas.86.14.5439. [DOI] [PMC free article] [PubMed] [Google Scholar]
- 9.Li Q, Stamatoyannopoulos J A. Mol Cell Biol. 1994;14:6087–6096. doi: 10.1128/mcb.14.9.6087. [DOI] [PMC free article] [PubMed] [Google Scholar]
- 10.Peterson K R, Clegg C H, Huxley C, Josephson B M, Haugen H S, Furukawa T, Stamatoyannopoulos G. Proc Natl Acad Sci USA. 1993;90:7593–7597. doi: 10.1073/pnas.90.16.7593. [DOI] [PMC free article] [PubMed] [Google Scholar]
- 11.Stamatoyannopoulos G, Josephson B, Zhang J, Li Q. Mol Cell Biol. 1993;13:7636–7644. doi: 10.1128/mcb.13.12.7636. [DOI] [PMC free article] [PubMed] [Google Scholar]
- 12.Chada K, Magram J, Costantini F. Nature (London) 1986;319:685–689. doi: 10.1038/319685a0. [DOI] [PubMed] [Google Scholar]
- 13.Baron M H, Maniatis T. Cell. 1986;46:591–602. doi: 10.1016/0092-8674(86)90885-8. [DOI] [PubMed] [Google Scholar]
- 14.Enver T, Raich N, Ebens A J, Papayannopoulou T, Costantini F, Stamatoyannopoulos G. Nature (London) 1990;344:309–313. doi: 10.1038/344309a0. [DOI] [PubMed] [Google Scholar]
- 15.Miller I J, Bieker J J. Mol Cell Biol. 1993;13:2776–2786. doi: 10.1128/mcb.13.5.2776. [DOI] [PMC free article] [PubMed] [Google Scholar]
- 16.Nuez B, Michalovich D, Bygrave A, Ploemacher R, Grosveld F. Nature (London) 1995;375:316–318. doi: 10.1038/375316a0. [DOI] [PubMed] [Google Scholar]
- 17.Perkins A C, Sharpe A H, Orkin S H. Nature (London) 1995;375:318–322. doi: 10.1038/375318a0. [DOI] [PubMed] [Google Scholar]
- 18.Minie M, Clark D, Trainor C, Evans T, Reitman M, Hannon R, Gould H, Felsenfeld G. J Cell Sci. 1992;16:15–20. doi: 10.1242/jcs.1992.supplement_16.3. [DOI] [PubMed] [Google Scholar]
- 19.Minie M E, Kimura T, Felsenfeld G. Development (Cambridge, UK) 1992;115:1149–1164. doi: 10.1242/dev.115.4.1149. [DOI] [PubMed] [Google Scholar]
- 20.Whitelaw E, Tsai S-F, Hogben P, Orkin S H. Mol Cell Biol. 1990;10:6596–6606. doi: 10.1128/mcb.10.12.6596. [DOI] [PMC free article] [PubMed] [Google Scholar]
- 21.Orkin S H. Eur J Biochem. 1995;231:271–281. doi: 10.1111/j.1432-1033.1995.tb20697.x. [DOI] [PubMed] [Google Scholar]
- 22.Peters B, Merezhinskaya N, Diffley J F X, Noguchi C T. J Biol Chem. 1993;268:3430–3437. [PubMed] [Google Scholar]
- 23.Berry M, Grosveld F, Dillon N. Nature (London) 1992;358:499–502. doi: 10.1038/358499a0. [DOI] [PubMed] [Google Scholar]
- 24.Ronchi A, Berry M, Raguz S, Imam A, Yannoutsos N, Ottolenghi S, Grosveld F, Dillon N. EMBO J. 1996;15:143–149. [PMC free article] [PubMed] [Google Scholar]
- 25.Grosveld F, van Assendelft G B, Greaves D R, Kollias G. Cell. 1987;51:975–985. doi: 10.1016/0092-8674(87)90584-8. [DOI] [PubMed] [Google Scholar]
- 26.van Assendelft G B, Hanscombe O, Grosveld F, Greaves D R. Cell. 1989;56:969–977. doi: 10.1016/0092-8674(89)90630-2. [DOI] [PubMed] [Google Scholar]
- 27.Ryan T M, Behringer R R, Martin N C, Townes T M, Palmiter R D, Brinster R L. Genes Dev. 1989;3:314–323. doi: 10.1101/gad.3.3.314. [DOI] [PubMed] [Google Scholar]
- 28.Curtin P T, Liu D, Liu W, Chang J C, Kan Y W. Proc Natl Acad Sci USA. 1989;86:7082–7086. doi: 10.1073/pnas.86.18.7082. [DOI] [PMC free article] [PubMed] [Google Scholar]
- 29.Enver T, Ebens A J, Forrester W C, Stamatoyannopoulos G. Dev Biol. 1989;86:7033–7037. doi: 10.1073/pnas.86.18.7033. [DOI] [PMC free article] [PubMed] [Google Scholar]
- 30.Morley B J, Abbott C A, Sharpe J A, Lida J, Chan-Thomas P S, Wood W G. Mol Cell Biol. 1992;12:2057–2066. doi: 10.1128/mcb.12.5.2057. [DOI] [PMC free article] [PubMed] [Google Scholar]


