Abstract
The sequencing of the complete genome of M. tuberculosis H37Rv has resulted in the recognition of four mce operons in its genome by in silico analysis. In an attempt to understand the significance of the redundancy of mce operons, we analyzed the expression profile of mce operons after different periods of growth in culture as well as during in vivo infection. Our results strongly suggest that mce1 is expressed as a polycistronic message. In culture from day 8 to day 12, expression of only mce1 was observed, but as the cultures progress towards stationary phase the expression profile of mce operons was altered; the transcripts of the mce1 operon were barely detected while those of the mce4 operon were prominent. In an analysis of the expression of mce operons in tubercle material collected from infected animal tissues, we detected the expression of mce1, -3 and -4. Our results imply that mce operons other than mce1 are also expressed during infection and that it is necessary to examine their role in pathogenesis.
Infection by Mycobacterium tuberculosis is a major health problem worldwide. The entry and survival of the pathogen in the host cell are crucial steps in pathogenesis. Arruda et al. (1) identified a DNA fragment of 450 bp from M. tuberculosis H37Ra that conferred the ability on nonpathogenic Escherichia coli to enter mammalian cells and survive. They designated this gene mce1 (for “mammalian cell entry locus”). Subsequently, Parker et al. (9) showed the presence of a similar gene in Mycobacterium avium, Mycobacterium intracellulare, and Mycobacterium scrofulaceum by PCR approach. Since the delineation of the complete genome sequence of M. tuberculosis H37Rv, four mce operons, designated mce1 to mce4, having similar organization and containing the 450-bp core sequence were identified (3). Subsequently, the presence of mce1 was also detected in Mycobacterium leprae, while all the mce operons except mce3 were detected in Mycobacterium bovis (18, 20). Further, Chitale et al. (2) demonstrated that mce1 encodes a surface protein and that polystyrene latex microspheres coated with purified recombinant mce1 protein can enter HeLa cells, while mce2, which has 67% similarity with mce1, does not display this property. This suggests that in addition to cell entry, mce operons perhaps have other functions. Later, the presence of mce operons in Mycobacterium smegmatis, which is a saprophytic species was also reported. Since the presence or absence of mce operons does not correlate with pathogenicity, it is possible that the expression profile of the mce operons is of importance in the virulence of pathogenic mycobacteria (6).
To investigate if there is a temporal and growth phase-specific difference in expression of mce operons, we analyzed the expression profile of mce operons during different growth phases in culture and in infected-animal models. We carried out a similar comparison of gene expression profiles among other genes known to be expressed in infected macrophages. We detect differential expression not only of mce operons but also of 10 other genes in cells in culture. We discuss the implication of our results in the context of pathogenesis of M. tuberculosis.
M. tuberculosis H37Rv was obtained from the Central Jalma Institute for Leprosy, Agra, India. M. tuberculosis H37Rv was grown in Middlebrook 7H9 broth (Difco) supplemented with OADC (oleic acid, albumin [bovine, fraction V], dextrose, catalase [Difco]) and 2% glycerol at 37°C. Bacteria from Lowenstein-Jensen slants were inoculated in Middlebrook 7H9 broth supplemented with OADC to a density of 0.4 A560 unit, and this was the primary culture. The secondary culture was inoculated with 7% of the primary culture. The bacilli were grown at 37°C as standing cultures in 100 ml of medium in a 500-ml conical flask covered with foil and brown paper. The bacilli were harvested at various days after the initial inoculation, from day 8 to day 60, by centrifugation at 5,000 × g for 10 min and washed with ice-cold normal saline before processing for RNA isolation. The bacilli were disrupted with a mini-bead beater (Biospec, Bartlesville, Okla.), and total RNA was isolated from approximately 109 bacilli with an EZ RNA isolation kit (Biological Industries, Kibbutz Beit, Haemck, Israel) as per the instructions of the manufacturer. The RNA was dissolved in nuclease-free water, treated with RNase-free DNase I (2 U/μg of RNA; Amersham Biosciences, Little Chalfont, United Kingdom) as recommended by the manufacturer, and stored in the presence of RNase inhibitor at a final concentration of 10 U/μg of RNA. The yield of RNA was estimated to be 6 μg/109 cells.
The presence of mRNA for each operon was checked at concentrations of template RNA varying from 50 to 600 ng per 20 μl of reaction mixture by reverse transcriptase (RT)-PCR. A single-step RT-PCR kit from Qiagen was used for RT-PCR according to the instructions of the manufacturer. Concentrations of RNA in the range of 50 to 600 ng per 20 μl of reaction mixture were used in RT-PCR for optimization. The reaction was initiated with reverse transcription at 50°C for 30 min, and RT was inactivated at 94°C for 15 min, following which 35 cycles of PCR were carried out under the following conditions: denaturation at 94°C for 1 min, reannealing for 1 min at 56 to 60°C depending on the primer sequence, and elongation at 72°C for 1 min, with a final extension at 72°C for 10 min.
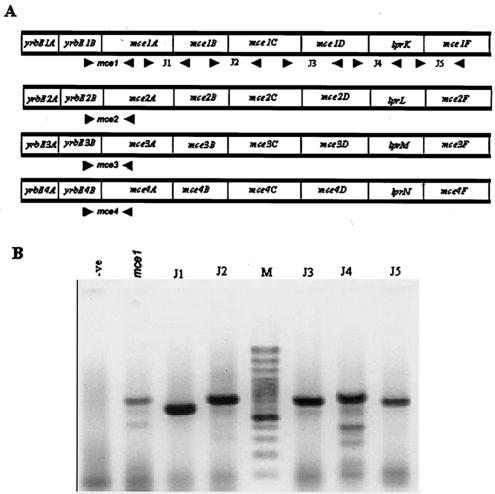
It is predicted by DNA sequence analysis that mce genes are organized as four operons in the Mycobacterium genome. However, it is not known if they are transcribed as a polycistronic mRNA. Therefore, we assayed the expression of mce1 by RT-PCR with primers that map across two adjacent genes so that the amplicon is obtained only if the genes are transcribed as polycistronic mRNA. The following primers were used for investigating the polycistronic nature of mce1: mce1f, ATT ATG TCG TTC CTG TCC CC; mce1r, GGT GAG CGT CTG GAA CAA C; J1f, CTG AGG ACG AAC TCA GAG ATC C; J1r, GAT ATT GAA CTC CAC CCG AAC C; J2f, TAC CTG GAC GCT ATT CAG C; J2r, TCG GAG AAC TTA GCC ACC; J3f, TGC GCT AAC CTC ACT CAA GG; J3f, ATT ATC GGC CAG CAC TGG; J4f, GGT TTA CAG GCC CCA CAG G; J4r, GCG CGG GTA ATG TCA TCG; J5f, TTC ACC GAC GAG CTC AAC C; J5r, TGT ACT GCC CGA TAC CCA CC. The position of the primers designated junction primers (J1 to J5) on the operon are shown in Fig. 1A. Amplicons of the estimated sizes were obtained with the junction primers (Fig. 1B), strongly suggesting that the operon is transcribed as a polycistronic message. A control to rule out DNA contamination was included in which mce1-specific primers were used and PCR was carried out without the RT step (first lane in Fig. 1B). It is known that there is extensive similarity in the organization of the different mce operons of M. tuberculosis H37Rv (3). Our own analysis (unpublished data) and that of others (3) have shown that there are no transcription start sites between the genes of the mce operons and in most cases the gap between genes is not more than 3 to 5 bp. Further, the stop codon of one gene and the start codon of the next gene are immediately adjacent to each other, and in several cases there is an overlap (data not shown). Therefore, considering that the distribution of putative transcriptional and translational landmarks is similar between the different mce operons, it is implied that all the operons are potentially expressed as polycistronic messages. Hence, to monitor the expression of individual operons, junctional primers were chosen so that the forward primer maps towards the 3′ end of the second gene in the operon and the reverse primer maps to the 5′ end of the third gene in the operon (Fig. 1A), so that the presence or absence of the transcript will indicate the presence or absence of the mRNA for the operon. The sequence of the primers specific for each operon and those used to monitor the expression of genes other than those of the mce operons are given in Table 1. The primer sequences were examined for their specificity by a genomewide search utilizing the BLOSSOM 62 matrixes in BLAST against the microbial genome database of the National Center for Biotechnology Information. Further, the amplicons obtained from genomic DNA PCR and RT-PCR with the junction primers for each operon were sequenced and compared to the sequence in the database to confirm the specificity of the amplicons.
FIG. 1.
Analysis of the expression of mce1 genes. (A) Schematic representation of the mce operons. The arrowheads indicate the position of the junction primers (J1 to J5). (B) Amplicons of RT-PCR with junction primers. Primer sets used are indicated above each lane. M, 100-bp ladder as a size marker; -ve, negative control, where mce1 primers were used in a PCR without an RT step. The RNA concentration was 300 ng per 20 μl of reaction mixture. The fast-moving band has the primer dimers.
TABLE 1.
Sequences of primers used in analysis of expression profile of mce operons and genes expressed during infection (5)
| Gene or operon | Forward primer | Reverse primer |
|---|---|---|
| mce2 | CGACATGGCTTTCACCTCTG | CCGACCCCACATCAATCAC |
| mce3 | CAACACCCGCGAGATTCAG | GTTCTTCGAATGCAGTACC |
| mce4 | CACCTTCCTCATCCCCTC | GATGAGCGATTGGAACAAC |
| sigE | CAATATCACGACCATCACGACCTT | AGCACCACCGCGGCACGAAACT |
| sigH | GGCCTGGCTCTACCGGATACTGAC | GGCTAAAAGACCGCGCACTGAC |
| icl | TGGGAGCAGCTGCACGACCTCG | TGGGTCGGGATCAACACCTTC |
| ponA1 | GGGCGGCGGAGAAGGCGGTTGC | ACGAAATGCGGCGGGTGGTAGATA |
| uvrA | CCGGCCGGGAAAGCATTGAGATAC | CGTCGACCAGGGTGCGTAGATAGC |
| pks2 | CCGCACCCAGCCGACGCAAAAGAT | GCCGCCGACGAAAACAAGCAGAAC |
| ctpV | CGGGTTTCGGCGGTGTTTGTCC | CGGCCGCGCTCTTCCTGCTCCAC |
| Rv3070 | GTATTGGGTCCGTGTTGCGTTTTC | CCATCTGGCGGTCCTCTCC |
| Rv3843c | TACGCCGGAGGACAGCAACTACG | TACGGCGGCGCATCGAACAACTCC |
| prrA | GCTGGAACGCGGCTTACG | CAGGTCGAATTCGCGCTTGGTCAG |
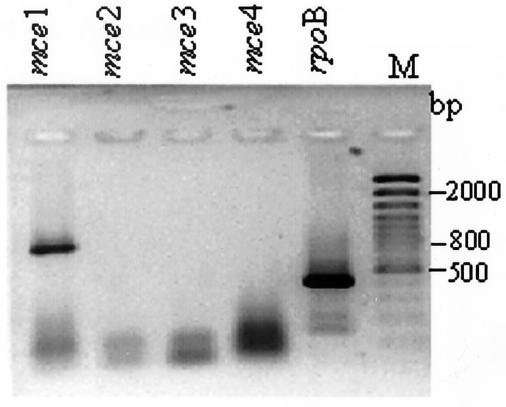
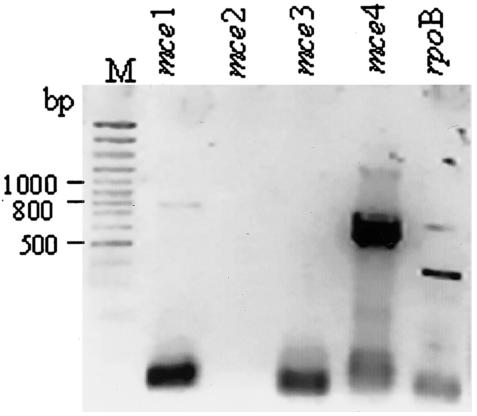
The expression of mce operons in M. tuberculosis after different growth periods in synthetic medium was examined by RT-PCR with the junction primers described above. At all concentrations of template RNA, significant levels of mce1 operon expression were detected in the exponential phase on days 8, 10, and 12. In the stationary phase at days 20, 25, 30, and 60, at less than 500 ng of RNA template, no amplicon for mce1 was detected, whereas a major amplicon corresponding to mce4 was detected, while at 500 ng of RNA, a major amplicon for mce4 and a low-intensity band corresponding to mce1 were observed. The representative profiles for days 10 and 20 at 500 ng of RNA template are shown in Fig. 2 and 3, respectively. After day 20, the expression profile of mce operon genes did not change; therefore, 10- and 20-day-old cultures were taken as representation of exponential and stationary phases, respectively (4, 14). At all the growth periods analyzed and at all concentrations of the template RNA used, the expression of mce2 and -3 was not detected. The absence of RT-PCR amplicons for mce2, -3, and -4 at exponential growth phase and for mce2 and 3 at stationary growth phase rules out the possibility of DNA contamination in the RNA samples.
FIG. 2.
Analysis of expression profile of mce operons in exponential phase. Amplicons of RT-PCR with specific primers for mce1, mce2, mce3, and mce4 and RNA from 10-day-old cultures as the template were analyzed by electrophoresis; the operon-specific primers used are indicated above the lanes. M, 100-bp ladder. Equal concentrations of RNA (500 ng per 20 μl of reaction mixture) were used in all experiments; rpoB was used as a positive control. The fast-moving band has the primer dimers.
FIG. 3.
Analysis of expression profile of mce operons in stationary phase. Amplicons of RT-PCR with operon-specific primers as indicated above each lane were analyzed; rpoB was used as a positive control. M, 100-bp ladder. The RNA from 20-day-old cultures was used at a concentration of 500 ng per 20 μl of reaction mixture. The fast-moving band has the primer dimers.
The differences in the expression of mce operons at days 10, 20, and 60 prompted us to examine the expression profile of these genes in the infected animal models. Rabbits and guinea pigs were housed at Vallabh Bhai Patel Chest Institute, Delhi, India. The animal handling was according to the guidelines of the Institutional Ethical Committee and Indian Council of Medical Research, India. Culture (1 mg; 107 to 108 CFU) was inoculated by the intramuscular route into the left hind limbs of four guinea pigs and two rabbits (8). The animals were examined every week for signs of sickness, such as weight loss, rise in temperature, and low levels of activity. Severe symptoms of the disease were observed by 16 weeks in case of guinea pigs and 24 weeks in rabbits, after which the animals were sacrificed, autopsy was conducted, and internal organs were examined for the presence of tubercles.
The spleens of guinea pigs and the lungs of the rabbits were selected for RNA isolation on the basis of visible tubercular lesions on the organ surface and histopathological reports confirming the presence of bacilli exhibiting acid-fast staining, the formation of granulomas, and evidence of necrosis (data not shown). The tubercular lesions from the tissues were dissected and harvested at autopsy. These tubercular lesions were lysed with buffer containing 2% sodium dodecyl sulfate-20 mM K2HPO4-KH2PO4 (lysis buffer) to release the bacilli, which were collected by centrifugation at 8,000 × g for 10 min, and a drop of the suspension was examined for acid-fast bacilli. For RNA extraction, the bacilli were resuspended in fresh lysis buffer supplemented with 1 mM MgCl2 and RNase and DNase I (1 μg/ml each) and incubated at 37°C to remove tissue debris. The bacilli were washed twice in ice-cold lysis buffer and processed for RNA isolation.
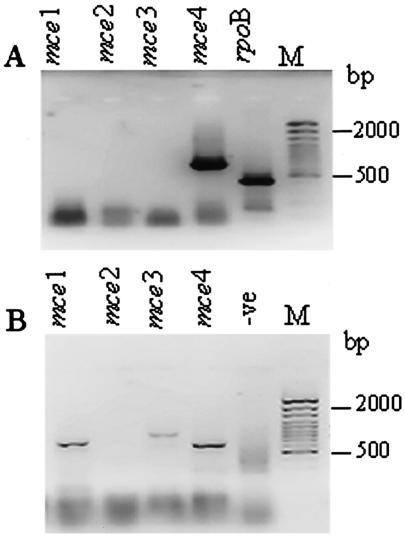
RT-PCR was carried out at various concentrations of RNA isolated from the tubercles. The results are shown in Fig. 4. In spleens, only the expression of mce4 was detected (Fig. 4A), while in pulmonary tissue of rabbits, expression of mce1, -3, and -4 was detected (Fig. 4B). The lack of amplicons for mce1, -2, and -3 in RT-PCR with RNA from bacilli isolated from the infected spleens of guinea pigs and that of mce2 in the lung tissue of rabbits indicates the absence of DNA contamination in the RNA samples.
FIG. 4.
Analysis of expression profile of mce operons in bacilli from spleens of infected guinea pigs (A) and from pulmonary tubercles from infected rabbits (B). The amplicons are from RT-PCR with operon-specific primers as indicated above each lane; rpoB-specific primers were used as a positive control. M, 100-bp ladder; -ve, negative control, where the RT step was omitted for rpoB-specific primers to rule out DNA contamination. The RNA concentration was 300 ng per 20 μl of reaction mixture in each case. The fast-moving band has the primer dimers.
We detected the expression of mce3 in the lung tissues of infected rabbits but not in the infected tissues of guinea pigs or in the bacilli in culture. This may be viewed in the light of the absence of mce3 in M. bovis and the host preference of the two species. Recently, it was shown that mce3 is under negative regulation by the Rv1963c gene product; further, those authors speculated that under certain conditions, the repression of gene expression could be alleviated (11). It is interesting to speculate that such a mechanism resulting in alteration of gene expression may operate in a tissue-specific manner during infection. It has been shown that the expression of a two-component response regulator, mprA (mycobacterial persistence regulator), is required for the entry and maintenance of H37Rv in vivo in an organ-specific and infection stage-specific manner. The differential expression of mce operons suggested by our results and the presence of multiple copies of apparently similar mce operons in M. tuberculosis genome are perhaps related to organ-specific and stage-specific functions of these genes.
mce4 is expressed in both the lung tissues of rabbits and the spleens of guinea pigs following infection, as well as in culture at day 20. This is in contrast to the expression of mce1, whose transcripts were not detected in the infected spleens of guinea pigs. In broth cultures, the expression of mce1 is limited to day 10 cultures, with low-level expression in day 20 cultures.
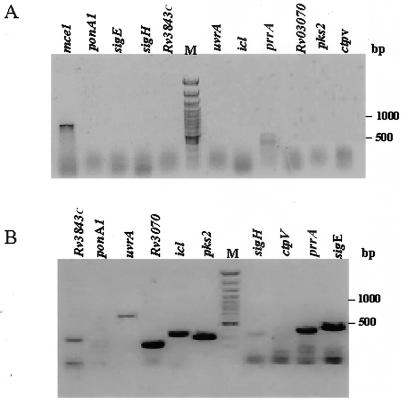
Having observed differential expression of genes of the mce operons and a broad similarity in the expression at the stationary phase of growth in culture and in the infected animal tissues, we analyzed the expression of other genes for similar comparison. We examined the expression of genes that were reported to be transcribed during infection of macrophages in culture (5). The expression of the following genes was examined: Rv3843c, ponA1, uvrA, Rv3070, icl, pks2, sigH, ctpV, prrA, and sigE. Total RNA from the bacilli at days 10 and 20 in culture was analyzed for the expression by RT-PCR with gene-specific primers (Fig. 5). At day 10 the expression of only prrA was detected (Fig. 5A), while at day 20 expression of all the genes except ponA1 and ctpV was detected (Fig. 5B). Here again, the absence of amplicons for certain genes like ponA1 and ctpV indicates the absence of DNA contamination in the RNA samples.
FIG. 5.
Analysis of expression profile at exponential growth phase (A) and stationary growth phase (B), analyzed by RT-PCR with gene-specific primers for 10 genes reported to be expressed in infected macrophages. The gene amplified is indicated above each lane. M, 100-bp marker. The RNA concentration was 300 ng per 20 μl of reaction mixture in each case. mce1 was used as a positive control (A). The fast-moving band has the primer dimers.
Thus, we observed differential expression for genes other than those of the mce operons at different growth stages in culture. In light of the observation of Graham and Clark-Curtiss in macrophages infected with M. tuberculosis (5), our results suggest an interesting parallel between the cellular infection by mycobacteria and the stationary phase of growth, i.e., day 20 in culture. It has been recognized that latency of M. tuberculosis infection closely resembles the growth of the bacilli under anaerobic conditions (12, 13, 15). It is also known that metabolic activity of M. tuberculosis can be slowed down in vitro by using a variety of stress conditions, including simple ageing of logarithmically growing cultures or growth of unagitated submerged cultures with concomitant oxygen limitation (16, 19). It is possible that the microenvironment within a tubercle is very similar to that which mycobacterial cells encounter during prolonged periods of growth in culture. It is relevant that in the day 20 cultures we detected the expression of sigH, an alternative sigma factor, and icl, the gene coding for isocitrate lyase, known to be expressed under oxidative and heat stress (10, 17). The importance of sigH in virulence and pathogenesis of M. tuberculosis in the mouse model has been established (7). The results for the expression patterns of other genes, like Rv3843c, ponA1, uvrA, Rv3070, pks2, ctpV, prrA, and sigE, also indicate that the stationary growth phase resembles infection in vivo rather than the exponential growth phase. We detected low-level expression of prrA, which codes for a putative two-component system regulator protein during exponential phase of growth. The low-level expression of prrA may be related to the function of the two-component system in sensing the environmental conditions. A functional comparison of the mycobacterial infection in vivo and the culture in stationary phase with a large number of genes is under progress.
Each mce operon contains eight genes, thus accounting for 32 genes from four mce operons. Considering the polycistronic nature of mce operons and 10 other genes reported to be infection specific, we analyzed expression profiles of 42 genes in total. Of the 42 genes examined, only 9 showed expression both at day 10 and in in vivo infection. Extending this comparison between bacilli at day 20 in culture and in vivo infection, 24 genes are expressed in both cases. Thus, qualitatively, there is a similarity of 26% between expressions at day 10 in culture and during infection, whereas a similarity of 70% was seen between expression at day 20 in culture and in vivo infection (34 of 42 genes expressed in tubercles, 24 of 42 in stationary-phase bacilli, and 9 of 42 in exponential-phase bacilli).
The expression of mce2 was not detected under any of the conditions analyzed here. We examined the organization of mce2 in silico and found that the organization of mce2 is different from others in having an open reading frame designated Rv0586, encoding a transcriptional regulator belonging to the GntR family similar to the regulator of the lactate dehydrogenase operon upstream of yrbE2A; moreover, there is one more small open reading frame, designated Rv0590A, between mce2B and mce2C (Fig. 6). This organization is peculiar to mce2 and is absent in other mce operons. The transcription of mce2 along with Rv0586 may be required for growth under specific environmental conditions. The significance of the presence of the Rv0586 and Rv0590A as a part of mce2 is not clear at this stage.
FIG. 6.
Schematic representation of the organization of mce2 and mce1, -3, and -4. Each open rectangle indicates a gene within the operon. Hatched rectangle, Rv0590A; filled rectangle, Rv0586 (encoding a putative lactate dehydrogenase regulator); arrow, putative start site of transcription of the first gene of the mce operon.
The differential expression of mce operons reported here suggests a probable reason for the apparent redundancy of this operon. The significance of differential expression in pathogenesis is being examined.
Acknowledgments
We thank S. K. Brahmachari, S. Ramachandran, and Yogendra Singh of the Institute of Genomics and Integrative Biology (formerly CBT), India, for useful discussions and for automated DNA sequencing facilities and A. K. Singh (Institute for Nuclear Medicines and Allied Sciences, India) for help in animal experiments.
Financial assistance from Indian Council for Medical Research, India, through a grant to M.B. and V.B. is gratefully acknowledged.
Editor: S. H. E. Kaufmann
REFERENCES
- 1.Arruda, S., G. Bomfim, R. Knights, Huima-Byron, and L. W. Riley. 1993. Cloning of an M. tuberculosis DNA fragment associated with entry and survival inside cells. Science 261:1454-1457. [DOI] [PubMed] [Google Scholar]
- 2.Chitale, S., S. Ehrt, S. Kawamura, T. Fujimura, N. Shimono, N. Anand, S. Lu, L. Cohen-Gould, and L. W. Riley. 2001. Recombinant Mycobacterium tuberculosis protein associated with mammalian cell entry. Cell. Microbiol. 3:247-254. [DOI] [PubMed] [Google Scholar]
- 3.Cole, S. T., R. Brosch, J. Parkhill, T. Garnier, C. Churcher, S. V. Harris, et al. 1998. Deciphering the biology of Mycobacterium tuberculosis from the complete genome sequence. Nature 393:537-544. [DOI] [PubMed] [Google Scholar]
- 4.Gonzalez, J. A., Y. Merchand, M. J. Colston, and R. A. Cox. 1999. Effects of growth conditions on expression of mycobacterial murA and tyrS genes and contributions of their transcripts to precursor rRNA synthesis. J. Bacteriol. 181:4617-4627. [DOI] [PMC free article] [PubMed] [Google Scholar]
- 5.Graham, J. E., and J. E. Clark-Curtiss. 1999. Identification of Mycobacterium tuberculosis RNAs synthesized in response to phagocytosis by human macrophages by selective capture of transcribed sequences (SCOTS). Proc. Natl. Acad. Sci. USA 96:11554-11559. [DOI] [PMC free article] [PubMed] [Google Scholar]
- 6.Haile, Y., D. A. Caugant, G. Bjune, and H. G. Wiker. 2002. Mycobacterium tuberculosis mammalian cell entry operon (mce) homologs in Mycobacterium other than tuberculosis (MOTT). FEMS Immunol. Med. Microbiol. 33:125-132. [DOI] [PubMed] [Google Scholar]
- 7.Kaushal, D., B. G. Schroeder, S. Tyagi, T. Yoshimatsu, C. Scott, C. Ko, L. Carpenter, J. Mehrotra, Y. C. Manabe, R. D. Fleischmann, and W. R. Bishai. 2002. Reduced immunopathology and mortality despite tissue persistence in a Mycobacterium tuberculosis mutant lacking alternative sigma factor, SigH. Proc. Natl. Acad. Sci. USA 99:8330-8335. [DOI] [PMC free article] [PubMed] [Google Scholar]
- 8.Mitchison, D. A., A. L. Bhatia, S. Radhakrishnan, J. B. Selkon, T. V. Subbiaah, and J. G. Wallace. 1961. The virulence in the guinea pig of the tubercle bacilli isolated before treatment from South Indian patients with pulmonary tuberculosis. I. Homogeneity of the investigation and critique of the virulence test. Bull. W. H. O. 25:285-312. [PMC free article] [PubMed] [Google Scholar]
- 9.Parker, S. L., Y. L. Tsai, and C. J. Palmer. 1995. Comparison of PCR-generated fragments of the mce gene from Mycobacterium tuberculosis, M. avium, M. intracellulare, and M. scrofulaceum. Clin. Diagn. Lab. Immunol. 2:770-775. [DOI] [PMC free article] [PubMed] [Google Scholar]
- 10.Raman, S., T. Song, X. Puyang, S. Baradrov, W. R. Jacobs, Jr., and R. N. Husson. 2001. The alternative sigma factor SigH regulates major components of oxidative and heat stress responses in Mycobacterium tuberculosis. J. Bacteriol. 183:6119-6125. [DOI] [PMC free article] [PubMed] [Google Scholar]
- 11.Santangelo, M. P., J. Goldstein, A. Alito, A. Gioffré, K. Caimi, O. Zabal, M. Zumárraga, M. I. Romano, A. A. Cataldi, and F. Bigi. 2002. Negative transcriptional regulation of the mce3 operon in Mycobacterium tuberculosis. Microbiology 148:2997-3006. [DOI] [PubMed] [Google Scholar]
- 12.Segal, W., and H. Bloch. 1956. Biochemical differentiation of Mycobacterium tuberculosis grown in vivo and in vitro. J. Bacteriol. 72:132-141. [DOI] [PMC free article] [PubMed] [Google Scholar]
- 13.Segal, W., and H. Bloch. 1957. Pathogenic and immunogenic differentiation of Mycobacterium tuberculosis grown in vivo and in vitro. Am. Rev. Tuberc. Pulm. Dis. 75:495-500. [DOI] [PubMed] [Google Scholar]
- 14.Talaat, A. M., S. T. Howard, W. Hale IV, R. Lyons, H. Garner, and S. A. Johnston. 2002. Genomic DNA standards for gene expression profiling in Mycobacterium tuberculosis. Nucleic Acids Res. 30:104-113. [DOI] [PMC free article] [PubMed] [Google Scholar]
- 15.Wayne, L. G. 1994. Dormancy of Mycobacterium tuberculosis and latency of disease. Eur. J. Clin. Microbiol. Infect. Dis. 13:908-914. [DOI] [PubMed] [Google Scholar]
- 16.Wayne, L. G., and G. A. Diaz. 1967. Autolysis and secondary growth of Mycobacterium tuberculosis in submerged culture. J. Bacteriol. 93:1374-1381. [DOI] [PMC free article] [PubMed] [Google Scholar]
- 17.Wayne, L. G., and K. Y. Lin. 1982. Glyoxylate metabolism and adaptation of Mycobacterium tuberculosis to survival under anaerobic conditions. Infect. Immun. 37:1042-1049. [DOI] [PMC free article] [PubMed] [Google Scholar]
- 18.Wiker, H. G., E. Spierings, M. A. B. Kolkman, T. H. M. Ottenhoff, and M. Harboe. 1999. The mammalian cell entry operon 1 (mce1) of Mycobacterium leprae and Mycobacterium tuberculosis. Microb. Pathog. 27:173-177. [DOI] [PubMed] [Google Scholar]
- 19.Yuan, Y., D. D. Crane, and C. E. Barry III. 1996. Stationary phase-associated protein expression in Mycobacterium tuberculosis: function of the mycobacterial α-crystallin homolog. J. Bacteriol. 178:4484-4492. [DOI] [PMC free article] [PubMed] [Google Scholar]
- 20.Zumárraga, M., F. Bigi, A. Alito, M. I. Romano, and A. Cataldi. 1999. A 12.7 kb fragment of the Mycobacterium tuberculosis genome is not present in Mycobacterium bovis. Microbiology 145:893-897. [DOI] [PubMed] [Google Scholar]


