

Abstract
Candida tropicalis ATCC 20336 can grow on fatty acids or alkanes as its sole source of carbon and energy, but strains blocked in β-oxidation convert these substrates to long-chain α,ω-dicarboxylic acids (diacids), compounds of potential commercial value (Picataggio et al., Biotechnology 10:894-898, 1992). The initial step in the formation of these diacids, which is thought to be rate limiting, is ω-hydroxylation by a cytochrome P450 (CYP) monooxygenase. C. tropicalis ATCC 20336 contains a family of CYP genes, and when ATCC 20336 or its derivatives are exposed to oleic acid (C18:1), two cytochrome P450s, CYP52A13 and CYP52A17, are consistently strongly induced (Craft et al., this issue). To determine the relative activity of each of these enzymes and their contribution to diacid formation, both cytochrome P450s were expressed separately in insect cells in conjunction with the C. tropicalis cytochrome P450 reductase (NCP). Microsomes prepared from these cells were analyzed for their ability to oxidize fatty acids. CYP52A13 preferentially oxidized oleic acid and other unsaturated acids to ω-hydroxy acids. CYP52A17 also oxidized oleic acid efficiently but converted shorter, saturated fatty acids such as myristic acid (C14:0) much more effectively. Both enzymes, in particular CYP52A17, also oxidized ω-hydroxy fatty acids, ultimately generating the α,ω-diacid. Consideration of these different specificities and selectivities will help determine which enzymes to amplify in strains blocked for β-oxidation to enhance the production of dicarboxylic acids. The activity spectrum also identified other potential oxidation targets for commercial development.
Most industrial chemicals are currently produced from petroleum, but new bioprocesses are being established that generate commodity chemicals from agricultural feedstocks with genetically engineered microbes as the catalysts (1, 5, 21). Prominent examples are the production of lactic acid and 1,3-propanediol from glucose for use as polymer precursors (3, 4). Most of these efforts employ carbohydrate feedstocks such as glucose derived from cornstarch, but other biological molecules offer additional feedstocks. Fatty acids have long been purified and modified to generate commercial chemicals such as detergents, emulsifying agents, and lubricants. Now, in an emerging industrial process, genetically engineered yeasts have been developed that convert fatty acids and alkanes to long-chain α,ω-dicarboxylic acids (16, 17). Conversion of fatty acids from renewable feedstocks to specialty chemicals is an attractive commercial opportunity. These compounds are potentially useful in a variety of applications, including adhesives, fragrances, lubricants, coatings, and specialty polymers.
The initial step in the formation of long-chain α,ω-diacids by members of the yeast genus Candida is ω-hydroxylation by a hydroxylase complex composed of a cytochrome P450 monooxygenase (CYP) and an NADPH:cytochrome P450 oxidoreductase (NCP) (18, 20, 23). The hydroxylase complex generates an ω-hydroxy acid that is further oxidized by other enzymes to the corresponding diacid (Fig. 1). Normally the microbes metabolize both fatty acids and diacids further by β-oxidation, but when this pathway is blocked, diacids accumulate and are secreted into the surrounding medium (16). The most efficient way to block the β-oxidation pathway is to inactivate the POX genes, encoding the acyl coenzyme A oxidase enzyme that catalyzes the first pathway step. C. tropicalis strain H5343 was derived in this manner by introducing knockout mutations of both alleles of the POX genes present in ATCC 20336 (16, 17). When incubated under appropriate conditions with an industrial source of fatty acids, such as high oleic sunflower fatty acids (HOSFFA), H5343 converts the oleic acid to α,ω-dicarboxy-11-hexadecene, a potential monomer in the production of specialty polymers.
FIG. 1.

Alternative oxidation pathways for fatty acids in C. tropicalis. Oxidation of fatty acids can occur through β-oxidation (reactions in right panel) or by ω-oxidation of the terminal methyl group to yield the dicarboxylic acid (DCA, reactions in the left panel). Dicarboxylic acids are themselves subject to subsequent β-oxidation. In ω-oxidation, the hydroxylase reaction is catalyzed by members of the CYP52A family of cytochrome P450s and their companion cytochrome P450 reductase. The oxidase reaction is catalyzed by a fatty alcohol oxidase, and the dehydrogenase reaction is catalyzed by a fatty aldehyde dehydrogenase. Inactivation of the POX genes of β-oxidation, which encode acyl coenzyme A (CoA) oxidases, blocks β-oxidation. Under these circumstances, fatty acids are oxidized solely by ω-oxidation, and long-chain dicarboxylic acid homologues of the parent fatty acids accumulate.
As discussed in the companion paper by Craft et al. in this issue (6), C. tropicalis ATCC 20336 and its derivatives contain at least 10 distinct genes that possess high homology to ω-hydroxylating cytochrome P450 monooxygenase genes. When strains were incubated with pure oleic acid or mixtures containing predominantly oleic acid, these strains were found to express two cytochrome P450s strongly and consistently, CYP52A13 and CYP52A17. These enzymes are believed to be at least in part limiting in the conversion of fatty acids to diacids, but their relative oxidative activity toward oleic acid or other fatty acids is not known. Such information would be of value in determining approaches for improving diacid productivity through amplification of critical genes or for the development of other processes based on alternative starting materials. To determine these properties, the selected P450s were expressed individually in Sf9 insect cells, a heterologous system free of other members of the cytochrome P450 CYP52 family.
C. tropicalis ATCC 20336 belongs to the subgroup of the genus Candida that has been reported to use a modification of the universal genetic code in which the codon CUG encodes primarily serine instead of leucine (14, 22, 24). Because the genes encoding CYP52A17 and NCPA, the reductase partner of the cytochrome P450s, both contain CUG codons, we first established that ATCC 20336 and its β-oxidation-blocked derivatives preferentially translate CUG as serine. We then modified the CUG codons in CYP52A17 and NCPA to standard serine codons to ensure expression of proteins having the correct amino acid sequence in heterologous host cells. No modification of CYP52A13 was required, as its does not contain a CUG codon. The genes were cloned into baculovirus-based expression vectors and expressed in Sf9 insect cells. Substrate preferences and the relative activities of the two enzymes were determined with microsomes prepared from these Sf9 insect cells.
MATERIALS AND METHODS
Strains and culture conditions.
Cultures of Escherichia coli were grown in Luria-Bertani (LB) medium supplemented with appropriate antibiotics for maintenance of plasmids. Antibiotics and their final concentrations were: ampicillin, 100 μg/ml; kanamycin, 50 μg/ml;, gentamicin, 7 μg/ml; and tetracycline, 10 μg/ml. Library Efficiency E. coli DH5a competent cells (Life Technologies, Inc.) were used for manipulation of plasmids, and E. coli strain DH10Bac containing the helper bacmid (Life Technologies, Inc.) was used for the production of bacmid for infection of Sf9 insect cells. Candida tropicalis cells were cultured in a fermentor with HOSFFA as a source of oleic acid. Cultivation of Spodoptera frugiperda Sf9 cells for the expression of cloned genes is described below. Plasmids used in the experiments are listed in Table 1.
TABLE 1.
Expression vectors used in experiments
| Vectora | Contents | Source |
|---|---|---|
| pFastBac Dual | polH and p10 promoters | Invitrogen |
| pFBDncp | NCPA in pFastBac Dual (p10 promoter) | This work |
| pFBDncp2A | CYP52A13 in pFBDncp | This work |
| pFBDncp5A | CYP52A17 in pFBDncp | This work |
The vector pFBDncp contains NCPA under control of the p10 promoter. The NCPA gene sequence was modified by replacing the single CUG codon (amino acid residue 50) with a UCG encoding serine. Vector pFBDncp2A contains, in addition to NCPA, the gene CYP52A13 under control of the polH promoter. Vector pFBDncp5A contains, in addition to NCPA, CYP52A17 under control of the polH promoter. The two CUG codons present in CYP52A17 (amino acid residues 261 and 490) were also replaced by serine codons UCG and UCU, respectively.
Purification and analysis of NCPA.
NCPA was produced by fermentation of C. tropicalis strain H5343 with HOSFFA as the substrate and glucose as the cosubstrate (2). The cells were grown in a minimal salts medium on glucose at 35°C to an absorbance at 600 nm of 25 to 30. When the growth phase was completed, as determined by a sharp rise in dissolved oxygen, the cells were immediately switched to the bioconversion phase. Glucose feed was controlled so that no excess glucose accumulated.
To start the bioconversion phase, a small charge of HOSFFA was added to the fermentation. Feeding of substrate continued during the remainder of the fermentation. Cells were washed to remove any residual diacid and suspended in 0.1 M potassium phosphate buffer, pH 7.6, containing 0.1 mM phenylmethylsulfonyl fluoride. Cell lysis was achieved by three passages through a French press at 1,600 lb/in2. The lysate was centrifuged at 37,000 × g for 30 min. NCPA was solubilized by treatment of 5 ml of the supernatant with 5 ml of 30 mM HEPES, pH 7.5, containing 300 mM NaCl, 2% Triton, and 2 mM phenylmethylsulfonyl fluoride. After gentle shaking for 4 h, the solution was centrifuged at 100,000 × g for 1 h.
NCPA was purified from the supernatant by affinity chromatography on adenosine 2′,5′-diphosphate immobilized on agarose (Sigma Chemical Co.) and equilibrated with 50 mM Tris-HCl, pH 7.7, containing 0.1% Triton X-100. After extensive washing of the column, NCPA was eluted with buffer containing 2 mM 2′-AMP. All procedures were carried out at 4°C. Tryptic digestion, matrix-assisted laser desorption ionization-time of flight (MALDI-TOF), and tandem mass spectral analyses of the purified protein were performed by the Howard Hughes Medical Foundation's Keck Laboratories at Yale University.
PCRs.
PCRs were performed in a 50-μl final volume with 1.25 U of Platinum Pfx polymerase (Invitrogen Life Technologies, Inc.). Typically, reactions contained 0.2 mM deoxynucleoside triphosphate mix, 1 to 2 mM MgSO4, and 50 μM primers. Denaturation was done at 94°C for 30 s and annealing from 51 to 58°C, according to the recommendation of the program Oligo 5.0 (Molecular Biology Insights, Inc., Cascade, Colo.) for the particular primer-template interaction involved, for 45 s, and elongation at 72°C for 1 min for 25 to 35 cycles. For the second stage of overlap extension PCR, four cycles were performed with only the two fragments from the initial reactions present, then the outside primers were added and the reaction was continued. The templates for PCR were C. tropicalis genomic clones containing the target genes (17).
Alteration of CUG codon and introduction into expression vectors.
The single CUG codon of NCPA was changed to UCG by amplification by overlap extension PCR (10). The full-length gene product was purified with a Qiagen PCR purification kit, digested with XmaI and KpnI, and ligated into pFastBac Dual plasmid DNA (Life Technologies, Inc.). Three of the isolated clones were sequenced to confirm that the codon had been modified as desired and that no other base substitutions had been introduced. One clone, designated pFBDncp, was retained for further experiments.
The two CUG codons of CYP52A17 were also changed to codons that encode serine by overlap extension PCR. The CTG encoding amino acid 261 of CYP52A17 was changed to UCG, while the second CTG encoding amino acid 490 of CYP52A17 was changed to UCU. Two of the isolated clones were sequenced to confirm that both CTG codons had been modified and that no other base substitutions had been introduced. One clone, designated pFBDncp5A, was retained for further experiments.
The CYP52A13 gene lacks CUG codons. A full-length gene product was amplified by PCR, digested with BamHI and XbaI, and ligated into the expression vector pFBDncp. Two of the isolated clones were sequenced to confirm that no base substitutions had been introduced. One clone, pFBDncp2A, was retained for further experiments.
All sequencing reactions were performed by Sequetech, Corp., Mountain View, Calif., with primers designed by them based on the known sequences of the genes and vectors involved. ABI files were analyzed with the program SeqMan of the Lasergene suite (DNAStar, Madison, Wis.).
Expression of C. tropicalis proteins in insect cells.
CYP and NCP proteins were expressed in insect cells by standard methods modified for expression of cytochrome P450 and according in detail to vendor protocols (12, 13, 15). Sf9 (Spodoptera frugiperda) insect cells, adapted to serum-free suspension culture, were purchased from Invitrogen and cultured in commercial SF900II serum-free medium (SFM) at 28 ± 1°C on an orbital shaker rotating at 135 to 150 rpm. Oxygenation was accomplished by loosening the cap. Cells were monitored until viabilities of greater than 97% were achieved. Cells were allowed to reach a density of 2 × 10⁶ to 4 × 10⁶ viable cells/ml before subculturing and seeding new cultures at a density of 3 × 10⁵ to 5 × 10⁵ viable cells/ml with fresh SF900II SFM.
For transfection of SF9 cells, bacmid DNA was isolated from E. coli that had been infected with pFastBac Dual derivatives. Cells (9 × 10⁵ cells per 35-mm well of a six-well plate) were seeded in 2 ml of SF900II SFM broth containing penicillin and streptomycin at 50 U/ml and 50 μg/ml, respectively. Only cells from a 3- to 4-day-old suspension culture in mid-log phase with viability greater than 97% were used. Cells were allowed to attach to the plate well at 27°C for at least 1 h, and during that time, the following sterile solutions were prepared. Solution A contained 5 μl of miniprep bacmid DNA diluted into 100 μl of SF900II SFM without antibiotics. For solution B, for each transfection, 6 μl of Cellfectin reagent (Invitrogen) was diluted into 100 μl of SF900II SFM without antibiotics. The two solutions were combined and incubated for 45 min at room temperature.
For each transfection, 800 μl of SF900II SFM was added to each tube containing the lipid-DNA complexes. The lipid-DNA complexes were overlaid on the cells. Cells were incubated for 5 h in a 27°C incubator. The transfection mixtures were then removed, and 2 ml of SF900II SFM containing antibiotics was added to each well. Cells were incubated at 27°C for 72 h. The recombinant baculoviruses were harvested by removing the culture supernatant with a pipette. The virus titer was determined by viral plaque assay. Under sterile conditions, 2 ml of cell suspension at 5 × 10⁵ cells/ml was dispensed per well. Cells were allowed to settle to the bottom of plates, and the medium was replaced with 1 ml of a serial dilution of the harvested viral supernatant and incubated for 1 h at room temperature. After incubation, the virus inoculum was removed from the wells and replaced with 2 ml of the diluted agarose. The wells were moved to a 27°C humidified incubator and incubated for 4 to 10 days. Recombinant viruses were detected by visual screening for milky gray plaques. The plates were monitored daily until the number of plaques counted did not change for 2 consecutive days. The titer of the inoculum employed was then determined.
The recombinant viruses were subjected to two rounds of amplification in order to obtain a high-titer stock (more than 108 PFU/ml). All virus stocks were stored at 4°C and protected from light to ensure maintenance of titer.
Expression of recombinant proteins.
Small-scale expression studies were performed in shake flasks. Exponentially growing Sf9 cells were resuspended at a density of 2 × 10⁶ cells/ml in SF900II SFM medium supplemented with 5% fetal bovine serum, penicillin (100 U/ml), and streptomycin (100 μg/ml). Recombinant baculoviruses were added at a multiplicity of infection of 5 or 10. Heme precursors (hemin chloride, 2 μg/ml; ferric citrate, 100 μM; and δ-aminolevulinic acid, 100 μM) were also added at this stage. Cells were incubated at 28°C at 125 to 150 rpm for 48 h. The infected cells were harvested by centrifugation at 1,000 × g for 10 min, and the cell pellets were frozen at −80°C.
Large-scale expression of recombinant proteins was performed at a 1-liter scale by Panvera-Invitrogen Discovery Screening (Madison, Wis.) with the viral stocks prepared and analyzed as described above. Ten 1-liter fermentations of Sf9 cells were performed under conditions identical to those used for the expression studies described above with standard practices of the industry.
Microsome preparation.
The cell pellets were homogenized with a glass Teflon tissue homogenizer in cold resuspension buffer (0.1 M K2HPO4 [pH.7.4] supplemented with 20% [vol/vol] glycerol, 1 mM EDTA, and 1 mM glutathione). After removal of cellular debris by centrifugation at 7,500 rpm at 4°C for 30 min, microsomes were pelleted by centrifugation at 100,000 × g for 10 min in a Beckman TL100 ultracentrifuge. The microsomes were resuspended in resuspension buffer and homogenized. The microsomes were aliquoted and frozen at −80°C. All the steps of the procedure were carried out at 4°C.
Western analysis.
Microsomal samples were analyzed by sodium dodecyl sulfate-polyacrylamide gel electrophoresis (SDS-PAGE) on 12% minigels. Samples were denatured at 100°C in reducing sample buffer (6% SDS, 0.24 M dithiothreitol, 0.06% bromophenol blue, sucrose 20%) for 10 min prior to loading 10 μg of microsomal proteins. Gels were run at a constant 200 V. Protein bands were visualized by staining with Coomassie G-250 according to the manufacturer's procedure. Protein bands on the SDS-PAGE gel were transferred to an Immobilon P polyvinylidene difluoride membrane (Millipore) by the tank transfer method with 25 mM Tris-HCl (pH 8.8)-192 mM glycine-10% methanol at 100 V for 1 h. The membranes were blocked with detector block (Kirkegaard-Perry Laboratories). The wash buffer used was phosphate-buffered saline containing 0.05% Tween 20. The blots were probed with specific antibody prepared against CYP52A13, CYP52A17, or NCPA. Antibodies were prepared in sheep by The Binding Site (Birmingham, England) with synthetic antigenic peptides. The immune complexes were detected and visualized with anti-sheep immunoglobulin antibody conjugated to horseradish peroxidase (Kirkegaard-Perry Laboratories), and bound horseradish peroxidase was detected by chemiluminescence with the Lumiglo chemiluminescent substrate kit (Kirkegaard-Perry Laboratories). Chemiluminescence was detected with Kodak XOMAT X-ray film.
CYP and NCP activity in microsomes.
The concentration of functional cytochrome P450 monooxygenase in microsomes was determined by CO difference spectra (9). Samples of microsomes containing 1.5 to 2 mg of protein in 1 ml of 50 mM Tris-HCl, pH 8.0, in a stoppered cuvette were gently sparged with CO for 1 to 2 min, at which time several fine grains of solid sodium dithionite were added. Sparging was continued for 1 to 2 min more, and the cuvette was stoppered. Spectra (400 to 500 nm) were recorded on a Cary 1G UV-visible spectrophotometer with the Cary scanning application. The sample was scanned repeatedly; the maximum development of the difference spectrum occurred 5 to 10 min after addition of the dithionite.
Fatty acid ω-hydroxylation was determined by measuring the products formed from radioactive fatty acids that had been separated by thin-layer chromatography (26). Radioactivity in substrates and products was detected and quantitated with a Packard Instruments (Meriden, Conn.) InstantImager and the associated Image software package. Reaction mixtures, 250 μl in 1-ml glass screw-cap vials, contained 0.2 M potassium phosphate, pH 7.4; 0.5 mM NADPH; 0.5 mM dithiothreitol; an NADPH regeneration system consisting of 3 mM glucose-6 phosphate and 0.5 U of glucose-6-phosphate dehydrogenase; microsomal protein (<0.5 mg); and approximately 15 μM radioactive substrate (specific activity, 40 to 60 mCi/mmol). Reactions were initiated by incubating the vials at 35°C with shaking at 150 rpm. After 1 h, reactions were terminated by addition of 200 μl of 6 N HCl and extracted with 1 ml of diethyl ether. After the aqueous phase was frozen on dry ice, the ether layer was decanted into another vial and evaporated to dryness. The residue was resuspended in approximately 50 μl of ether, applied to a 1-mm silica gel plate, and developed with toluene-acetic acid (9:1). Conversion was calculated based on the fraction of total radioactivity detected in the lane and the total amount added to the reaction mixture to account for variation in recoveries. All substrates were soluble at the concentrations provided (7, 8).
Cytochrome P450 NADPH reductase activity was measured by the reduction of cytochrome c (11). The assay contained a stock reaction mixture of 40 mM potassium phosphate, pH 7.5, 32 mM nicotinamide, and 50 μM cytochrome c. The 1-ml reaction mixture contained 810 μl of the stock reaction mixture, 225 μM sodium cyanide, and 75 μM NADPH. The reaction mixture was equilibrated to 25°C. The protein was added to the reaction mixture in 1- to 10-μl volumes to start the measurement. The optical density was monitored at 550 nm with a Cary 1G UV-visible spectrophotometer. The Cary kinetics application was used to calculate the change in absorbance over 1 min with 0.1-s interval readings. The correction factor calculated for the data at 550 nm was 51 to give nanomoles of cytochrome c reduced.
RESULTS
Codon usage in C. tropicalis ATCC 20336 and its derivatives.
To determine the preferred interpretation of the codon CUG in C. tropicalis ATCC 20336 and its β-oxidation-blocked derivative, strain H5343 cells were grown in the presence of HOSFFA oleic acid to induce cytochrome P450 reductase (NCPA). The protein was partially purified by affinity chromatography on ADP-agarose. Upon elution with 2′-AMP, a single peak with the ability to reduce cytochrome c was detected. This fraction was demonstrated by Western analysis to contain NCPA (data not shown). The band attributable to NCPA was excised from a separate, Coomassie-stained gel and analyzed by MALDI-TOF mass spectrometry following tryptic digestion.
Seventeen peptides with masses corresponding to predicted peptides of NCPA were detected. The tryptic peptide deriving from the portion of NCPA encoded by the CUG codon would have the sequence DVLLTLK if it were transcribed with the universal genetic code, resulting in a peptide of MH+ = 801.50. If the CUG was transcribed as serine instead of leucine, the sequence would be DVLSTLK, and the expected MH+ would be 775.46. MALDI-TOF detected a peptide of MH+ = 775.26, but no peptide with a mass close to MH+ = 801 was seen. To confirm the assignment, two peptides were analyzed by tandem mass spectrometry, the MH+ = 775.26 peptide and, as further confirmation of the protein's identity, another peptide of MH+ = 931.9 (Table 2). The sequences of the peptides proved that the protein was indeed NCPA and, in conjunction with the failure to detect a MH+ = 801 peptide, established with certainty that the CUG codon was translated as serine.
TABLE 2.
Tandem mass spectrometry of peptides of mass 775 and 932
| Peptide no.a | Predicted massb | Observed mass | Predicted sequence | Observed sequence |
|---|---|---|---|---|
| 4 | 775.46 | 775.26 | DVLSTLK | DVLSTLK |
| 34 | 930.55 | 931.9 | LDTVIELK | LDTVIELK |
The peptide number refers to the order of the predicted tryptic peptide in the sequence of NCPA.
The predicted amino acid sequences are based on predicted tryptic peptides of NCPA that would generate a mass closest to that observed in the MALDI-TOF experiment. The peptides correspond to residues 47 to 53 and 328 to 335, respectively, of NCPA.
Expression of CYP52A13, CYP52A17, and NCPA in insect cells.
Both cytochrome P450 genes, CYP52A13 and CYP52A17, were cloned in conjunction with the cytochrome P450 reductase gene, NCPA, into the vector pFastBac Dual to allow coexpression of the proteins in insect cells (Table 1). Following production of a sufficiently concentrated viral titer, 1-liter fermentation cultures of Sf9 cells were infected in medium supplemented with heme precursors and harvested after 48 h. Microsomes prepared from these cells displayed positive reactions with antibodies specific for each protein (Fig. 2), indicating successful expression of all three proteins. Expression levels were modest, however, and unequivocal identification of the proteins as a band in Coomassie-stained gels was not possible. Also, two bands were observed in the antibody reaction of anti-NCPA antiserum with both preparations of microsomes, indicating either some degradation or modification of NCPA. Activity assays (reduction of cytochrome c) confirmed the expression of active NCPA (Table 3). Cytochrome c reduction was elevated greater than 50-fold over the basal level present in Sf9 cells infected with a bacmid which did not contain the NCPA gene.
FIG. 2.

Detection of C. tropicalis CYP and NCPA proteins. (A) Coomassie-stained proteins from microsomal fractions of cells expressing CYP52A13 and NCPA (lane 1), cells expressing CYP52A17 and NCPA (lane 2), and control cells (lane 3). (B) Western analysis of microsomal fractions from cells expressing CYP52A13 and NCPA probed with antibody specific for CYP52A13 (lane 1); CYP52A17 and NCPA probed with antibody specific for CYP52A17 (lane 2); and the samples in lanes 1 and 2 probed with antibody specific for NCPA (lanes 3 and 4, respectively). Molecular size standards were prestained, broad-range protein markers from New England Biolabs.
TABLE 3.
NCP activity of microsomes as measured by reduction of cytochrome ca
| Vector | NCPA gene | Cytochrome c reduction (μmol/min/mg of protein) |
|---|---|---|
| pFastBac Dual | − | 0.004 |
| pFBDncp2A | + | 0.304 |
| pFBDncp5A | + | 0.224 |
Cytochrome P450 reductase activity in insect cell microsomes was determined by reduction of cytochrome c (10). Vector constructs are described in Table 1.
Production of cytochrome P450 was quantified by reduced CO difference spectra (Table 4). A low background CO difference spectrum (ΔA450 − A490 = 0.0003) of control microsomes prepared from cells containing vector lacking a CYP52A gene was subtracted from the values determined for the cells expressing the C. tropicalis cytochrome P450s before calculation of the cytochrome P450 concentrations. Expression of CYP52A17 was approximately 50% better than for CYP52A13, a pattern we also observed in small-scale expression experiments conducted in shake flasks (data not shown). Both samples also possessed a significant peak at A420, approximately equal in size to the A450 nm peak, indicating possible deterioration of the cytochrome P450 (9).
TABLE 4.
Cytochrome P450 content of microsomesa
| Vector | CYP52A gene | ΔA450 − A490 | Concn of CYP52Ab (μM) |
|---|---|---|---|
| pFastBac Dual | None | 0.0003 | |
| pFBDncp2A | CYP52A13 | 0.0094 | 0.52 |
| pFBDncp5A | CYP52A17 | 0.0137 | 0.75 |
Cytochrome P450 content of microsomes was estimated by reduced CO difference spectra of microsomes treated with CO and dithionite as described in Materials and Methods. Vector constructs are described in Table 1.
The concentration of functional cytochrome P450 in the original, undiluted microsomal samples was calculated with an extinction coefficient of 91 mM−1 cm−1.
Oxidation of fatty acids by CYP52A13 and CYP52A17.
Microsomes containing the C. tropicalis cytochrome P450s were surveyed for their ability to oxidize a series of fatty acids (Fig. 3). Both enzymes oxidized C18 to C20 unsaturated fatty acids to similar extents, but CYP52A17 possessed higher activity toward shorter, saturated fatty acids. CYP52A13 displayed only marginal activity toward the saturated fatty acids. Control microsomes lacking the C. tropicalis cytochrome P450s did not oxidize any of the fatty acids tested (data not shown). Assays were shown to be linear with respect to protein concentration beyond the amount used in these experiments. With respect to percent conversion, however, assays were linear only up to 20%.
FIG. 3.

Oxidation of fatty acids by CYP52A13 and CYP52A17. The total percentage of fatty acids converted to the corresponding ω-hydroxy fatty acid and dicarboxylic acid by 60 μl of insect cell microsomes containing expressed CYP52A13 (light columns) and CYP52A17 (dark columns). The fatty acids evaluated were: C10, decanoic acid; C12, dodecanoic acid; C14, myristic acid; C16, palmitic acid; C18, stearic acid; C18:1, oleic acid; C18:2, linoleic acid; C20:1, icosenoic acid. Values were normalized to reflect conversion by the same amount of active CYP protein (0.045 nmol) based on CO difference spectra.
In order to keep the percent conversion below 20%, kinetic analysis of the conversion of myristic and oleic acids, representative saturated and unsaturated fatty acids, respectively, were performed with shorter incubations and less microsomal protein (Table 5). These results confirmed the pattern observed in the initial survey but revealed more clearly the higher activity of CYP52A17. CYP52A17 oxidized both substrates more rapidly than did CYP52A13, exhibiting two- to fivefold-higher Vmax values. The strong preference of CYP52A17 for shorter-chain, saturated fatty acids appeared to be based in part on its higher affinity for these substrates as well. Its Km value for myristic acid was three- to fourfold lower than its Km for oleic acid, or the Km of CYP52A13 for either substrate. Vmax/Km values for the different reactions highlighted this strong preference, being 10-fold greater than the other calculated values. These values also indicated that CYP52A17 possessed higher activity toward oleic acid than did CYP52A13 and confirmed the preference of CYP52A13 for oleic acid over saturated fatty acids.
TABLE 5.
Kinetic parameters of the CYP proteins toward myristic and oleic acidsa
| Protein | Substrate | Vmax (nmol/min/ nmol) | Km (μM) | Vmax/Km (min−1 μM−1) |
|---|---|---|---|---|
| CYP52A13 | Myristic acid | 1.27 (0.10) | 110 (34.5) | 0.012 |
| Oleic acid | 1.71 (0.13) | 84.2 (21.7) | 0.020 | |
| CYP52A17 | Myristic acid | 6.36 (0.49) | 23.5 (9.5) | 0.270 |
| Oleic acid | 3.38 (0.43) | 75.4 (29.9) | 0.045 |
Conversion rates were measured over 30 min for reactions in which 15% or less of the substrate was converted (linear range) at substrate concentrations of 25, 50, 100, 200, 400, and 800 μM. The values in parentheses are the standard error. The Vmax values were normalized for the amount of cytochrome P450 added based on the concentration estimated by reduced CO difference spectra.
Overoxidation of fatty acids by CYP52A13 and CYP52A17.
In some instances, ω-hydroxylating cytochrome P450s have been reported to oxidize their initially formed ω-hydroxy products further, generating diacids without the intervention of other enzymes (19). This overoxidation was also observed in the conversion of fatty acids by CYP52A13 and CYP52A17. Thin-layer chromatograms of reaction mixtures revealed that two products were formed in many of the oxidation reactions (Fig. 4). Comparison of the mobility of these products to that of authentic, nonradioactive standards revealed that the expected initial oxidation product, the ω-hydroxy fatty acid, was produced. However, the corresponding α,ω-dicarboxylic acid also accumulated. Overoxidation of ω-hydroxy fatty acids by cytochrome P450 has been documented previously (19) and is attributed to oxidation of the initially formed ω-hydroxy fatty acid to the corresponding fatty aldehyde and diacid (Fig. 5). We did not observe accumulation of the fatty aldehyde.
FIG. 4.
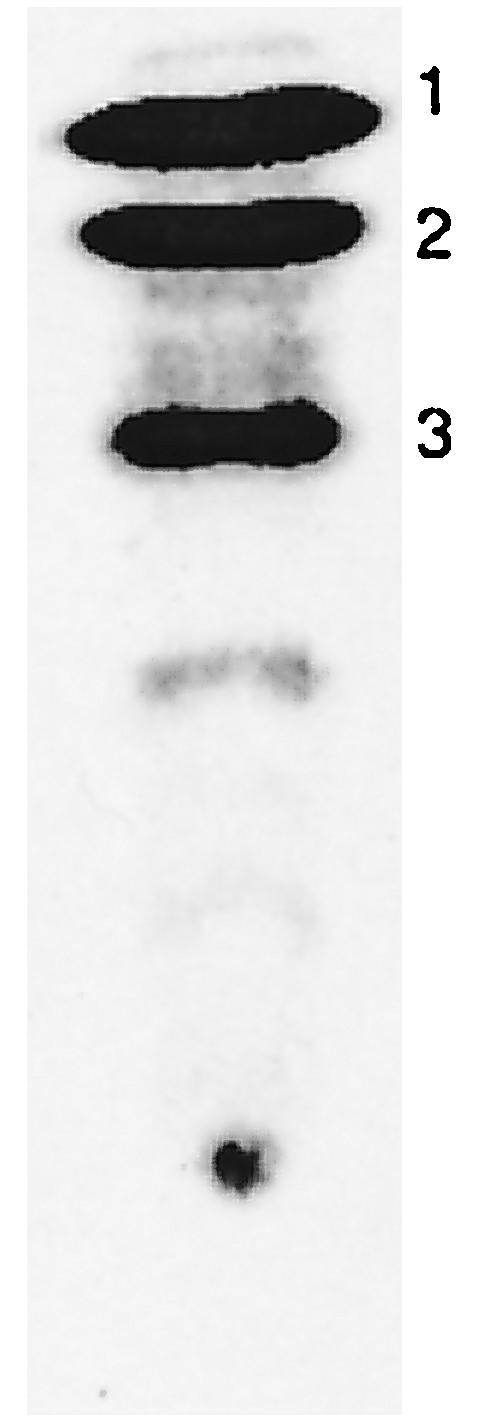
Products and substrate detected in conversion of fatty acids. Example of an autoradiogram of the reaction of myristic acid showing: 1, unreacted [14C]myristic acid; 2, the dicarboxylic acid formed from overoxidation of myristic acid; and 3, the initially formed ω-hydroxymyristic acid. The identification of the products was based on the relative mobilities of nonradioactive standards detected by chemical spray reagent. The trace bands below band 3 account for less than 1% of the total radioactivity and were not identified.
FIG. 5.

Postulated overoxidation of fatty acids by CYP proteins. Reactions of the overoxidation of fatty acids involve initial formation of the ω-hydroxy acid, followed by oxidation, which proceeds in a manner yet to be characterized. The postulated path shown requires NADPH-dependent conversion to the fatty aldehyde and the α,ω-dicarboxylic acid (19).
Both cytochrome P450s oxidized unsaturated fatty acids to the corresponding diacids, but only CYP52A17 oxidized saturated fatty acids to diacids (Fig. 6). The extent of oxidation of unsaturated fatty acids by CYP52A17 was greater than for saturated fatty acids. Replicate oxidations of myristic acid and oleic acid with lower amounts of CYP52A17 (to keep the overall conversion within the established linear range of the assay) confirmed these trends (Table 6). CYP52A13 overoxidized oleic acid, producing approximately equal amounts of the ω-hydroxy fatty acid and the diacid, but produced only ω-hydroxy myristic acid. CYP52A17 overoxidized both acids but oxidized oleic acid preferentially over myristic acid. For oleic acid, the diacid was the major product formed, accumulating at a rate nearly twice that of the ω-hydroxy oleic acid.
FIG. 6.

Distribution of oxidation products formed from fatty acid substrates. Products were formed from the conversion of fatty acids by 60 μl of microsomes containing either (A) CYP52A13 or (B) CYP52A17. In each case, the lighter columns in each figure represent the ω-hydroxy acid and the darker columns represent the diacid detected. Yields of products are reported as the percentage of the original substrate converted to the particular product. Both cytochrome P450s catalyzed overoxidation of the unsaturated fatty acids tested (C18:1 through C20:1), but only CYP52A17 overoxidized the saturated acids (C10 to C18). Values were normalized as described for Fig. 3.
TABLE 6.
Overoxidation of myristic and lauric acids by CYP proteinsa
| Protein | Substrate | Product (nmol/nmol of P450/h)
|
|
|---|---|---|---|
| ω-Hydroxy acid | Diacid | ||
| CYP52A13 | Myristic acid | 2.28 (0.14) | ND |
| Oleic acid | 4.04 (0.71) | 4.46 (1.81) | |
| CYP52A17 | Myristic acid | 14.24 (0.48) | 2.28 (0.11) |
| Oleic acid | 3.26 (0.26) | 7.06 (0.95) | |
Conversion of the substrates myristic acid and oleic acid to the ω-hydroxyacid and diacid products was determined based on the fraction of total radioactivity detected as each product and the concentration of functional cytochrome P450 used, based on the P450 concentration estimated by reduced CO difference spectra. The standard error of the mean is given in parentheses (n = 5). ND, not detected.
The possibility that complete oxidation to the diacid was caused by fatty alcohol oxidase and fatty aldehyde dehydrogenase activity present in the Sf9 host cell was investigated but ruled out. Microsomes prepared from Sf9 host cells lacking a CYP52 gene were added to microsomes containing CYP52A13, and the effect on oxidation of oleic acid was determined. No additional formation of diacid was observed, indicating that Sf9 host cell microsomes did not contain enzymes catalyzing the overoxidation. The absence of diacid formation in the conversion of saturated fatty acids by CYP52A13 also supported this interpretation.
DISCUSSION
The β-oxidation-blocked strain of C. tropicalis, H5343, represents an initial stage in the development of a process for the commercial production of dicarboxylic acids from renewable feedstocks. Mutation of the POX genes blocks β-oxidation and prevents the degradation of fatty acids and the corresponding diacids to intermediates of central metabolism. When cultured in the presence of HOSFFA fatty acids, long-chain dicarboxylic acids of potential commercial value accumulate. Under these conditions, two predominant cytochrome P450 monooxygenases of the CYP52 family, CYP52A13 and CYP52A17, are induced. Extracts from cells expressing these two enzymes support ω-hydroxylation, but until now the role of each enzyme was not known with certainty. The heterologous expression of each CYP in Sf9 insect cells lacking native CYP52 activity allowed the substrate preferences and relative activities of the two enzymes to be determined.
CYP52A13 was found to oxidize unsaturated fatty acids preferentially, efficiently converting oleic and linoleic acid, and, to a lesser extent, Δ11-icosenoic acid to the corresponding dicarboxylic acids. No significant oxidation of stearic acid (C18:0), the saturated homologue of oleic and linoleic acid, was observed. Saturated fatty acids with chain lengths of 10 through 16 were oxidized more slowly. In contrast, CYP52A17 preferentially oxidized these intermediate-chain-length fatty acids, displaying the highest conversion rate for myristic acid (C14:0). Again, stearic acid was oxidized only slightly. CYP52A17 was also considerably more active than CYP52A13, converting myristic acid at a maximum rate fivefold higher than that of CYP52A13. CYP52A17 converted unsaturated fatty acids more slowly than the shorter, saturated fatty acids but still faster than CYP52A13, by approximately twofold. For CYP52A17, the unsaturated fatty acids thus appeared to be alternatives to their preferred substrates.
The pattern of substrate preferences observed for CYP52A13 was similar to those reported previously for CYP52A3, CYP52A5, and CYP52A9 of Candida maltosa (27) in that all four preferentially oxidize oleic acid. The other C. maltosa enzymes, CYP52A4, CYP52A10, and CYP52A11, display a strong preference for short-chain fatty acids (25, 27). The specificity pattern of the C. tropicalis CYP52A17 differed from that of the other enzymes in that it converted the unsaturated fatty acids oleic and linoleic acids approximately half as efficiently as its preferred substrate, myristic acid (Fig. 3). The kinetic values determined here for the conversion of fatty acids by the C. tropicalis enzymes were comparable to those reported earlier for the C. maltosa enzymes (20); Vmax values from 1.3 to 6.4 nmol/min/nmol of cytochrome P450, Km values from 24 to 110 μM, and Vmax/Km values from 0.012 to 0.27 min−1 μM−1.
Some of the C. maltosa enzymes also convert alkanes efficiently (20, 25, 27). The ability of C. tropicalis CYP52A13 and CYP52A17 to oxidize alkanes was not determined in the present study. Based on comparisons of amino acid sequences, CYP52A13 is most closely related to the C. maltosa protein CYP52A5 and CYP52A17 is most closely related to the C. maltosa protein CYP52A9, as discussed in the companion paper in this issue (6).
For commercial production of dicarboxylic acids from oleic acid, amplification of either CYP52A13 or CYP52A17 could be expected to enhance diacid production. Factors other than the rate of conversion of oleic acid more likely will determine which enzyme is preferred. For the conversion of shorter, saturated fatty acids, CYP52A17 is clearly the more active enzyme with broader substrate specificity. CYP52A17 converted all fatty acids tested as fast as or faster than CYP52A13, with the exception of Δ11-icosenoic acid. Of the two enzymes, CYP52A17 would be preferred for amplification to enhance the production of diacids from saturated fatty acids or from mixtures containing various fatty acids.
Both CYP52 enzymes exhibited the ability to overoxidize fatty acids, catalyzing the oxidative cascade described previously for the C. maltosa alkane hydroxylating cytochrome P450s (19). In this process, the cytochrome P450s oxidize the fatty acids to the corresponding dicarboxylic acids without the involvement of fatty alcohol oxidase and fatty aldehyde dehydrogenase, the other enzymes of the ω-oxidation pathway (Fig. 1). Consistent with its generally higher activity, CYP52A17 overoxidized substrates to a greater extent than CYP52A13, generating diacid even from the saturated fatty acids, which CYP52A13 failed to overoxidize. Although overoxidation was observed in vitro, its contribution to the production of diacid in vivo is not known. If extensive, overoxidation could have either beneficial or detrimental effects. Overoxidation might enhance productivity simply by providing an additional route to the diacid, and further benefit might derive from bypassing oxidation of the fatty alcohol intermediate by fatty alcohol oxidase, a reaction that generates H2O2. On the other hand, each step catalyzed by the CYP52 enzymes consumes a molecule of NADPH (19); overoxidation would consume three equivalents of NADPH per fatty acid, possibly depleting pools of essential reducing equivalents and creating metabolic limitations.
The alleles to CYP52A13 and CYP52A17, designated CYP52A14 and CYP52A18, respectively, were cloned and sequenced in the study described in the companion paper in this issue (6). CYP52A14 is 96% identical and 98% similar to CYP52A13, with only 10 of 522 being significantly different. CYP52A18 is 95% identical and 98% similar to CYP52A17, with only 10 of 517 amino acids significantly different. It is anticipated that CYP52A14 and CYP52A18 will have activity patterns similar to those described here for their respective alleles. These genes, too, are thus available for amplification. In conjunction with metabolic analyses of cells under fermentation conditions, the substrate preferences and patterns of product formation determined here provide valuable guidance for metabolic engineering of C. tropicalis to improve its production of long-chain dicarboxylic acids from fatty acids.
Acknowledgments
We thank Rick Roncinske of Panvera-Invitrogen Discovery Screening for help in the baculovirus expression experiments.
This research was supported by U.S. Department of Commerce Advanced Technology Program grant 70NANB8H4033 to Cognis Corporation, Inc., and under interagency agreement through U.S. Department of Energy contract W-31-109-Eng-37.
The submitted manuscript has been created by the University of Chicago as operator of Argonne National Laboratory under contract no. W-31-109-ENG-38 with the U.S. Department of Energy. The U.S. Government retains for itself, and others acting on its behalf, a paid-up, nonexclusive, irrevocable worldwide license in said article to reproduce, prepare derivative works, distribute copies to the public, and perform publicly and display publicly, by or on behalf of the government.
REFERENCES
- 1.Alper, J. 1999. Engineering metabolism for commercial gains. Science 283:1625-1626. [DOI] [PubMed] [Google Scholar]
- 2.Anderson, K., and J. D. Wenzel. 23. May 2003. Fermentation process. U.S. patent 6,569,670.
- 3.Boswell, C. 2001. Bioplastics aren't the stretch they once seemed. Chem. Market. Rep. [Online.] http://www.metabolix.com/publications/articles.html.
- 4.Cameron, D. C., N. E. Altaras, M. L. Hoffman, and A. J. Shaw. 1998. Metabolic engineering of propanediol pathways. Biotechnol Prog. 14:116-125. [DOI] [PubMed] [Google Scholar]
- 5.Cameron, D. C., and F. W. Chaplen. 1997. Developments in metabolic engineering. Curr. Opin. Biotechnol. 8:175-180. [DOI] [PubMed] [Google Scholar]
- 6.Craft, D. L., K. M. Madduri, M. Eshoo, and C. R. Wilson. 2003. Identification and characterization of the CYP52 family of Candida tropicalis ATCC 20336, important for the conversion of fatty acids and alkanes to α,ω-dicarboxylic acids. Appl. Environ. Microbiol. 69:AEM 464-03, this issue. [DOI] [PMC free article] [PubMed] [Google Scholar]
- 7.Danielsson, I. 1955. Association equilibria in solutions of alkali salts of straight chain acids. II. Salts of monocarboxylic acids. Acta Chem. Scand. 9:1671-1673. [Google Scholar]
- 8.Danielsson, I., and P. Ekwall. 1955. Association equilibria in solutions of alkali salts of straight chain acids. I. Salts of monocarboxylic acids. Acta Chem. Scand. 9:1661-1670. [Google Scholar]
- 9.Estabrook, R., and J. Werringloer. 1978. The measurement of difference spectra: application to the cytochromes of microsomes. Methods Enzymol. 52:212-220. [DOI] [PubMed] [Google Scholar]
- 10.Ho, S. N., H. D. Hunt, R. M. Horton, J. K. Pullen, and L. R. Pease. 1989. Site-directed mutagenesis by overlap extension with the polymerase chain reaction. Gene 77:51-59. [DOI] [PubMed] [Google Scholar]
- 11.Honeck, H., W. H. Schunck, P. Riege, and H. G. Muller. 1982. The cytochrome P-450 alkane monooxygenase system of the yeast Lodderomyces elongisporus: purification and some properties of the NADPH-cytochrome P-450 reductase. Biochem. Biophys. Res. Commun. 106:1318-1324. [DOI] [PubMed] [Google Scholar]
- 12.Hood, S. R., G. Shah, and P. Jones. 1994. Expression of cytochrome P450 in a baculovirus system. Methods Mol. Biol. 107:203-218. [DOI] [PubMed] [Google Scholar]
- 13.Miller, L. K. 1988. baculoviruses as gene expression vectors. Annu. Rev. Microbiol. 42:177-199. [DOI] [PubMed] [Google Scholar]
- 14.Ohama, T., T. Suzuki, M. Mori, S. Osawa, T. Ueda, K. Watanabe, and T. Nakase. 1993. Non-universal decoding of the leucine codon CUG in several Candida species. Nucleic Acids Res. 21:4039-4045. [DOI] [PMC free article] [PubMed] [Google Scholar]
- 15.O'Reilly, D. R., L. K. Miller, and V. A. Luckow. 1992. baculovirus expression vectors. W. H. Freeman and Company, New York, N.Y.
- 16.Picataggio, S., T. Rohrer, K. Deanda, D. Lanning, R. Reynolds, J. Mielenz, and L. D. Eirich. 1992. Metabolic engineering of Candida tropicalis for the production of long-chain dicarboxylic acids. Bio/Technology (N.Y.) 10:894-898. [DOI] [PubMed] [Google Scholar]
- 17.Picataggio, S., T. Rohrer, and L. D. Eirich. 15. July 1997. Method for increasing the omega-hydroxylase activity in Candida tropicalis. U.S. patent 5,648,247.
- 18.Sanglard, D., and J. C. Loper. 1989. Characterization of the alkane-inducible cytochrome P450 (P450alk) gene from the yeast Candida tropicalis: identification of a new P450 gene family. Gene 76:121-136. [DOI] [PubMed] [Google Scholar]
- 19.Scheller, U., T. Zimmer, D. Becher, F. Schauer, and W. H. Schunck. 1998. Oxygenation cascade in conversion of n-alkanes to alpha, omega-dioic acids catalyzed by cytochrome P450 52A3. J. Biol. Chem. 273:32528-32534. [DOI] [PubMed] [Google Scholar]
- 20.Scheller, U., T. Zimmer, E. Kargel, and W. H. Schunck. 1996. Characterization of the n-alkane and fatty acid hydroxylating cytochrome P450 forms 52A3 and 52A4. Arch. Biochem. Biophys. 328:245-254. [DOI] [PubMed] [Google Scholar]
- 21.Stephanopoulos, G., and R. T. Gill. 2001. After a decade of progress, an expanded role for metabolic engineering. Adv. Biochem. Eng. Biotechnol. 73:1-8. [DOI] [PubMed] [Google Scholar]
- 22.Sugita, T., and T. Nakase. 1999. Non-universal usage of the leucine CUG codon and the molecular phylogeny of the genus Candida. Syst. Appl. Microbiol. 22:79-86. [DOI] [PubMed] [Google Scholar]
- 23.Sutter, T. R., D. Sanglard, J. C. Loper, and D. Sangard. 1990. Isolation and characterization of the alkane-inducible NADPH-cytochrome P-450 oxidoreductase gene from Candida tropicalis. Identification of invariant residues within similar amino acid sequences of divergent flavoproteins. J. Biol. Chem. 265:16428-16436. [PubMed] [Google Scholar]
- 24.Suzuki, T., T. Ueda, and K. Watanabe. 1997. The "polysemous' codon-a codon with multiple amino acid assignment caused by dual specificity of tRNA identity. EMBO J. 16:1122-1134. [DOI] [PMC free article] [PubMed] [Google Scholar]
- 25.Zimmer, T., T. Iida, W. H. Schunck, Y. Yoshida, A. Ohta, and M. Takagi. 1998. Relation between evolutionary distance and enzymatic properties among the members of the CYP52A subfamily of Candida maltosa. Biochem. Biophys. Res. Commun. 251:244-247. [DOI] [PubMed] [Google Scholar]
- 26.Zimmer, T., K. Kaminski, U. Scheller, F. Vogel, and W. H. Schunck. 1995. In vivo reconstitution of highly active Candida maltosa cytochrome P450 monooxygenase systems in inducible membranes of Saccharomyces cerevisiae. DNA Cell Biol. 14:619-628. [DOI] [PubMed] [Google Scholar]
- 27.Zimmer, T., M. Ohkuma, A. Ohta, M. Takagi, and W. H. Schunck. 1996. The CYP52 multigene family of Candida maltosa encodes functionally diverse n-alkane-inducible cytochromes P450. Biochem. Biophys. Res. Commun. 224:784-789. [DOI] [PubMed] [Google Scholar]