

Abstract
We investigated communities of denitrifying bacteria from adjacent meadow and forest soils. Our objectives were to explore spatial gradients in denitrifier communities from meadow to forest, examine whether community composition was related to ecological properties (such as vegetation type and process rates), and determine phylogenetic relationships among denitrifiers. nosZ, a key gene in the denitrification pathway for nitrous oxide reductase, served as a marker for denitrifying bacteria. Denitrifying enzyme activity (DEA) was measured as a proxy for function. Other variables, such as nitrification potential and soil C/N ratio, were also measured. Soil samples were taken along transects that spanned meadow-forest boundaries at two sites in the H. J. Andrews Experimental Forest in the Western Cascade Mountains of Oregon. Results indicated strong functional and structural community differences between the meadow and forest soils. Levels of DEA were an order of magnitude higher in the meadow soils. Denitrifying community composition was related to process rates and vegetation type as determined on the basis of multivariate analyses of nosZ terminal restriction fragment length polymorphism profiles. Denitrifier communities formed distinct groups according to vegetation type and site. Screening 225 nosZ clones yielded 47 unique denitrifying genotypes; the most dominant genotype occurred 31 times, and half the genotypes occurred once. Several dominant and less-dominant denitrifying genotypes were more characteristic of either meadow or forest soils. The majority of nosZ fragments sequenced from meadow or forest soils were most similar to nosZ from the Rhizobiaceae group in α-Proteobacteria species. Denitrifying community composition, as well as environmental factors, may contribute to the variability of denitrification rates in these systems.
In addition to ameliorating eutrophication and removing excess nitrate (NO3−) from drinking water, the process of denitrification can limit primary productivity and contribute to global warming through the formation of nitrous oxide (N2O). Despite the essential role of denitrification in the global nitrogen (N) cycle, little is known about how denitrifying community structure relates to denitrification rates in natural environments. Examining this relationship may improve understanding of denitrification and provide insights into the functional role of microbial diversity.
Denitrifying bacteria are defined solely by the ability to reduce NO3− or nitrite (NO2−) to N2O or N2 in the absence of oxygen. Denitrification is not specific to any one phylogenetic group; the trait is found in about 50 genera, mostly in the Proteobacteria species (48). Therefore, to analyze denitrifier diversity, functional genes (such as those coding for NO2− reductase [nirK and nirS] and N2O reductase [nosZ]) in the denitrification pathway have been retrieved (using PCR and cloning and sequencing) from environmental samples (4, 36, 39). Denitrifier community profiles have been generated using PCR-coupled terminal restriction fragment length polymorphisms (T-RFLPs) (1, 3, 40). Avrahami et al. (1) recently found that denitrifying community composition was related to ammonium (NH4+) addition and enhanced N2O emissions from soil.
Plant communities presumably have strong effects on belowground microbial community structure (18, 32). Therefore, we investigated denitrifying soil communities from two broadly contrasting plant communities of meadow vegetation and adjacent coniferous forest in the Western Cascade Mountains of Oregon. We hypothesized that because these vegetation types likely differed in soil N cycling processes, denitrifier communities would also differ. Differences in N cycling were assumed because the net production of NO3− is higher in analogous meadow soils than in coniferous forests (5, 14). Although factors leading to vegetation differences are complex (21, 25), annual turnover and higher concentrations of N in meadow plant tissue likely contribute to differences in N cycling (12, 28).
The objective of this study was to examine spatial variation in denitrifier communities and N cycling processes from adjacent meadow and forest soils. We used standard activity assays to confirm that N cycling processes differed between meadow and forest soils. Community composition was measured with T-RFLP profiles of the nosZ fragment analyzed by Rösch et al. (36). We assessed relationships between denitrifier communities and functioning with multivariate techniques, and we investigated phylogenetic relationships among nosZ clones. Recently, Mintie et al. (26) examined nitrifying populations from the same soils.
MATERIALS AND METHODS
Site characteristics and sampling.
Study sites were located at the H. J. Andrews Experimental Forest (44.2°N, 122.2°W) in the Western Cascade Mountains of Oregon. We examined two montane sites (referred to here as Carpenter and Lookout) with adjacent meadow and forest vegetation and similar soils. Details of the study sites have been reported elsewhere (26, 35).
At each site, soil samples were taken along three replicate transects, which were distributed throughout sites at a distance of at least 20 m from each another. Transects ran perpendicularly to the meadow-forest boundary and consisted of eight evenly spaced sampling points, four in the forest and four in the meadow. Sampling points were spaced at 20-m intervals at Carpenter and 10-m intervals at Lookout, with larger spacing at Carpenter to account for the wider meadow-to-forest transition at this site. We sampled the mineral soil under the organic humus layer (at a depth of 0 to 10 cm) by compositing five replicate soil cores (inner diameter, 6 cm) at each sampling point within a 0.5-m radius. A total of 48 field replicate samples (i.e., 48 sample units) were taken on 26 June 2000. The soil was brought back to the laboratory on ice, stored at 4°C, and sieved (4.75-mm-pore-size mesh) about 24 h after sampling. Soil for DNA extractions was immediately frozen at −20°C after sieving. Soil for the denitrification potential measurement was kept at 4°C until analysis was performed (within 72 h after sampling). Basic characteristics of the transect soil samples are shown in Table 1. Total soil carbon (C) and N were measured on a dry-weight basis by combustion.
TABLE 1.
Properties of the mineral soil from the H. J. Andrews meadow-to-forest transects (mean of 0- to 10-cm depth)
| Measurement | Value for Carpenter site
|
Value for Lookout site
|
Reference or source | ||
|---|---|---|---|---|---|
| Meadow | Forest | Meadow | Forest | ||
| pH | 5.8 | 5.2 | 5.6 | 5.1 | 26 |
| Total C (g of C kg−1 of dry soil) | 94.7 | 131.8 | 115.9 | 142.3 | This study |
| Total N (g of N kg−1 of dry soil) | 6.8 | 5.8 | 9.3 | 9.2 | This study |
| C:N | 13.8 | 22.8 | 12.7 | 15.7 | This study |
| Nitrate (mg of N kg−1 of dry soil)a | 2.9 | 1.5 | 3.5 | 1.9 | This study |
| Ammonium (mg of N kg−1 of dry soil) | 4.6 | 1.4 | 2.6 | 1.7 | This study |
| Net nitrification (mg of N kg−1 of dry soil day−1)b | 2.60 | 0.04 | 2.15 | 0.20 | This study |
| Net ammonification (mg of N kg−1 of dry soil day−1) | −0.42 | 0.43 | −0.20 | 0.79 | This study |
| Net N mineralization (mg of N kg−1 of dry soil day−1) | 2.18 | 0.47 | 1.96 | 0.99 | 26 |
| Nitrification potential (mg of N kg−1 of dry soil day−1) | 8.90 | 0.26 | 8.67 | 0.74 | 26 |
| DEA (mg of N kg−1 of dry soil day−1) | 0.78 | 0.04 | 1.58 | 0.17 | This study |
Denitrification potentials.
Denitrification potential (or denitrifying enzyme activity [DEA]) measurements were carried out following the method of Tiedje (45). Fresh soil (10 g) was added to 125-ml Erlenmeyer flasks with 25 ml of a solution containing glucose (10 mM), NO3− (5 mM), and phosphate buffer (pH 7.0) (50 mM). The flasks were sealed with neoprene stoppers and made anaerobic by repeated evacuation and flushing with Ar. Standard-grade acetylene was purified through an acid trap (13) and added to the headspace (10% [vol/vol]). The flasks were incubated at 250 rpm and 21°C on a rotary shaker. Gas samples (4 ml) were taken at 15 and 75 min and stored in Vacutainers (3 ml) until gas chromatography analysis of N2O levels was performed using a 63Ni electron capture detector (27). Production of N2O was linear (as determined on the basis of analysis of a subset of flasks sampled every 15 min) during the 15- to 75-min interval (data not shown). Statistical differences in DEA were assessed using two-factor analysis of variance (ANOVA) for site and vegetation type (SAS software, version 7.0).
nosZ PCR and T-RFLPs.
PCR was used to generate 700-bp nosZ fragments from the soil-denitrifying community. Designed in 1999 on the basis of available sequence data and the work of Scala and Kerkhof (41), our nosZ primers are almost identical to those independently developed by Rösch et al. (36). Our primer sequences were as follows: 5′-CGCTGTTCITCGACAGYCAG-3′ (bold characters represent nucleotides that differ from those in the sequence presented in reference 36) for the forward primer (nosZ-F-1181) and 5′-ATGTGCAKIGCRTGGCAGAA-3′ for the reverse primer (nosZ-R-1880) (I, inosine; Y, T and C; K, T and G; R, A and G). Numbers included in primer designations indicate nucleotide positions at the ends of the Pseudomonas stutzeri 700-bp nosZ fragment (GenBank accession no. M22628).
DNA was extracted from soil samples (fresh weight, 0.3 g) or pure cultures using a FastDNA kit (Bio 101, Inc.) for bacterial cells or soil according to the manufacturer's instructions. DNA extracts were checked on agarose gels (1.1%) stained with ethidium bromide (0.5 μg ml−1). The DNA was quantified using a DNA TKO 100 fluorometer (Hoefer Scientific) with a calf thymus DNA standard. Reaction mixtures (50 μl) contained soil DNA (100 ng), AmpliTaq DNA polymerase (2.5 U), GeneAmp PCR buffer (1×), MgCl2 (2 mM), deoxynucleoside triphosphates (0.2 mM each), forward and reverse primers (0.2 μM each), and bovine serum albumin (0.064 g ml−1). The forward primer was fluorescently labeled with 6-Fam (6-carboxyfluorescein). For PCR amplification of soil DNA, the temperature profile on a PTC-100 hot bonnet thermocycler (MJ Research, Inc.) was 94°C for 3 min and 25 cycles of 94°C (45 s), 56°C (1 min), and 72°C (2 min) followed by a final extension of 72°C for 7 min. For each sample, the PCR products of three reactions were pooled and purified using a QIAquick PCR purification kit (Qiagen) according to the manufacturer's instructions. PCR products were checked using agarose gels stained with ethidium bromide. Fluorescently labeled PCR products were quantified on an ABI Prism 3100 Genetic Analyzer (Applied Biosystems, Inc.) with a known concentration of a 6-Fam-labeled nosZ fragment obtained from the amplification of P. stutzeri DNA.
Samples for T-RFLP analysis consisted of approximately 1 ng of fluorescently labeled nosZ PCR products (digested at 37°C in 25-μl aliquots with 6.25 U of restriction endonuclease for 3 h) followed by heat inactivation at 65°C for 15 min. Three T-RFLP profiles were generated per sample unit in separate reactions with the endonucleases CfoI (an isoschizomer of HhaI), MspI, and RsaI (Roche Co.). Restriction digests (20 μl) were purified using a Sephadex G-50 column (Amersham Bioscience) and dried as pellets in a SpeedVac centrifuge. Dried pellets were rehydrated with Hi-Di formamide (9.92 μl) and an X-rhodamine MapMarker 1000 (0.08 μl) internal lane size standard. The mixture was heated at 96°C for 3 min and cooled on ice for 5 min prior to running of the samples in 96-well microtiter plates on an ABI Prism 3100 Genetic Analyzer with an injection time of 22 s, a run time of 54 min, and a 36-cm-long capillary array containing ABI Prism 3100 POP-4 polymer.
Analysis of T-RFLP data.
Sizes and relative abundances of terminal restriction fragments (T-RFs) were quantified using GeneScan version 3.5 software (Applied Biosystems, Inc.). T-RFs with signals above a detection limit of 10 relative fluorescent units were summed for each profile; only fragments with a signal above 1.5% of the sum of all peaks were included in the analyses. The peak areas of T-RFs that differed in size by ≤1.5 bp in an individual profile were summed and considered as one fragment. Sequencing of clones indicated that almost all individual T-RFs with this variation were the same size (in base pairs). Each fragment was expressed as a percentage of the total peak area for all peaks in a profile (i.e., proportional abundance) or scored as either present or absent.
PC-ORD version 4.01 software (B. McCune and M. J. Mefford, PC-ORD for Windows: multivariate analysis of ecological data, 4.01 ed, MjM Software, Gleneden Beach, Oreg., 1999) was used for all multivariate statistical analyses of the nosZ T-RFLP profiles. Differences in community composition were assessed graphically using the ordination method of nonmetric multidimensional scaling (NMS) calculated on the basis of Sørensen's distance (19, 23). NMS axes summarize community relatedness among samples on the basis of distance measure and rank transformation (23). NMS was constrained to two ordination axes, with a random starting configuration, 300 iterations, an instability criterion of 0.0001, and 40 runs with the real data and 50 runs with randomized data; Monte Carlo tests of the real data versus the randomized data were used to assess axis significance. Functional variables (e.g., DEA and nitrification potential) were correlated with the NMS axes to evaluate relationships between overall community composition and functioning. Individual T-RFs were also correlated with NMS axes (35). Nitrification potential and DEA values were log10 transformed for the correlation analysis, because the rates differed by an order of magnitude. Correlation coefficients between functional variables and NMS axes were displayed as vectors radiating from the center of the plot. Each vector was calculated as the hypotenuse of a right triangle, with each side of the triangle representing the correlation coefficient of the activity represented by axes one and two (23). The vector angle was a function of the relative proportions between the correlation coefficients (23). A multiresponse permutation procedure (MRPP) using Sørensen's distance and rank transformation was used to test for significant differences in community composition between groups defined by vegetation type and site (23, 24). The MRPP A statistic represents effect size or within-group relatedness relative to that expected by chance alone and is somewhat analogous to an r2 value (23). To identify T-RFs that differentiated denitrifier communities by vegetation type and site, indicator species analysis (7) was run with 1,000 randomizations in the Monte Carlo test.
nosZ cloning, screening, and sequencing.
nosZ fragments generated from the PCR of soil DNA were cloned using a pGEM-T Easy Vector system (Promega) according to the manufacturer's instructions. Template DNAs for the PCR were pooled from two representative samples of each vegetation type. The PCR was run as described above except with 30 cycles. Prior to cloning, the 700-bp nosZ fragments were excised from an agarose gel and purified (Qiagen). Clones were screened using CfoI, MspI, and RsaI T-RFLPs as described above for direct soil profiles (defined here as T-RFLP profiling). Genotypic diversity was analyzed using species area curve analysis (treating a unique nosZ clone as a species) as implemented in PC-ORD version 4.01 software (McCune and Mefford, PC-ORD for Windows). Species area curve analysis consisted of randomly subsampling the clone library data set 500 times at each level of clone screening, which is analogous to generating rarefaction curves.
Plasmids were prepared using QIAprep Minipreps (Qiagen) according to the manufacturer's instructions. Both strands of the nosZ fragment were sequenced (using the SP6 and T7 promoter primers flanking the PCR insert in the plasmid) for 34 clones. Sequencing reactions were done with ABI Prism BigDye terminator cycle sequencing and the samples were analyzed on an ABI Prism 3100 Genetic Analyzer.
nosZ phylogenetic analyses.
Analyses of nosZ sequences were carried out for the translated amino acid sequences by using PHYLIP version 3.573 software (J. Felsenstein, PHYLIP [phylogeny inference package], Department of Genetics, University of Washington, Seattle, 1993 [distributed by the author]) and TREE-PUZZLE version 5.0 software (42). With the use of the method of Friedrich (8), nosZ sequences (with the exception of that of Ralstonia eutropha ATCC 17699 [9]) were selected from cultured strains if their phylogenetic position could be confirmed using publicly available strain-specific small-subunit (SSU) rRNA sequence data and the Ribosomal Database Project's hierarchy browser and sequence matching tool (22). Amino acid sequences of nosZ were aligned using Clustal_X (44), excluding residues corresponding to the primer sequences. Distance, parsimony, and maximum likelihood methods were used to infer phylogenetic relationships. Dayhoff's 001 substitution matrix (6) was used to measure evolutionary distance with PROTDIST (PHYLIP) software, and trees were constructed using the neighbor-joining algorithm (PHYLIP). PROTPARS (PHYLIP) software was used for parsimony and TREE-PUZZLE software was applied for maximum likelihood analysis, using the JTT (15) amino acid substitution matrix for evolutionary distance. Bootstrap analysis of 1,000 replicates was carried out for neighbor-joining trees and of 500 replicates was carried out for parsimony trees (PHYLIP).
Nucleotide sequence accession numbers.
The GenBank accession numbers of the H. J. Andrews nosZ sequences are AY259180 to AY259212.
RESULTS
Denitrification potentials.
Strong functional differences were found between meadow and forest soils at the two sites (Table 1 and Fig. 1). DEA was generally an order of magnitude higher in the meadow than in the forest. This difference was highly significant at both sites (P < 0.0001 for vegetation type [two-factor ANOVA]). The DEA levels (in units of nanograms of N gram−1 of dry soil h−1 [mean ± 1 standard error; n = 12]) of the meadow soils were 32.4 ± 7.1 for Carpenter and 66.0 ± 19.4 for Lookout; the forest soils were 1.6 ± 0.5 for Carpenter and 7.0 ± 1.4 for Lookout. DEA showed a weak tendency to be higher at Lookout (P = 0.07 for site [two-factor ANOVA]). The mean activity along the transects only changed significantly after the meadow-forest boundary (Fig. 1) was crossed.
FIG. 1.

Spatial variation of DEA in adjacent meadow and forest soils in the H. J. Andrews Experimental Forest. Bars represent the mean ± 1 standard error for each position along replicate transects at the Carpenter site (closed columns) and Lookout site (open columns) (n = 3). The distance between transect positions was 20 m at Carpenter and 10 m at Lookout (see Materials and Methods).
Amplification of nosZ from pure cultures and soil DNA.
The nosZ primers amplified the expected fragment from five positive controls possessing nosZ, including Paracoccus denitrificans ATCC 17741, R. eutropha ATCC 17699, “Achromobacter cycloclastes” ATCC 21921, P. stutzeri ATCC 14405, and Pseudomonas aeruginosa. The primers did not amplify DNA from two negative controls lacking nosZ (Serratia marcescens and Burkholderia cepacia cep31T [group I]). Yields of DNA extracted from the H. J. Andrews soil ranged from 7 to 35 μg of DNA g−1 of dry soil. The PCR products that were amplified from the soil DNA were of the expected size (700 bp). Of the 48 field replicates, 3 were excluded from subsequent analyses because of poor PCR amplification.
nosZ T-RFLP profiles.
Each nosZ T-RFLP profile from the H. J. Andrews soil consisted of one or two dominant T-RFs and several less-dominant T-RFs. Overall, a total of 61 T-RFs were detected, with 14 to 24 T-RFs for each endonuclease (Table 2). Of the 61 T-RFs, 4 (i.e., a 357-bp T-RF detected using CfoI, a 111- to 112-bp T-RF detected using MspI, and 666- and 700-bp T-RFs detected using RsaI), comprising 58% of the mean total fragment abundance of each profile, were dominant. These four were the only T-RFs that occurred in all samples. The rest of the T-RFs comprised a mean of 2 to 12% of the total fragment abundance of each profile and occurred in 2 to 98% of the samples; of these, 21 T-RFs occurred only once. Each endonuclease produced a mean of 2.7 to 7.1 T-RFs per profile, depending on the endonuclease, vegetation type, and site (Table 2). CfoI and RsaI tended to produce more fragments than MspI (Table 2). Meadow samples tended to have slightly more fragments in each profile on average, but this result was inconsistent among endonucleases and sites (Table 2).
TABLE 2.
Number of T-RFs in the nosZ T-RFLP profiles of H. J. Andrews soils
| Site and vegetation type | na | No. of CfoI T-RFs
|
No. of MspI T-RFs
|
No. of RsaI T-RFs
|
No. of combined T-RFLPs
|
||||
|---|---|---|---|---|---|---|---|---|---|
| Total | Mean (SE) | Total | Mean (SE) | Total | Mean (SE) | Total | Mean (SE) | ||
| Carpenter | |||||||||
| Meadow | 12 | 12 | 7.1 (0.4) | 6 | 4.2 (0.2) | 13 | 4.9 (0.3) | 31 | 16.2 (0.7) |
| Forest | 10 | 11 | 5.7 (0.5) | 10 | 4.2 (0.5) | 10 | 5.0 (0.2) | 31 | 14.9 (1.1) |
| Lookout | |||||||||
| Meadow | 12 | 15 | 6.9 (0.6) | 8 | 3.3 (0.4) | 15 | 6.0 (0.7) | 38 | 16.2 (1.4) |
| Forest | 11 | 11 | 5.1 (0.2) | 5 | 2.7 (0.2) | 7 | 4.5 (0.2) | 23 | 12.4 (0.4) |
| Total | 45 | 24 | 6.2 (0.3) | 14 | 3.6 (0.2) | 23 | 5.1 (0.2) | 61 | 15.0 (0.5) |
n, total number of field replicates analyzed.
Differences in nosZ distribution and functional relationships.
Denitrifying community composition differed significantly according to vegetation type and site (Fig. 2 and Table 3). MRPP A statistic values of about 0.3 (Table 3) reflect strong differences between groups (23). Differences determined on the basis of the proportional abundance of or the presence or absence of nosZ T-RFs were evident (Table 3). Four groups (corresponding to vegetation type and site) were determined on the basis of proportional abundance levels (Fig. 2). Differences by site (as determined on the basis of the presence or absence of nosZ T-RFs) were less apparent for the forest samples (Table 3). NMS values for axes one and two were statistically significant (P = 0.02). Differences between vegetation type and site were also found by analyzing separate CfoI, MspI, or RsaI T-RFLP profiles, but these differences were not as strong as those seen for the combined profiles and relationships between vegetation type and site differed somewhat depending on the endonuclease used (data not shown). Ordination plots of CfoI profiles appeared most similar to the combined profile plots.
FIG. 2.

NMS ordination of denitrifying community composition determined on the basis of proportional abundance of T-RFs in combined CfoI, MspI, and RsaI nosZ T-RFLP profiles. Points represent meadow-to-forest transect samples. The percentage of variation represented by each axis is shown in parentheses next to the axis name. Vectors show the directions and relative magnitudes of correlation coefficients (r2) between NMS axes and functional variables; r2 values (in the order r2 of axis 1, r2 of axis 2) for the correlation between the functional variable and axis one or two are shown in parentheses. Nitrification, log10 of nitrification potential; denitrification, log10 of DEA; C:N, soil carbon-to-nitrogen ratio; NH4+ accumulation, net NH4+ production (i.e., ammonification).
TABLE 3.
Results of MRPP testing for significant differences between predefined groups determined on the basis of nosZ T-RFLP profiles (CfoI, MspI, and RsaI results have been combined)
| Test and sites |
A statistica
|
|
|---|---|---|
| Difference in proportional abundance | Difference in presence vs absence | |
| Comparison by vegetation type | ||
| Carpenter meadow vs Carpenter forest | 0.29 (P < 10−5) | 0.23 (P < 10−5) |
| Lookout meadow vs Lookout forest | 0.26 (P < 10−5) | 0.34 (P < 10−5) |
| Comparison by site | ||
| Carpenter meadow vs Lookout meadow | 0.18 (P < 0.001) | 0.17 (P < 0.001) |
| Carpenter forest vs Lookout forest | 0.24 (P < 10−5) | 0.05 (P = 0.02) |
| Comparison of randomized datab | ||
| Carpenter meadow vs Carpenter forest | −0.04 (P = 1.0) | −0.01 (P = 0.7) |
The A statistic measures within-group relatedness compared to that expected by chance; A statistic values of about 0.3 reflect strong differences between groups (23).
T-RFLP profiles from the Carpenter site were randomized among sample units.
Functional variables were related to denitrifying community composition by plotting the relative magnitudes and directions of correlation coefficients (r2) between NMS axes and functional variables (Fig. 2). Examples of the strongest correlates are shown in Fig. 2. Nitrification potential and DEA were correlated with axis one in the direction of meadow samples (Fig. 2). Nitrification potentials and DEA levels were substantially higher in meadow than in forest soils (Table 1). DEA was also correlated with axis two in the direction of the Lookout meadow (Fig. 2). Net nitrification gave correlation coefficients almost identical to those for nitrification potentials (data not shown). Accumulation of NH4+ (i.e., net ammonification) was correlated with axis one in the direction of forest samples (Fig. 2). Soil C/N ratios were correlated with axis one and two in the direction of Carpenter forest, where C/N ratios were highest (Fig. 2 and Table 1).
Individual nosZ T-RFs.
The RsaI 666-bp T-RF level declined in proportional abundance from meadow to forest, whereas 700-bp RsaI T-RF levels increased from meadow to forest (Fig. 3). RsaI 666- and 700-bp T-RF levels were most strongly correlated with axis one (shown in the NMS plot in Fig. 2). CfoI 454-bp T-RF was found in every meadow sample but in none of the forest samples except for those taken near the boundary at Lookout (Fig. 3). Conversely, RsaI 451-bp T-RF was found preferentially in the forest (Fig. 3). In NMS plots calculated on the basis of the presence or absence of nosZ T-RFs (data not shown), CfoI 454-bp and RsaI 451-bp T-RF levels were most strongly correlated with axis one.
FIG. 3.

Spatial variations of some key nosZ T-RFs from adjacent meadow and forest soils in the H. J. Andrews Experimental Forest. Bars represent the mean ± 1 standard error for each position along replicate transects at the Carpenter site (closed columns) and the Lookout site (open columns) (n = 3 for all positions except n = 2 for position 5 at Lookout and positions 6 and 8 at Carpenter). Each panel shows the results for an individual T-RF (identified by the corresponding restriction endonuclease and fragment size). The distance between transect positions was 20 m at Carpenter and 10 m at Lookout (see Materials and Methods).
Indicator species analysis was used to further identify the T-RFs that were more prevalent according to either vegetation type or site (Fig. 4). This procedure examines the relative abundance and presence or absence of individual T-RFs in a predefined group compared to those expected to occur by chance (23). A total of 29 significant indicator T-RFs (P < 0.05) were found. In recognition of the several-orders-in-magnitude range in proportional abundance, T-RFs are shown in Fig. 4 on a log10 scale to allow for inspection of less-abundant T-RFs. On this scale, relatively large differences in the proportional abundance of more dominant fragments appear smaller (Fig. 4).
FIG. 4.

nosZ T-RFs that differed significantly according to vegetation type or site as determined on the basis of indicator species analysis (P < 0.05). Each panel is labeled with the name of the restriction endonuclease used to generate the T-RFs. T-RFs marked with an asterisk (*) were present in sequenced nosZ clones.
nosZ clones.
Among 225 clones, 47 nosZ genotypes were identified on the basis of the CfoI, MspI, and RsaI T-RFLP profiles of each clone. Two-thirds of the library consisted of clones from meadow soils, and one-third consisted of clones from forest soils. A total of 24 genotypes occurred once and 8 occurred twice; the most dominant genotype occurred 31 times. On the basis of species area curve analysis, a mean of 21 genotypes was found after screening 50 nosZ clones, a mean of 31 genotypes was found after screening 100 clones, and a mean of 44 genotypes was found after screening 200 clones. Abundances of T-RFs in the clone library generally agreed with proportional abundances of T-RFs in direct soil profiles. Of the 29 indicator T-RFs shown in Fig. 4, 21 were present in sequenced nosZ clones. Of the 34 sequenced clones, 1 was nonspecific for nosZ (i.e., not identifiable using GenBank's BLAST search) but the T-RFs for this clone were not detected in direct soil profiles.
nosZ fragment size.
Actual T-RF size was determined by sequencing nosZ clones. Determining fragment size on the basis of T-RFLP profiling of the same clones was less precise and less accurate, but the results agreed within a few base pairs or less. In terms of accuracy, individual T-RFs >100 bp in size differed by less than 1 to 3 bp from the results obtained by sequencing (absolute mean difference, 0.9 bp). T-RFs less than 100 bp in size were 3 to 7 bp smaller than expected. In terms of precision, individual T-RFs differed in size by an average of 1.5 bp over a range of 0.3 to 5.1 bp. The dominant RsaI 666-bp T-RF was identified at exactly that size in all 15 cases of sequencing, whereas with T-RFLP profiling the T-RF size differed over a range of 5.1 bp (from 664.0 to 669.1 bp). Six T-RFs (i.e., those obtained with CfoI [52 bp, 454 bp, and 476 bp], MspI [111 to 112 bp], and RsaI [666 bp and 700 bp]) and the two undigested PCR products (i.e., those 700 and 706 bp in size) consistently differed over a range of more than 1 bp in T-RFLP profiling. T-RFs of soil clones and direct soil T-RFLP profiles determined on the basis of T-RFLP profiling were in close agreement, differing by an absolute mean of 0.4 bp (data not shown).
nosZ phylogeny.
Phylogenetic analysis of nosZ sequences revealed five major clusters of denitrifying bacteria (Fig. 5). With the exception of those strains in cluster X, phylogenetic relationships among the cultured strains as determined on the basis of nosZ results were similar to taxonomic relationships determined on the basis of SSU rRNA results (Fig. 5). Tree topology was supported by all the phylogenetic analyses, with some differences in bootstrap support (Fig. 5). All the H. J. Andrews nosZ sequences, along with those of α-Proteobacteria species (except those represented in cluster X) and most clones from a German forest soil and representatives of uncultured marine bacteria, grouped in cluster A (Fig. 5). The sequences of the majority of the H. J. Andrews clones were most closely related to nosZ sequences of members of the Rhizobiaceae group and the clones from the German forest soil (Fig. 5). Separate from the grouping determined by Rhizobiaceae nosZ sequences, two minor branches of H. J. Andrews clones formed meadow- or forest-specific groups (Fig. 5). These clones had sequences with T-RFs found preferentially in meadow or forest in the direct soil T-RFLP profiles (Fig. 5). Two clones from the German forest soil formed a major cluster without any pure-culture sequences (Fig. 5, cluster Y), and the sequence of another clone grouped with the sequence of Azospirillum irakense (Fig. 5, cluster X). The majority of meadow and forest nosZ clones from the H. J. Andrews grouped with Bradyrhizobium japonicum USDA110 and Rhodopseudomonas palustris CGA009. These clones had T-RFs indicative of forest or meadow origin but were not distinguishable phylogenetically (Fig. 5).
FIG. 5.
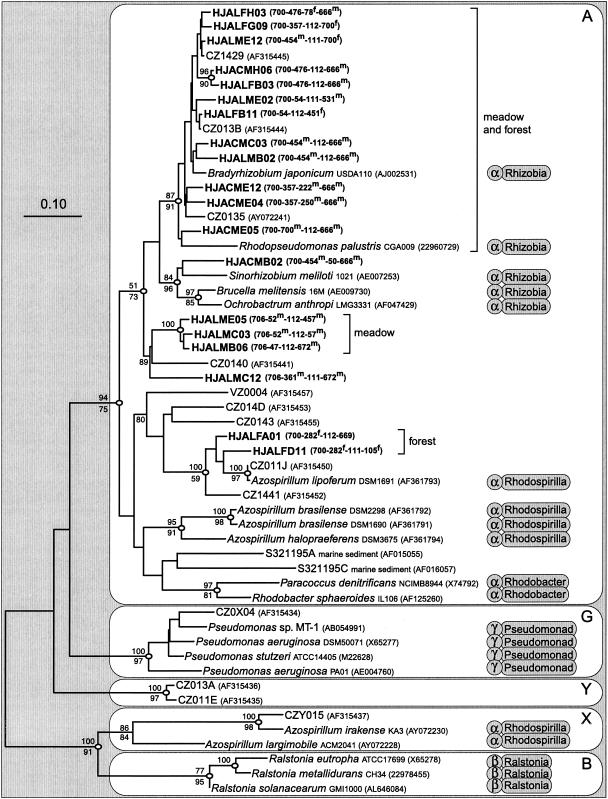
Phylogenetic tree determined on the basis of evolutionary distances among nosZ amino acid sequences (208 positions) from soils, marine sediment, and cultured bacteria. The names of clones from the H. J. Andrews soils are shown in boldface characters, and the designations CZ and VZ identify clones from a German forest soil (36). Except for the H. J. Andrews clones, accession numbers are shown in parentheses. Taxonomic groups of cultured strains are identified to the subdivision and family level of Proteobacteria on the basis of SSU rRNA sequence analysis with the Ribosomal Database Project. Note that the suffix “-aceae” was dropped from the family name. Nodes with open ovals had >90% distance bootstrap support. Numbers above the branches are parsimony bootstrap values; numbers below the branches are maximum likelihood quartet-puzzling support values (analogous to bootstrap values). Sizes of the PCR products and T-RFs of the H. J. Andrews nosZ clones are shown in parentheses (in the order PCR product-CfoI-MspI-RsaI). T-RFs from direct soil T-RFLP profiles that were more prevalent in the meadow or forest are indicated with a superscript m for “meadow” and a superscript f for “forest.” Bar, evolutionary distance of 0.1.
DISCUSSION
Shifts in the relative abundance of dominant organisms within prokaryotic functional groups, and not complete turnover in community structure, can be associated with relatively large differences in biogeochemical processes (17, 20, 34). We found denitrification activity an order of magnitude higher in meadow than in forest soils and a significant shift in the proportional abundances of dominant denitrifying genotypes (i.e., nosZ RsaI 666- and 700-bp T-RFs) from meadow to forest soils. Several less-abundant denitrifying genotypes (e.g., a CfoI 454-bp T-RF and a RsaI 451-bp T-RF) differed in distribution between vegetation types. Denitrifying community composition was related to potential denitrification and nitrification activities and environmental factors, including soil C/N ratios.
As determined on the basis of a cross-section of studies (2, 10, 30, 47), mean DEA rates for temperate soils differ by 4 orders of magnitude (i.e., <1 to 3,000 ng of N g−1 of soil h−1), with some of the lowest rates in mature coniferous forests in the Western Cascades (47) and highest rates in wet agricultural systems receiving N inputs (30). Although higher than those for the H. J. Andrews forest, our meadow values are in the low-to-medium range of DEA (i.e., 10 to 100 ng of N g−1 h−1). DEA and net nitrification values were similar in magnitude (Table 1), suggesting that denitrification can serve as a sink for net nitrification in these soils.
Denitrifying communities in the meadow were much more active under denitrifying conditions compared to those in the forest (Fig. 1). Similar differences between meadow and forest soils were determined on the basis of potential N2O reductase activity (35). Because NO3− or an intermediate in the denitrification pathway is necessary for sustained denitrification activity (11, 37), lack of available NO3− could explain low denitrification activity in the forest soils. Nitrate availability in the forest appeared limited for several reasons, including very low nitrification potential rates and accumulation of primarily NH4+ in N mineralization incubations (26) (Table 1). Denitrifiers were present in the forest, probably because most denitrifiers are facultative aerobic heterotrophs which do not depend on denitrification activity for growth (46).
As determined on the basis of multivariate statistical analyses of nosZ T-RFLP profiles, denitrifying community composition differed among habitats. NMS and MRPP are valid methods for analyzing differences in community composition on the basis of T-RFLP data (23). Our statistical approach is further justified because it provides a quantitative framework for analyzing microbial community data and environmental interrelationships. For example, about 50% of the variation in functional variables was explained by nosZ distribution determined on the basis of cumulative r2 values between process rates (or C/N ratios) and NMS axes (Fig. 2). Environmental factors (such as soil water and NO3− content) often explain less than 50% of DEA variation or in situ denitrification (27, 30).
We amplified nosZ from pure cultures that represented a cross-spectrum of nosZ sequences from Proteobacteria species. In addition, we found divergent nosZ sequences in a poorly drained grassland soil that were most similar to those of A. irakense (53% similarity as determined on the basis of amino acid sequences), Ralstonia solanacearum (64% similarity), and P. stutzeri (88% similarity) (35). In analogy to the work of Friedrich (8), we investigated the lateral gene transfer of nosZ by comparing phylogenetic relationships on the basis of nosZ data and taxonomic relationships on the basis of SSU rRNA data (Fig. 5). Although we detected a major discrepancy for two Azospirillum spp. (Fig. 5, cluster X), taxonomic and nosZ phylogenetic relationships were in reasonable agreement for the rest of the strains.
Therefore, the majority of denitrifiers detected in the H. J. Andrews soils may share taxonomic and functional similarities to representatives of Rhizobiaceae in α-Proteobacteria species. Other studies have found numerous denitrifying sequences from soils that group closely with representatives of Rhizobiaceae (32, 33, 36). The Rhizobiaceae are metabolically diverse. Symbiotic N2-fixing Rhizobium and Bradyrhizobium spp. are known to denitrify (46), and legumes are common in the meadow at each site. However, some Rhizobium spp. from soil lack symbiotic genes and behave as free-living saprophytes (43). The Rhizobiaceae strains shown in Fig. 5 utilize a wide range of organic substrates, such as aromatic constituents present in polyphenols and lignin (29, 31). Furthermore, 2,4-D-degrading and oligotrophic bacteria that are closely phylogenetically related to Bradyrhizobium spp. have been isolated from soil (16, 38). None of the classical types of denitrifiers, such as pseudomonads or paracocci, were detected among sequenced clones from the H. J. Andrews soils or prevalent in other soils or marine sediments (32, 36, 39).
H. J. Andrews nosZ clones with T-RFs indicative of meadow or forest (i.e., CfoI 454-bp T-RFs and RsaI 451-, 666-, and 700-bp T-RFs) did not necessarily form separate phylogenetic groups (Fig. 5). Other studies comparing different habitats or treatments have resulted in similar findings (32, 33). In contrast, a few H. J. Andrews nosZ clones with T-RFs indicative of habitat (i.e., CfoI 52- and 282-bp T-RFs and RsaI 57-, 105-, 457-, and 672-bp T-RFs) formed monospecific phylogenetic groups differentiated according to location in meadow or forest (Fig. 5). The role of these specific groups in differentiating meadow and forest denitrification processes remains unclear.
In conclusion, denitrifying community composition and functioning appeared linked across meadow and forest soils. Denitrification activity was an order of magnitude higher in meadow than in forest soils, and denitrifying community composition differed between the vegetation types. As determined on the basis of nosZ phylogenetic analysis and T-RFLP profiles, organisms related to Rhizobiaceae may be prevalent denitrifiers in these mountain ecosystems.
Acknowledgments
Financial support for this work was provided by the National Science Foundation Microbial Observatory Program (MCB-9977933) and the Oregon Agricultural Experiment Station.
We are grateful to Caprice Rosato, Mark Dasenko, and Scott Givan at the Center for Gene Research and Biotechnology at Oregon State University for providing DNA fragment analysis, sequencing, and bioinformatics support. We acknowledge the H. J. Andrews Experimental Forest and Long Term Ecological Research (LTER) program. Thank you to Nancy Ritchie-Posavatz for contributing to study design and analytical measurements, Anne Mintie for nitrification potential data, and a number of other colleagues for field assistance.
REFERENCES
- 1.Avrahami, S., R. Conrad, and G. Braker. 2002. Effect of soil ammonium concentration on N2O release and on the community structure of ammonia oxidizers and denitrifiers. Appl. Environ. Microbiol. 68:5685-5692. [DOI] [PMC free article] [PubMed] [Google Scholar]
- 2.Bohlen, P. J., P. M. Groffman, C. T. Driscoll, T. J. Fahey, and T. G. Siccama. 2001. Plant-soil-microbial interactions in a northern hardwood forest. Ecology 82:965-978. [Google Scholar]
- 3.Braker, G., H. L. Ayala-del-Rio, A. H. Devol, A. Fesefeldt, and J. M. Tiedje. 2001. Community structure of denitrifiers, Bacteria, and Archaea along redox gradients in Pacific Northwest marine sediments by terminal restriction fragment length polymorphism analysis of amplified nitrite reductase (nirS) and 16S rRNA genes. Appl. Environ. Microbiol. 67:1893-1901. [DOI] [PMC free article] [PubMed] [Google Scholar]
- 4.Braker, G., J. Zhou, L. Wu, A. H. Devol, and J. M. Tiedje. 2000. Nitrite reductase genes (nirK and nirS) as functional markers to investigate diversity of denitrifying bacteria in Pacific Northwest marine sediment communities. Appl. Environ. Microbiol. 66:2096-2104. [DOI] [PMC free article] [PubMed] [Google Scholar]
- 5.Davidson, E. A., S. C. Hart, and M. K. Firestone. 1992. Internal cycling of nitrate in soils of a mature coniferous forest. Ecology 73:1148-1156. [Google Scholar]
- 6.Dayhoff, M. O., R. M. Schwartz, and B. C. Orcutt. 1979. A model of evolutionary change in proteins, p. 345-352. In M. O. Dayhoff (ed.), Atlas of protein sequence and structure, vol. 5. National Biomedical Research Foundation, Washington, D.C.
- 7.Dufrêne, M., and P. Legendre. 1997. Species assemblages and indicator species: the need for a flexible asymmetrical approach. Ecol. Monogr. 61:53-73. [Google Scholar]
- 8.Friedrich, M. W. 2002. Phylogenetic analysis reveals multiple lateral transfers of adenosine-5′-phosphate reductase genes among sulfate-reducing microorganisms. J. Bacteriol. 184:278-289. [DOI] [PMC free article] [PubMed] [Google Scholar]
- 9.Goris, J., P. De Vos, T. Coenye, B. Hoste, D. Janssens, H. Brim, L. Diels, M. Mergeay, K. Kersters, and P. Vandamme. 2001. Classification of metal-resistant bacteria from industrial biotopes of Ralstonia campinensis sp. nov., Ralstonia metallidurans sp. nov. and Ralstonia basilensis Steinle et al. 1998 emend. Int. J. Syst. Evol. Microbiol. 51:1773-1782. [DOI] [PubMed] [Google Scholar]
- 10.Griffiths, R. P., P. S. Homann, and R. Riley. 1998. Denitrification enzyme activity of Douglas-fir and red alder forest soils of the Pacific Northwest. Soil Biol. Biochem. 30:1147-1157. [Google Scholar]
- 11.Härtig, E., and W. G. Zumft. 1999. Kinetics of nirS expression (cytochrome cd1 nitrite reductase) in Pseudomonas stutzeri during the transition from aerobic respiration to denitrification: evidence for a denitrification-specific nitrate- and nitrite-responsive regulatory system. J. Bacteriol. 181:161-166. [DOI] [PMC free article] [PubMed] [Google Scholar]
- 12.Hunt, H. W., E. R. Ingham, D. C. Coleman, E. T. Elliott, and C. P. P. Reid. 1988. Nitrogen limitation of production and decomposition in prairie, mountain meadow, and pine forest. Ecology 69:1009-1016. [Google Scholar]
- 13.Hyman, M. R., and D. J. Arp. 1987. Quantification and removal of some contaminating gases from acetylene used to study gas-utilizing enzymes and microorganisms. Appl. Environ. Microbiol. 53:298-303. [DOI] [PMC free article] [PubMed] [Google Scholar]
- 14.Ingham, E. R., D. C. Coleman, and J. C. Moore. 1989. An analysis of food-web structure and function in a shortgrass prairie, a mountain meadow, and a lodgepole pine forest. Biol. Fertil. Soils 8:29-37. [Google Scholar]
- 15.Jones, D. T., W. R. Taylor, and J. M. Thornton. 1992. The rapid generation of mutation data matrices from protein sequences. Bioinformatics 8:275-282. [DOI] [PubMed] [Google Scholar]
- 16.Kitagawa, W., S. Takami, K. Miyauchi, E. Masai, Y. Kamagata, J. M. Tiedje, and M. Fukuda. 2002. Novel 2,4-dichlorophenoxyacetic acid degradation genes from oligotrophic Bradyrhizobium sp. strain HW13 isolated from a pristine environment. J. Bacteriol. 184:509-518. [DOI] [PMC free article] [PubMed] [Google Scholar]
- 17.Kleikemper, J., M. H. Schroth, W. V. Sigler, M. Schmucki, S. M. Bernasconi, and J. Zeyer. 2002. Activity and diversity of sulfate-reducing bacteria in a petroleum hydrocarbon-contaminated aquifer. Appl. Environ. Microbiol. 68:1516-1523. [DOI] [PMC free article] [PubMed] [Google Scholar]
- 18.Kowalchuk, G. A., D. S. Buma, W. de Boer, P. G. L. Klinkhamer, and J. A. van Veen. 2002. Effects of above-ground plant species composition and diversity on the diversity of soil-borne microorganisms. Antonie Leeuwenhoek 81:509-520. [DOI] [PubMed] [Google Scholar]
- 19.Kruskal, J. B. 1964. Non-metric multidimensional scaling: a numerical method. Psychometrika 29:115-129. [Google Scholar]
- 20.Lueders, T., and M. W. Friedrich. 2002. Effects of amendment with ferrihydrite and gypsum on the structure and activity of methanogenic populations in rice field soil. Appl. Environ. Microbiol. 68:2484-2494. [DOI] [PMC free article] [PubMed] [Google Scholar]
- 21.Magee, T. K., and J. A. Antos. 1992. Tree invasion into a mountain-top meadow in the Oregon Coast Range, USA. J. Veg. Sci. 3:485-494. [Google Scholar]
- 22.Maidak, B. L., J. R. Cole, T. G. Lilburn, C. T. J. Parker, P. R. Saxman, R. J. Farris, G. M. Garrity, G. J. Olsen, T. M. Schmidt, and J. M. Tiedje. 2001. The RDP-II (Ribosomal Database Project). Nucleic Acids Res. 29:173-174. [DOI] [PMC free article] [PubMed] [Google Scholar]
- 23.McCune, B., and J. B. Grace. 2002. Analysis of ecological communities. MjM Software, Gleneden Beach, Oregon.
- 24.Mielke, P. W., Jr. 1984. Meteorological applications of permutation techniques based on distance functions, p. 813-830. In P. R. Krishnaiah and P. K. Sen (ed.), Handbook of statistics. Elsevier Science Publishers, New York, N.Y.
- 25.Miller, E. A., and C. B. Halpern. 1998. Effects of environment and grazing disturbance on tree establishment in meadows of the central Cascade Range, Oregon, USA. J. Veg. Sci. 9:265-282. [Google Scholar]
- 26.Mintie, A. T., R. S. Heichen, K. J. Cromack, Jr., D. D. Myrold, and P. J. Bottomley. 2003. Ammonia-oxidizing bacteria along meadow-to-forest transects in the Oregon Cascade Mountains. Appl. Environ. Microbiol. 69:3129-3136. [DOI] [PMC free article] [PubMed] [Google Scholar]
- 27.Myrold, D. D. 1988. Denitrification in ryegrass and winter wheat cropping systems of Western Oregon. Soil Sci. Soc. Am. J. 52:412-416. [Google Scholar]
- 28.Ollinger, S. V., M. L. Smith, M. E. Martin, R. A. Hallett, C. L. Goodale, and J. D. Aber. 2002. Regional variation in foliar chemistry and N cycling among forests of diverse history and composition. Ecology 83:339-355. [Google Scholar]
- 29.Parke, D., and L. N. Ornston. 1986. Enzymes of the β-ketoadipate pathway are inducible in Rhizobium and Agrobacterium spp. and constitutive in Bradyrhizobium spp. J. Bacteriol. 165:288-292. [DOI] [PMC free article] [PubMed] [Google Scholar]
- 30.Parsons, L. L., R. E. Murray, and M. S. Smith. 1991. Soil denitrification dynamics: spatial and temporal variations of enzyme activity, populations, and nitrogen gas loss. Soil Sci. Soc. Am. J. 55:90-95. [Google Scholar]
- 31.Paulsen, I. T., et al. 2002. The Brucella suis genome reveals fundamental similarities between animal and plant pathogens and symbionts. Proc. Natl. Acad. Sci. USA 99:13148-13153. [DOI] [PMC free article] [PubMed] [Google Scholar]
- 32.Philippot, L., S. Piutti, F. Martin-Laurent, S. Hallet, and J. C. Germon. 2002. Molecular analysis of the nitrate-reducing community from unplanted and maize-planted soils. Appl. Environ. Microbiol. 68:6121-6128. [DOI] [PMC free article] [PubMed] [Google Scholar]
- 33.Priemé, A., G. Braker, and J. M. Tiedje. 2002. Diversity of nitrite reductase (nirK and nirS) gene fragments in forested upland and wetland soils. Appl. Environ. Microbiol. 68:1893-1900. [DOI] [PMC free article] [PubMed] [Google Scholar]
- 34.Ramakrishnan, B., T. Leuders, P. F. Dunfield, R. Conrad, and M. W. Friedrich. 2001. Archeal community structure in rice soils from different geographical regions before and after initiation of methane production. FEMS Microbiol. Ecol. 37:175-186. [Google Scholar]
- 35.Rich, J. J. 2003. Ph.D. thesis. Oregon State University, Corvallis.
- 36.Rösch, C., A. Mergel, and H. Bothe. 2002. Biodiversity of denitrifying and dinitrogen-fixing bacteria in an acid forest soil. Appl. Environ. Microbiol. 68:3818-3829. [DOI] [PMC free article] [PubMed] [Google Scholar]
- 37.Sabaty, M., C. Schwintner, S. Cahors, P. Richaud, and A. Verméglio. 1999. Nitrite and nitrous oxide reductase regulation by nitrogen oxides in Rhodobacter sphaeroides f. sp. denitrificans IL106. J. Bacteriol. 181:6028-6032. [DOI] [PMC free article] [PubMed] [Google Scholar]
- 38.Saito, A., H. Mitsui, R. Hattori, K. Minamisawa, and T. Hattori. 1998. Slow-growing and oligotrophic soil bacteria phylogenetically close to Bradyrhizobium japonicum. FEMS Microbiol. Ecol. 25:277-286. [Google Scholar]
- 39.Scala, D. J., and L. J. Kerkhof. 1999. Diversity of nitrous oxide reductase (nosZ) genes in continental shelf sediments. Appl. Environ. Microbiol. 65:1681-1687. [DOI] [PMC free article] [PubMed] [Google Scholar]
- 40.Scala, D. J., and L. J. Kerkhof. 2000. Horizontal heterogeneity of denitrifying bacterial communities in marine sediments by terminal restriction fragment length polymorphism analysis. Appl. Environ. Microbiol. 66:1980-1986. [DOI] [PMC free article] [PubMed] [Google Scholar]
- 41.Scala, D. J., and L. J. Kerkhof. 1998. Nitrous oxide reductase (nosZ) gene-specific PCR primers for detection of denitrifiers and three nosZ genes from marine sediments. FEMS Microbiol. Lett. 162:61-68. [DOI] [PubMed] [Google Scholar]
- 42.Schmidt, H. A., K. Strimmer, M. Vingron, and A. von Haeseler. 2002. TREE-PUZZLE: maximum likelihood phylogenetic analysis using quartets and parallel computing. Bioinformatics 18:502-504. [DOI] [PubMed] [Google Scholar]
- 43.Sullivan, J. T., B. D. Eardly, P. van Berkum, and C. W. Ronson. 1996. Four unnamed species of nonsymbiotic rhizobia isolated from the rhizosphere of Lotus corniculatus. Appl. Environ. Microbiol. 62:2818-2825. [DOI] [PMC free article] [PubMed] [Google Scholar]
- 44.Thompson, J. D., T. J. Gibson, F. Plewniak, F. Jeanmougin, and D. G. Higgins. 1997. The Clustal_X windows interface: flexible strategies for multiple sequence alignment aided by quality analysis tools. Nucleic Acids Res. 24:4876-4882. [DOI] [PMC free article] [PubMed] [Google Scholar]
- 45.Tiedje, J. M. 1994. Denitrifiers, p. 245-265. In R. W. Weaver, J. S. Angle, and P. J. Bottomley (ed.), Methods of soil analysis, part 2—microbiological and biochemical properties. Soil Science Society of America, Inc., Madison, Wis.
- 46.Tiedje, J. M. 1988. Ecology of denitrification and dissimilatory nitrate reduction to ammonium, p. 170-244. In A. J. B. Zehnder (ed.), Biology of anaerobic microorganisms. John Wiley and Sons, New York, N.Y.
- 47.Vermes, J.-F., and D. D. Myrold. 1992. Denitrification in forest soils of Oregon. Can. J. For. Res. 22:504-512. [Google Scholar]
- 48.Zumft, W. G. 1999. The denitrifying prokaryotes. In M. Dworkin, S. Falkow, E. Rosenberg, K.-H. Schleifer, and E. Stackebrandt (ed.), The prokaryotes: an evolving electronic resource for the microbiological community, 3rd ed., release 3.0. [Online.] Springer-Verlag, New York, N.Y. http://141.150.157.117:8080/prokPUB/index.htm.