

Abstract
Background
Individuals with cancer receiving chemotherapy suffer deterioration in physical functioning due to symptoms arising from the cancer disease process and its treatment.
Objectives
To determine if age, chronic health conditions (comorbidity), stage of cancer, depressive symptomatology, symptom limitations, sex, and site of cancer moderate the effects of cognitive behavioral intervention on physical function and to determine if symptom limitations mediate the effect of the intervention on physical functioning.
Methods
Two hundred thirty-seven individuals with solid tumor cancer (118 experimental and 119 control group) participated in this 10-contact, 18-week randomized control trial. Cognitive behavioral theory guided the nurse-delivered problem-solving experimental intervention. The control group received conventional care. Interviews occurred at baseline and 10, 20, and 32 weeks.
Results
Women with breast cancer had significantly better physical functioning than women with lung cancer. Chronic health conditions, symptom limitation, and depressive symptomatology at baseline were found to moderate the effect of intervention on physical function. Symptom limitation, however, was not found to mediate the effect of intervention on physical functioning.
Discussion
The intervention was shown to affect physical function trajectories differently for individuals with different personal and health characteristics. Because poor physical functioning is strongly associated with mortality and poor quality of life, this information may be used by health professionals to target interventions to those who might be most responsive.
Keywords: depressive symptomatology, physical functioning, solid tumor cancer, symptoms
The American Cancer Society (2005) has identified that one out of four Americans is diagnosed with cancer at some point in life. Individuals with cancer who receive chemotherapy suffer many limitations due to symptoms arising from both the disease process and its treatment (Patrick et al., 2003). It has been demonstrated that individuals with cancer who report more limitations from their symptoms also experience greater declines in physical functioning, reduced quality of life, and increased mortality (Dodd, Miaskowski, & Paul, 2001; Kurtz, Kurtz, Stommel, Given, & Given, 2001; Serlin, Mendoza, Nakamura, Edwards, & Cleeland, 1995). In response, there has been increased attention toward interventions targeting symptoms to reduce symptom-related negative consequences among individuals with cancer (Patrick et al., 2003).
The theoretical basis behind many behavioral interventions is cognitive behavioral theory. In this theory, behavioral change can occur with the acquisition of self-management knowledge, skills, and behaviors (Dobson, 2001; Given, Given, Champion, Kozachik, & DeVoss, 2003). The major premise of this theory is that providing interventions to individuals with cancer should increase their self-efficacy by developing skills through practice, observing others, and being verbally persuaded that the skill will be effective (Bandura, 1997). Enhancing an individual’s self-efficacy should attenuate the probability of the individual experiencing emotional distress, functional impairment, treatment and disease-related symptoms, and decreased quality of life.
Research has shown behavioral interventions to be particularly efficacious among individuals with cancer. For example, a meta-analysis of 45 studies reporting 62 treatment control comparisons found that significant beneficial effect sizes were .24 for emotional measures, .19 for function measures, .26 for symptoms, and .28 for global measures (Meyer & Mark, 1995). In a meta-analysis of 116 studies, the significant beneficial effects of psycho-educational interventions were found for the outcomes of anxiety, depression, mood, nausea, vomiting, pain, and knowledge (Devine & Westlake, 1995). The meta-analyses of research studies using behavioral interventions highlight the efficacy of these interventions among individuals with cancer. However, few studies have examined the moderators and mediators that determine the conditions for which, or the individuals for whom, such interventions are most effective, nor have they examined how the interventions work.
Moderators specify for which individual or under what conditions an intervention is effective (Baron & Kenny, 1986). Thus, the intervention would be stronger or weaker at different levels of the moderator variables. In this paper, we examine if factors known to be associated with physical functioning—such as age, chronic health conditions, site and stage of cancer, symptoms, and depressive symptomatology (Given, Given, Azzouz, Stommel, & Kozachik, 2000; Kurtz et al., 1999, 2000; Patrick, Johnson, Goins, & Brown, 2004)—also moderate the effect of the intervention on physical functioning. For example, individuals who have lower depressive symptomatology (the moderator variable) may have a greater increase in physical function when receiving the intervention, but those with greater depressive symptomatology may not increase in physical function.
Tests for mediator effects are equally important in understanding the conditions under which interventions affect physical functioning. A mediator provides information about how or why two variables are related (Baron & Kenny, 1986; Dudley, Benuzillo, & Carrico, 2004). Exploring the relationships among medical conditions, symptoms, and functioning in older adults, for example, Bennett, Stewart, Kayser-Jones, and Glaser (2002) hypothesized that the adverse effect of the medical condition on physical functioning was mediated by symptom severity. They found that a significant portion of the relationship between medical conditions and physical functioning was explained by the symptoms of pain and fatigue. In a previous analysis, it was demonstrated that a cognitive behavioral intervention provided to individuals with cancer undergoing chemotherapy treatment was more effective than control in reducing symptom limitation (Doorenbos et al., 2005). Thus, it was hypothesized that the resulting decrease in symptom limitation from the intervention may mediate or explain how the intervention affects physical function.
Symptom limitation could have either a mediating or moderating influence on the relationship between our intervention and physical functioning. Symptom limitations could mediate the relationship between the intervention and physical functioning by indicating that the change in physical functioning due to the intervention is in part attributable to changes in symptom limitations. Alternatively, baseline symptom limitation could moderate the impact of the intervention on physical function; that is, individuals with cancer who have higher baseline symptom limitation are more (or less) able to benefit from an intervention’s impact on physical function.
To explore potential moderators and mediators of the intervention on physical function, a secondary data analysis was conducted of the random control trial (RCT), in which cognitive behavioral theory guided the intervention. The aims of this paper are (a) to determine if age, chronic health conditions, stage of cancer, symptom limitations, depressive symptomatology, sex, and site of cancer moderate the effects of intervention on physical functioning; and (b) to determine if symptom limitations mediate the effect of the intervention on physical functioning.
Methods
Eligibility Criteria and Settings
The primary RCT used for this secondary analysis was designed to examine both individuals with cancer and their caregivers. Thus, eligible participants were individuals newly diagnosed with solid tumor cancers, undergoing chemotherapy, and having a family caregiver; however, the data contributed by the caregivers were not used in this secondary analysis. The eligibility criteria and settings for the primary study are well documented in other publications (Doorenbos et al., 2005; Given et al., 2004a, 2004b).
Procedures
Human subjects approval was obtained from the institutional review boards at university and clinical settings. Recruitment and follow-up occurred in the years 1999 through 2001. Nurse recruiters identified 609 dyads who met the eligibility criteria. Two hundred sixty-three dyads agreed to participate in the study. Following the loss of 26 additional dyads between consent and completion of the baseline survey, 237 participants were randomized to either the experimental or the control condition, using the SAS minimization procedure. Figure 1 shows the attrition and retention by group. Analysis examining baseline equivalencies, using chi-square and t tests, revealed no significant differences between intervention and control groups at baseline. Between Weeks 20 and 32, more experimental group participants dropped out than during the same period in the control group; however, this trend towards significance had no discernable pattern.
FIGURE 1.
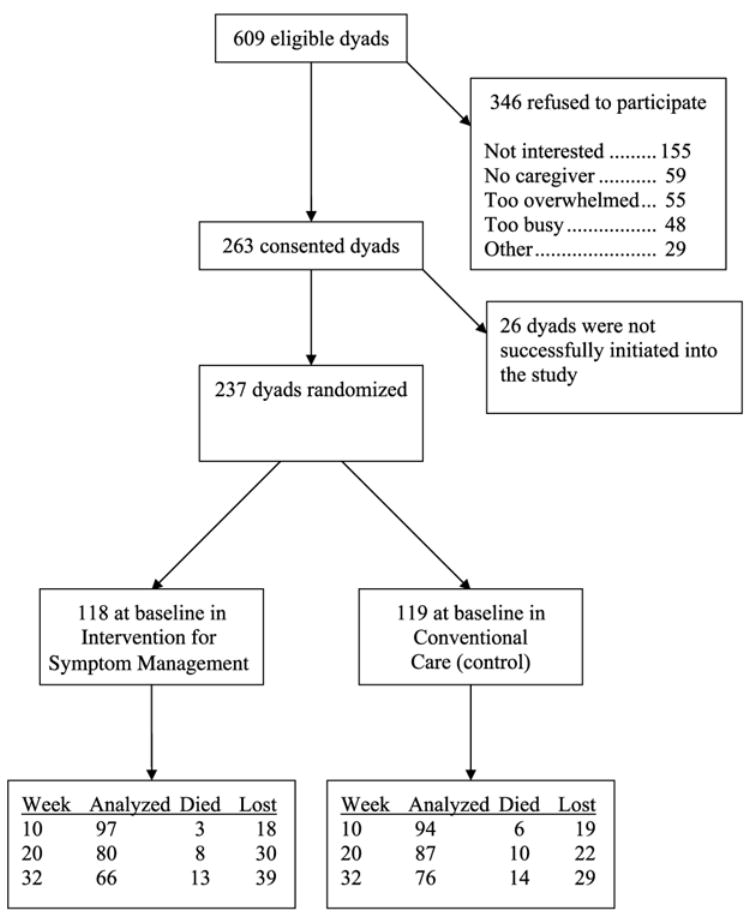
Study flow.
Intervention
Cognitive behavioral theory guided the intervention provided in this RCT. The conceptual relevance of this intervention for individuals with cancer is linked to enhancing self-efficacy. The intervention goal was to provide empirically based strategies to enhance self-efficacy: self-care management information, counseling and support, and problem-solving and communication skills (Devine, 2003; Moore, Von Korff, Cherkin, Saunders, & Lorig, 2000; Oliver, Kravitz, Kaplan, & Meyers, 2001).
The intervention was delivered by trained nurses over the 10 contacts. Table 1 details the pattern and sequence of contacts, each approximately 45–60 minutes in length. The plan of care and intervention was collaboratively developed by the participant and the nurse intervener. The process of establishing and adapting the plan of care has been previously documented (Doorenbos et al., 2005; Given et al., 2004a, 2004b). The assessment of fidelity to intervention followed the recommended best practices for treatment fidelity (Bellg et al., 2004; Resnick et al., 2005).
TABLE 1.
Pattern and Sequence of Contacts for the Intervention Group
| Week | 1 | 3 | 5 | 7 | 9 | 11 | 13 | 15 | 17 | 19 |
| Format | P | T | P | T | P | T | P | T | P | T |
Note: T = telephone interview; P = personal interview.
Data Collection
Data collection occurred by trained telephone interviewers using a computer-assisted telephone interviewing system at baseline, Week 10 (midpoint of the intervention), Week 20 (immediately after conclusion of the intervention), and at Week 32 (for follow-up). Telephone interviews were used; the telephone interview approach has been shown to increase the amount and quality of data collected in multisite studies (Kornblith & Holland, 1996). The interviewers administered a structured survey consisting of self-report measures. The interview took approximately 1 hour to complete and included questions regarding symptoms, physical function, depressive symptomatology, and chronic health conditions. The interviewers were not blinded to study conditions.
Measures
The outcome, self-reported physical functioning, was measured by the 10-item, SF-36 physical functioning subscale (Ware, Snow, Kosinski, & Gandek, 1993). The items are rated on a 3-point Likert-type scale, summed, and then transformed to a 0–100 scale, with higher scores indicating better functioning. The psychometric properties of the SF-36 have been tested extensively in many groups of individuals with chronic illness, and the scales have demonstrated good reliability and validity (Ware & Gandek, 1998). In this study, the Cronbach’s alpha reliabilities for the four time points of the study were .93, .91, .93, and .94, respectively.
Covariates included participant demographics, stage and site of cancer, symptom limitations, depressive symptomatology, and chronic health conditions. Demographics questions included sex, age, income, race, and marital status.
Participants’ medical records were monitored during the study to obtain site and stage of cancer information. Cancer stage was coded as early (Stage 1 or 2) or late (Stage 3 or 4), according to the TNM staging criteria of the American Joint Committee on Cancer (2003). Cancer sites were combined into three groups: breast, lung, and other (which included colon, gynecological, lymphoma, pancreatic, and uterine cancers). As some cancers are sex specific, site and sex cancer categories were developed: male and female lung, male and female other, and female breast cancers. Appropriate dummy variables were created using lung and female as the reference category, because individuals with lung cancer were reported to experience less physical functioning than individuals with other sites of cancer (Cooley, 2000).
Symptom limitations were measured using the Symptom Experience Tool (Given et al., 1993). The presence of depressive symptomatology was assessed using the 20-item Center for Epidemiologic Studies Depression Scale (CES-D; Radloff, 1977). In this study, the Cronbach’s alpha for baseline CES-D reliability was .81. Because we were interested in the potential moderation effect of depressive symptomatology on the intervention, only the baseline depressive symptomatology was used for analysis. Chronic health conditions were assessed using a modified version of the Comorbidity Questionnaire (Katz, Chang, Sangha, Fossel, & Bates, 1996). For the purposes of analysis, chronic health condition scores were divided into two groups: fewer than three chronic health conditions, and three or more chronic health conditions.
Analysis
The primary outcome for this study was the physical functioning subscale of the SF-36 measured at baseline and Weeks 10, 20, and 32. A two-level, hierarchical linear model (HLM) was used (Raudenbush & Bryk, 2002; Raudenbush, Bryk, Cheong, & Congdon, 2004). This model affords an integrated approach for studying the structure and predictors of individual change as well as providing the appropriate standard errors and correct statistical inferences (Raudenbush, 2001; Raudenbush & Bryk, 2002). Compared to the standard repeated measures analysis of variance (ANOVA) models, HLM models are more flexible. For example, they allow the use of data on individuals who are missing one or more observations, where the assumption of missing at random holds (Little & Rubin, 2002).
The Level 1 model defines physical functioning trajectory within each individual over time. The Level 2 model examines the differences between these trajectories. Since at most four repeated measures were observed per person, a cubic is the highest order polynomial that can be fit to these data. The physical functioning trajectory was examined and the cubic order polynomial fit statistically significantly better than the quadratic (χ2 = 9.844, df = 1, p = .002) or the linear (χ2 = 23.171, df = 5, p = .001) polynomials. Thus, the unconditional model is
| (1) |
| (2) |
for i = 1, 2,…, n participants and t = 0, 1, 2, 3 interview occasions. Time was coded as time since the start of the study in months; it is centered at 5 months (or 20 weeks) because this was the first postintervention observation. So, π0i is the expected physical functioning of participant i at Week 20; π1i is the expected instantaneous rate of change in physical functioning of participant i at Week 20; π2i is the expected acceleration (or change in the rate of change) in physical functioning for participant i at Week 20; and π3i is the expected change in acceleration in physical functioning for participant i. Note that a cubic growth trajectory implies that growth and acceleration rates may change over time for a given individual. βs are the corresponding expected average population estimators.
The first aim of this study was to explore if other factors known to be associated with physical functioning moderate the effects of intervention (CBI) on physical functioning. Thus, the Level 1 model stays the same as in Equation 1. Age (age 60), chronic health conditions (chronic_high, with chronic_low category as the reference), site and stage of cancer (lung_male, breast_female, other_male, and other_ female, with lung_female category as the reference), stage of cancer (late-stage, with early-stage as reference category), baseline symptom limitations (sym_lim-22), and depressive symptomatology (depr-16) were entered in each of the four equations at Level 2, along with the intervention group and its interactions with the covariates. Note that continuous variables were centered to make the intercept more readily interpretable. Age and symptom limitation were grand-mean centered (around their respective means of 60 and 22), and depression was centered at 16 (as a score of 16 or higher on the CES-D is indicative of clinical depression; Radloff, 1977). Moreover, a quadratic effect of age and its interaction with intervention group were also included in the initial model to test for a nonlinear relationship between age and physical functioning.
A more parsimonious model was discovered by removing variables found to be associated insignificantly with physical function. The quadratic effect of age and late stage, and their interactions with intervention, were removed from all four Level 2 equations. Furthermore, site and gender covariates and their interactions with intervention were removed from all but the intercept (π0i) equation. Model deviances were compared using a chi-squared test (χ2 = 65.27, df = 48, p = .05), and the more parsimonious model was found not to be significantly different from the original model. Controlling for other covariates, age and its interaction with intervention were not significant in the final model; however, the deviance comparison test of the full model to the model without age yielded a significant chi-square statistic (χ2 = 80.15, df = 56, p = .02). Therefore, although age was not associated significantly with physical function in the final model, based on the significant chi-square statistic it was retained in the final model. Thus, the final Level 1 model stays the same as in Equation 1, whereas the Level 2 final model can be seen in Appendix A.
The second aim of this study was to examine if symptom limitations mediate the effect of the intervention on physical functioning. This was tested using Baron and Kenny’s (1986) criteria, in which three models are examined. Methodology for examining mediational effects in cross-sectional multilevel settings has been discussed elsewhere (Kenny, Korchmaros, & Bolger, 2003; Krull & MacKinnon, 2001; Raudenbush & Sampson, 1999). However, in this study the focus is on examining upper-level mediating effects: that is, the causal variable (CBI) whose effect is mediated is a Level 2 variable (Kenny et al., 2003) in a longitudinal setting.
First, a model looking at the overall (direct and indirect) association between intervention and outcome (physical functioning) was considered by including the intervention variable at Level 2. The Level 1 equation stays the same as in Equation 1, whereas the Level 2 equation is:
| (3) |
The four CBI coefficients (β01, β11, β21, β31) represent the overall effect of the intervention on physical functioning trajectory. Note that mediator effects should only be tested if there is a significant association between the intervention and the outcome variable (Bennett, 2000); that is, a significant effect of intervention on physical function trajectory in the first model.
The second model looks at the direct effect of intervention controlling for the mediator (symptom limitations). To ensure the proper temporal causal sequence of variables, a lagged symptom limitation is included in the model at Level 1; symptom limitation at time t − 1 (Sym_Limt − 1,i) is used to predict physical functioning at time t (PFti). Because symptom limitation was not recorded prior to baseline physical functioning, at most three interview occasions could be used per individual. Thus, a quadratic trajectory for physical functioning is examined. The model is:
| (4) |
for i = 1, 2,…, n participants and t = 1, 2, 3 interview occasions. In this model, the three CBI coefficients (β01, β11, β21) represent the effect of CBI not attributable to symptom limitation.
The last of the three mediation models examines the effect of the intervention on the mediator (symptom limitation). This is shown in Equation 5 below:
| (5) |
where i = 1, 2,…, n participants and t = 0, 1, 2, 3 interview occasions. In this model the four CBI coefficients (β01, β11, β21, β31) represent the effect of the intervention on the mediator trajectory.
Results
Baseline demographic and clinical characteristics by group are presented in Table 2. Participants ranged in age from 31 to 87 years, with a mean age of 60 years (SD = 10 years). The majority of the participants were married (75%), White (90%), and female (74%). Fifty-four percent of participants came from households with annual incomes over $60,000. Sixty-seven percent of the participants had late-stage (Stage 3 or 4) cancer. The most common site of cancer was breast (38%), followed by lung (35%). Baseline CES-D scores ranged from 0 to 44, with a mean of 12.78 (9.1). Thirty-two percent of the participants had a score of 16 or greater on the CES-D. (The score on the CES-D indicative of clinical depression is 16.) Descriptive statistics for continuous variables across all time point are presented in Table 3.
TABLE 2.
Baseline Demographics and Clinical Characteristics by Group
| Variable | Intervention group (n = 118),n (%) | Control group (n = 119),n (%) |
|---|---|---|
| Race/ethnicity | ||
| White | 108 (90%) | 108 (90%) |
| Other | 10 (10%) | 11 (10%) |
| Sex | ||
| Female | 86 (73%) | 88 (74%) |
| Male | 32 (27%) | 31 (26%) |
| Marital status | ||
| Never married | 2 (1.5%) | 8 (7%) |
| Married | 89 (76%) | 86 (73%) |
| Divorced/separated | 18 (15%) | 12 (10%) |
| Widowed | 9 (7.5%) | 12 (10%) |
| Income (US $) | ||
| 0–59,000 | 40 (46%) | 44 (47%) |
| 60,000+ | 47 (54%) | 51 (53%) |
| Stage of cancer | ||
| Early | 40 (33%) | 38 (32%) |
| Late | 78 (67%) | 81 (68%) |
| Site of cancer | ||
| Breast | 47 (39%) | 46 (38%) |
| Lung | 40 (35%) | 41 (35%) |
| Other | 31 (26%) | 32 (27%) |
| Mean (SD), min–max | Mean (SD), min–max | |
| Age (years) | 60.4 (9.7), 36–83 | 58.7 (11.1), 31–87 |
| CES-D | 12.1 (9.1), 0–38 | 13.5 (9.1), 0–44 |
| Chronic health conditions | 2.3 (1.6), 0–7 | 2 (1.7), 0–7 |
| Symptom limitations | 23.3 (21.9), 0–91 | 21 (17.6), 0–90 |
| Physical functioning | 65 (28.6), 0–100 | 63 (29.9), 0–100 |
TABLE 3.
Descriptive Statistics for Continuous Variables Across Time Points
| n | Minimum | Maximum | Mean | SD | |
|---|---|---|---|---|---|
| Baseline | |||||
| Physical function | 237 | 0 | 100 | 64.18 | 29.45 |
| Symptom limitation | 237 | 0 | 91 | 22.24 | 19.79 |
| CES-D | 228 | 0 | 44 | 12.78 | 9.04 |
| Week 10 | |||||
| Physical function | 191 | 0 | 100 | 64.36 | 26.87 |
| Symptom limitation | 186 | 0 | 85 | 20.19 | 17.20 |
| CES-D | 179 | 0 | 38 | 11.45 | 8.97 |
| Week 20 | |||||
| Physical function | 167 | 5 | 100 | 70.64 | 28.11 |
| Symptom limitation | 137 | 0 | 61 | 12.68 | 14.83 |
| CES-D | 151 | 0 | 39 | 8.48 | 8.81 |
| Week 32 | |||||
| Physical function | 142 | 5 | 100 | 72.74 | 28.58 |
| Symptom limitation | 113 | 0 | 78 | 12.43 | 14.89 |
| CES-D | 129 | 0 | 31 | 7.64 | 7.43 |
Note. CES-D = Center for Epidemilogic Studies Depression Scale.
Results for Aim 1
Aim 1 (Table 4) was to determine if age, chronic health conditions, stage of cancer, depressive symptomatology, symptom limitation, sex, and site of cancer moderate the effect of intervention on physical functioning. Controlling for other covariates, the expected difference in physical functioning at 20 weeks between individuals with low chronic health conditions in the intervention and the control groups is 7.69 (β01) and the expected difference for those with high chronic health conditions is 22.97 (β01 + β05). Thus, controlling for other covariates, CBI intervention may work better at Week 20 for individuals with a higher number of chronic health conditions than for individuals with low chronic health conditions (β05 = 15.287, p = .069). Furthermore, the difference in the intervention effects on physical functioning between the two groups (individuals with high and low chronic health conditions) is statistically significantly different in the instantaneous rates of change at 20 weeks (β15 = 5.757, p = .021). In other words, the intervention benefited the rates of change in physical functioning of individuals with high numbers of chronic health conditions more than those with low numbers of chronic health conditions at Week 20. Furthermore, the intervention effect on the change in acceleration between the high and low chronic conditions groups is also different (β35 = −0.39, p = .03). Thus, the expected trajectory of physical function is different between individuals within chronic health conditions by intervention status strata (Figure 2). This indicates that the number of chronic health conditions at baseline has a moderating effect on the effect of the intervention of physical function.
TABLE 4.
HLM Final Estimation of Fixed Effects: Testing Moderators of Physical Functioning
| Expected status at Week 20, π0j | Coefficient | SE | p | |
|---|---|---|---|---|
| β00 | Intercept | 55.460 | 5.519 | .000*** |
| β01 | Intervention | 7.686 | 8.018 | .339 |
| β02 | Age | −0.325 | 0.268 | .227 |
| β03 | Intervention × Age | −0.086 | 0.394 | .827 |
| β04 | Chronic health condition | −15.428 | 6.227 | .014** |
| β05 | Intervention × Chronic Health condition | 15.287 | 8.370 | .069* |
| β06 | Depression | −1.300 | 0.358 | .001*** |
| β07 | Intervention × Depression | 1.052 | 0.511 | .041** |
| β08 | Symptom limitations | 0.107 | 0.200 | .595 |
| β09 | Intervention × Symptom limitations | −0.667 | 0.261 | .012** |
| β010 | Male lung cancer | 15.708 | 6.790 | .022** |
| β011 | Intervention × Male lung cancer | −17.523 | 9.347 | .062* |
| β012 | Female breast cancer | 18.069 | 5.461 | .001* |
| β013 | Intervention × Female Breast cancer | −4.126 | 7.663 | .590 |
| β014 | Female other cancer | 8.106 | 6.355 | .204 |
| β015 | Intervention × Female other cancer | 3.729 | 8.888 | .675 |
| β016 | Male other cancer | 12.787 | 9.104 | .162 |
| β017 | Intervention × Male other cancer | 6.964 | 11.923 | .559 |
| Linear-expected change at Week 20, π1j | Coefficient | SE | p | |
|---|---|---|---|---|
|
| ||||
| β10 | Time | 2.348 | 1.017 | .022** |
| β11 | Time × Intervention | −1.025 | 1.528 | .503 |
| β12 | Time × Age | −0.032 | 0.075 | .668 |
| β13 | Time × Intervention × Age | −0.079 | 0.112 | .478 |
| β14 | Time × Chronic health Condition | −2.095 | 1.827 | .254 |
| β15 | Time × Intervention × Chronic health condition | 5.757 | 2.477 | .021** |
| β16 | Time × Depression | −0.175 | 0.110 | .114 |
| β17 | Time × Intervention × Depression | 0.261 | 0.155 | .094* |
| β18 | Time × Symptom limitation | 0.070 | 0.059 | .241 |
| β19 | Time × Intervention × Symptom limitation | −0.179 | 0.079 | .024** |
| Quadratic-expected acceleration or change in slope at Week 20, π2j | Coefficient | SE | p | |
|---|---|---|---|---|
|
| ||||
| β20 | Time2 | −0.433 | 0.291 | .139 |
| β21 | Time2 × Intervention | −0.142 | 0.442 | .749 |
| β22 | Time2 × Age | −0.026 | 0.022 | .233 |
| β23 | Time2 × Intervention × Age | 0.022 | 0.032 | .492 |
| β24 | Time2 × Chronic health Condition | 1.085 | 0.529 | .041** |
| β25 | Time2 × Intervention × chronic health condition | −1.187 | 0.718 | .100 |
| β26 | Time2 × Depression | 0.076 | 0.031 | .015** |
| β27 | Time2 × Intervention × Depression | −0.125 | 0.045 | .006*** |
| β28 | Time2 × Symptom limitation | −0.034 | 0.017 | .045** |
| β29 | Time2 × Intervention × Symptom limitation | 0.063 | 0.023 | .008*** |
| Cubic-expected change in acceleration over all time points, π3j | Coefficient | SE | p | |
|---|---|---|---|---|
|
| ||||
| β30 | Time3 | −0.153 | 0.076 | .044** |
| β31 | Time3 × Intervention | 0.021 | 0.114 | .854 |
| β32 | Time3 × Age | −0.002 | 0.006 | .613 |
| β33 | Time3 × Intervention × Age | 0.007 | 0.008 | .407 |
| β34 | Time3 × Chronic health Condition | 0.236 | 0.136 | .083* |
| β35 | Time3 × Intervention × Chronic health condition | −0.393 | 0.185 | .034** |
| β36 | Time3 × Depression | 0.016 | 0.008 | .044** |
| β37 | Time3 × Intervention × Depression | −0.031 | 0.012 | .009*** |
| β38 | Time3 × Symptom limitation | −0.003 | 0.004 | .438 |
| β39 | Time3 × Intervention × Symptom limitation | 0.015 | 0.006 | .011** |
Note: β00 intercept = expected physical functioning status at Week 20 for a female with lung cancer in the nonintervention group, with age = 60, low chronic conditions, depressive symptomatology = 16, and symptom limitations = 22.
Note: β10 Time is the expected change in physical functioning at Week 20 for an individual with cancer in the nonintervention group, with age = 60, low chronic conditions, depressive symptomatology = 16, and symptom limitations = 22.
Note: β20 Time2 is the expected deceleration in physical functioning at Week 20 for an individual with cancer in the nonintervention group, with age = 60, low chronic conditions, depressive symptomatology = 16, and symptom limitations = 22.
Note: β30 Time3 is the expected change in deceleration of physical functioning for an individual with cancer in the nonintervention group, with age = 60, low chronic conditions, depressive symptomatology = 16, and symptom limitations = 22.
Note: p < .1;
p < .05;
p < .01.
FIGURE 2.
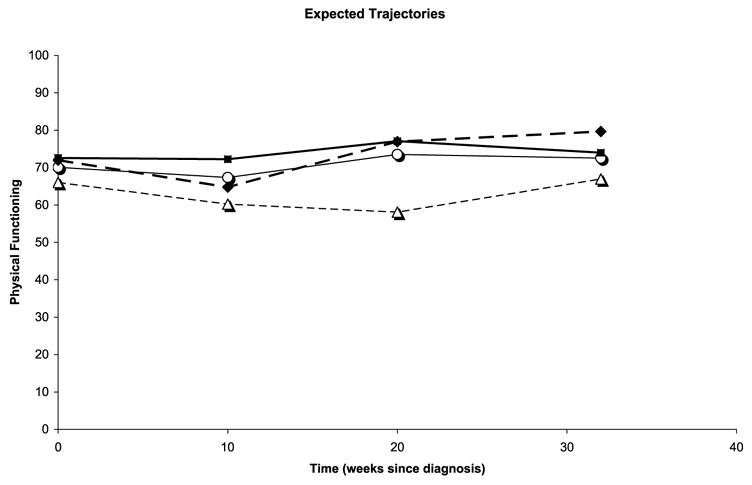
Physical functioning trajectories by number of chronic health conditions and treatment group. –○– control, chronic low; –△– control, chronic high; –■– trt, chronic low; –◆– trt, chronic high.
Controlling for other covariates, the effect of intervention similarly varies according to an individual’s baseline depressive symptomatology at Week 20 (β07 = 1.05, p = .04). However, among individuals with higher levels of depressive symptomatology, the intervention effect on the curvature of the physical functioning trajectory at Week 20 was more negative than that of individuals with lower depressive symptomatology (β27 = −0.13, p < .01). Similarly, the intervention effect on the change in curvature of the physical functioning trajectory for individuals with higher depressive symptomatology was more negative than for individuals with lower depressive symptomatology (β37 = −0.03, p < .01) over all time points. Thus, individuals with a score of 16 on the CES-D receiving intervention improved less in physical function than those with lower depressive symptomatology in the intervention group.
Controlling for other covariates, the effect of intervention on physical function also varies according to an individual’s baseline symptom limitations. Individuals with higher symptom limitations at baseline respond to the intervention at Week 20 less than do those with lower symptom limitations at baseline (β09 = −0.67, p = .01). Moreover, the intervention has a more negative effect on the rate of change of physical functioning at Week 20 for individuals with higher baseline symptom limitations than it does for those with lower baseline symptom limitations (β19 = −0.18, p = .02). However, the intervention has a more positive effect on the expected curvature or acceleration at Week 20 and the overall change in curvature or acceleration for individuals with higher symptom limitations at baseline than for individuals with lower symptom limitations at baseline (β29 = 0.06, p < .01 and β39 = 0.02, p = .01, respectively). Thus, individuals with higher symptom limitations at baseline in the intervention group benefited more from the intervention than did those with lower symptom limitations receiving intervention.
Finally, no moderating effect of intervention by age (β03 = −0.086, p = .827, β13 = −0.079, p = .478, β23 = 0.022, p = .492, β33 = 0.007, p = .407) or by site and gender (β011 = −17.523, p = .062, β013 = −4.126, p = .590, β015 = 3.729, p = .675, β017 = 6.964, p = .675) was found. However, females with breast cancer experienced higher levels of physical functioning than females with lung cancer (β012 = 18.069, p = .001), and males with lung cancer experienced higher physical functioning than females with lung cancer (β010 = 15.708, p = .022).
Results for Aim 2
Aim 2 was to determine if symptom limitations mediate the effect of the intervention on physical functioning. Because there was no overall (direct or indirect) effect of the intervention on physical functioning detected (χ2 = 1.66, df = 4, p > .5) using the first mediation model (Equation 3), further testing of the mediation effect (using the latter two models) did not occur.
Discussion
There is ample evidence of the effectiveness of interventions guided by cognitive behavioral theory. However, there is less evidence of moderators and mediators of intervention on outcomes available to inform the next generation of RCTs and guide clinical applications of interventions. To aid in alleviating this deficit, this study explored factors that were hypothesized to moderate and mediate the effect of a cognitive behavioral intervention on physical function among individuals with cancer.
As physical functioning is known to vary by age and stage and site of cancer, these variables were hypothesized weeks are observed for women with lung cancer. Controlling for other covariates at 20 weeks, women with breast cancer had an average score of 73 on the SF-36 physical function subscale, compared to an average physical function score of 55 for women with lung cancer. This finding was in agreement with the findings of Kurtz et al. (1999). Significant differences were also seen within site by sex as with males and females with lung cancer in the current study. However, sex by site of cancer was not found to moderate the effect of the intervention effect on physical functioning. Additionally, an individual’s age and stage of cancer were not found to moderate the effect of intervention on physical function.
Consistent with earlier work by our research team (Given et al., 2000), having three or more chronic health conditions was associated with lower physical functioning at Week 20. The results of this study indicate that the intervention had a greater impact at 20 weeks on participants with three or more chronic health conditions compared to those with two or fewer chronic health conditions. Thus, although the number of chronic health conditions cannot be changed, this intervention was particularly effective among those who were perhaps at greater risk of lower physical functioning.
The study results support and extend other research findings that suggest a strong relationship between depressive symptomatology at baseline and subsequent physical functioning (Patrick et al., 2004). This study provides further evidence that depressive symptomatology has a notable impact on physical functioning. At all time points, individuals with higher depressive symptomatology had lower physical functioning than did those with lower depressive symptomatology. This study’s findings suggest that efforts should be made to identify and treat individuals with cancer who have high depressive symptomatology upon diagnosis or initiation of cancer treatment. If depressive symptomatology is treated, individuals with cancer may improve in physical functioning. Additionally, without corresponding improvement in depression, it is unlikely that individuals with higher depressive symptomatology will respond significantly to cognitive behavioral interventions intended to improve physical functioning during their cancer experience.
Consistent with other research (Dodd et al., 2001; Kurtz et al., 2001; Serlin et al., 1995), this research supports findings of increasing symptoms being associated with decreased functional status in individuals with cancer. This research also supports that baseline symptom limitation levels moderate the effects of the intervention on physical function. As individuals with higher symptom limitation in the intervention group move through the cancer treatment experience, their physical functioning improves quickly, and at the end of the study they had greater improvement in physical functioning compared to those who entered the study with lower symptom limitations.
The results of this study did not support the hypothesis that symptom limitation would mediate the effect of intervention on physical function. According to cognitive behavioral theory, providing interventions to individuals with cancer should increase their self-efficacy by providing empirically based strategies to develop skills. This analysis did not consider the strategies provided by intervention nurses, nor the skills or amount of self-efficacy acquired by participants. Thus, it is possible that some strategies to enhance self-efficacy have different effects on physical functioning. It is also possible that the individuals receiving the intervention had varying degrees of skill acquisition. As this study conceptualized, rather than operationalized self-efficacy, future studies are needed that operationalize self-efficacy to better test the theoretical assumptions of the cognitive behavioral theory.
Symptom limitations explained about 30% of the variance in physical functioning after adjusting for time. Therefore, although there was a significant effect of the intervention on symptom limitations (Doorenbos et al., 2005), there would need to be a larger effect of symptom limitations, a larger direct effect of the intervention on physical functioning, or a higher power derived from a larger sample size, before a statistically verifiable effect of intervention on physical functioning could be established by the study. As the RCT was powered to examine the effect of the intervention on symptom severity (Given et al., 2004a), it is possible there was insufficient power to determine the hypothesized mediation. Another study designed to test this effect specifically may be appropriate.
Another issue that might have influenced the non-significant results in the area of mediation is the possibility that the symptom limitation measure did not have adequate sensitivity. The study relied on a summary score of symptom limitations; it is possible that limitations of some symptoms have different effects on physical functioning. Increasing pain has been clearly linked in longitudinal studies with decreasing physical function (Williamson & Schulz, 1995); however, the association between other symptoms and physical function may be less strong. Additional research with larger numbers of participants experiencing each symptom would assist in clarifying the potential differential effect of particular symptoms on physical functioning.
As physical function had far less variability than symptom limitation, any effects of the intervention are less visible. This holds true for the direct effect of the intervention on physical function as well as any effects mediated by physical function. Physical function was constrained by a ceiling effect, whereas symptom limitation was not; thus, the relative insensitivity of physical function may have obscured a possible significant association.
Measures used in this study were based on participant self-reports. It is possible that individuals with depressive symptomatology systematically report their physical functioning to be worse than it actually is. This may, in part, explain the lower reported physical functioning among respondents with high depressive symptomatology.
Clinical and Research Implications
The interaction effects of interventions with chronic health conditions, symptom limitation, and depressive symptomatology provide nurse researchers with additional information to help clarify the choice of inclusion and exclusion criteria. Stratification to maximize power in subsequent RCTs can be based on the knowledge that individuals with varying chronic health conditions, symptom limitations, and depressive symptomatology at baseline have differential responses to the intervention. For nurse clinicians, information on moderators can help tailor interventions to a profile of individuals with cancer entering into a chemotherapy regimen at elevated risk of poor physical functioning. As lower physical functioning has been linked with increased mortality, interventions initiated at diagnosis or start of cancer treatment may improve poor physical functioning, possibly having an effect on mortality and certainly improving quality of life.
Acknowledgments
The authors wish to thank Professor Stephen W. Raudenbush, PhD, School of Education, University of Michigan, for his statistical advice on this manuscript and Karyn Huenemann, MPhil, Simon Fraser University, for her editing of the manuscript.
National Cancer Institute Grant #R01 CA79280: Family Home Care for Cancer: A Community-Based Model, PI Barbara Given, in affiliation with the Walther Cancer Institute, Indianapolis, IN; National Institute on Aging Grant #P30 AG08808; and The U.S. Army Medical Research and Materiel Command under W81XWH-04-1-0469 supported this work.
Appendix A
Level 2:
References
- American Cancer Society. Cancer facts and figures. Atlanta, GA: American Cancer Society; 2005. [Google Scholar]
- American Joint Committee on Cancer. AJCC cancer staging manual. 6. Philadelphia, PA: Lippincott, Williams, & Wilkins; 2003. [Google Scholar]
- Bandura A. Self-efficacy: The exercise of control. New York: Freeman; 1997. [Google Scholar]
- Baron RM, Kenny DA. The moderator–mediator variable distinction in social psychological research: Conceptual, strategic, and statistical considerations. Journal of Personality and Social Psychology. 1986;51:1173–1182. doi: 10.1037//0022-3514.51.6.1173. [DOI] [PubMed] [Google Scholar]
- Bellg AJ, Borrelli B, Resnick B, Hecht J, Minicucci DS, Ory M, et al. Enhancing treatment fidelity in health behavior change studies: Best practices and recommendations from the NIH Behavior Change Consortium. Health Psychology. 2004;23:443–451. doi: 10.1037/0278-6133.23.5.443. [DOI] [PubMed] [Google Scholar]
- Bennett JA. Mediator and moderator variables in nursing research: Conceptual and statistical differences. Research in Nursing & Health. 2000;23:415–420. doi: 10.1002/1098-240x(200010)23:5<415::aid-nur8>3.0.co;2-h. [DOI] [PubMed] [Google Scholar]
- Bennett JA, Stewart AL, Kayser-Jones J, Glaser D. The mediating effect of pain and fatigue on level of functioning in older adults. Nursing Research. 2002;51:254–265. doi: 10.1097/00006199-200207000-00006. [DOI] [PubMed] [Google Scholar]
- Cooley ME. Symptoms in adults with lung cancer: A systematic research review. Journal of Pain and Symptom Management. 2000;19:137–153. doi: 10.1016/s0885-3924(99)00150-5. [DOI] [PubMed] [Google Scholar]
- Devine EC. Meta-analysis of the effect of psychoeducational interventions on pain in adults with cancer. Oncology Nursing Forum. 2003;30:75–89. doi: 10.1188/03.ONF.75-89. [DOI] [PubMed] [Google Scholar]
- Devine EC, Westlake SK. The effects of psycho-educational care provided to adults with cancer: Meta-analysis of 116 studies. Oncology Nursing Forum. 1995;22:1369–1381. [PubMed] [Google Scholar]
- Dobson KD, editor. Handbook of cognitive–behavioral therapies. 2. New York: Guilford Press; 2001. [Google Scholar]
- Dodd MJ, Miaskowski C, Paul SM. Symptom clusters and their effect on the functional status of patients with cancer. Oncology Nursing Forum. 2001;28:465–470. [PubMed] [Google Scholar]
- Doorenbos AZ, Given B, Given CW, Verbitsky N, Cimprich B, McCorkle R. Reducing symptom limitations: A cognitive behavioral intervention randomized trial. Psycho-Oncology. 2005;14:574–584. doi: 10.1002/pon.874. [DOI] [PMC free article] [PubMed] [Google Scholar]
- Dudley WN, Benuzillo JG, Carrico MS. SPSS and SAS programming for the testing of mediation models. Nursing Research. 2004;53:59–62. doi: 10.1097/00006199-200401000-00009. [DOI] [PubMed] [Google Scholar]
- Given CW, Given B, Azzouz F, Stommel M, Kozachik S. Comparison of changes in physical functioning of elderly patients with new diagnoses of cancer. Medical Care. 2000;38:482–493. doi: 10.1097/00005650-200005000-00005. [DOI] [PubMed] [Google Scholar]
- Given CW, Given B, Champion VL, Kozachik S, DeVoss DN, editors. Evidence-based behavioral interventions in oncology: State of the knowledge across the cancer care continuum. New York: Springer; 2003. [Google Scholar]
- Given CW, Given B, Rahbar M, Jeon S, McCorkle R, Cimprich B, et al. Effect of a cognitive behavioral intervention on reducing symptom severity during chemotherapy. Journal of Clinical Oncology. 2004a;22:507–516. doi: 10.1200/JCO.2004.01.241. [DOI] [PubMed] [Google Scholar]
- Given CW, Given B, Rahbar M, Jeon S, McCorkle R, Cimprich B, et al. Does a symptom management intervention affect depression among cancer patients: Results from a clinical trial. Psycho-Oncology. 2004b;13:818–830. doi: 10.1002/pon.807. [DOI] [PubMed] [Google Scholar]
- Given CW, Stommel M, Given B, Osuch J, Kurtz ME, Kurtz JC. The influence of cancer patients’ symptoms and functional status on patients’ depression and family care-givers’ reaction and depression. Health Psychology. 1993;12:277–285. doi: 10.1037//0278-6133.12.4.277. [DOI] [PubMed] [Google Scholar]
- Katz JN, Chang LC, Sangha O, Fossel AH, Bates DW. Can comorbidity be measured by questionnaire rather than medical record review? Medical Care. 1996;34:73–84. doi: 10.1097/00005650-199601000-00006. [DOI] [PubMed] [Google Scholar]
- Kenny DA, Korchmaros JD, Bolger N. Lower level mediation in multilevel models. Psychological Methods. 2003;8:115–128. doi: 10.1037/1082-989x.8.2.115. [DOI] [PubMed] [Google Scholar]
- Kornblith AB, Holland JC. Model for quality-of-life research from the Cancer and Leukemia Group B: The telephone interview, conceptual approach to measurement, and theoretical framework. Journal of the National Cancer Institute. 1996;20:55–62. [PubMed] [Google Scholar]
- Kurtz ME, Kurtz JC, Stommel M, Given CW, Given BA. The influence of symptoms, age, comorbidity and cancer site on physical functioning and mental health of geriatric women patients. Women and Health. 1999;29:1–12. doi: 10.1300/J013v29n03_01. [DOI] [PubMed] [Google Scholar]
- Kurtz ME, Kurtz JC, Stommel M, Given CW, Given BA. Symptomatology and loss of physical functioning among geriatric patients with lung cancer. Journal of Pain and Symptom Management. 2000;19:249–256. doi: 10.1016/s0885-3924(00)00120-2. [DOI] [PubMed] [Google Scholar]
- Kurtz ME, Kurtz JC, Stommel M, Given CW, Given BA. Physical functioning and depression among older persons with cancer. Cancer Practice. 2001;9:11–18. doi: 10.1046/j.1523-5394.2001.91004.x. [DOI] [PubMed] [Google Scholar]
- Krull JL, MacKinnon DP. Multilevel modeling of individual and group level mediated effects. Multivariate Behavioral Research. 2001;36:249–277. doi: 10.1207/S15327906MBR3602_06. [DOI] [PubMed] [Google Scholar]
- Little RJ, Rubin DB. Statistical analysis with missing data. 2. Hoboken, NJ: Wiley; 2002. [Google Scholar]
- Meyer TJ, Mark MM. Effects of psychosocial interventions with adult cancer patients: A meta-analysis of randomized experiments. Health Psychology. 1995;14:101–108. doi: 10.1037//0278-6133.14.2.101. [DOI] [PubMed] [Google Scholar]
- Moore JE, Von Korff M, Cherkin D, Saunders K, Lorig K. A randomized trial of a cognitive–behavioral program for enhancing back pain self care in a primary care setting. Pain. 2000;88:145–153. doi: 10.1016/S0304-3959(00)00314-6. [DOI] [PubMed] [Google Scholar]
- Oliver JW, Kravitz RL, Kaplan SH, Meyers FJ. Individualized patient education and coaching to improve pain control among cancer outpatients. Journal of Clinical Oncology. 2001;19:2206–2212. doi: 10.1200/JCO.2001.19.8.2206. [DOI] [PubMed] [Google Scholar]
- Patrick DL, Ferketich SL, Frame PS, Harris JJ, Hendricks CB, Levin B, et al. National Institutes of Health State-of-the-Science Conference statement: Symptom management in cancer: Pain, depression and fatigue, July 15–17, 2002. Journal of the National Cancer Institute. 2003;95:1110–1117. doi: 10.1093/jnci/djg014. [DOI] [PubMed] [Google Scholar]
- Patrick JH, Johnson JC, Goins RT, Brown DK. The effects of depressed affect on functional disability among rural older adults. Quality of Life Research. 2004;13:959–967. doi: 10.1023/B:QURE.0000025585.92340.7a. [DOI] [PubMed] [Google Scholar]
- Radloff LS. The CES-D Scale: A self-report depression scale for research in the general population. Journal of Applied Psychological Measurement. 1977;1:385–401. [Google Scholar]
- Raudenbush SW. Comparing personal trajectories and drawing causal inferences from longitudinal data. Annual Reviews in Psychology. 2001;52:501–525. doi: 10.1146/annurev.psych.52.1.501. [DOI] [PubMed] [Google Scholar]
- Raudenbush SW, Bryk AS. Hierarchical linear models. 2. Thousand Oaks, CA: Sage; 2002. [Google Scholar]
- Raudenbush SW, Bryk A, Cheong YF, Congdon R. HLM6: Hierarchical linear and nonlinear modeling. Lincolnwood, IL: Scientific Software International; 2004. [Google Scholar]
- Raudenbush SW, Sampson R. Assessing direct and indirect effects in multilevel designs with latent variables. Sociological Methods & Research. 1999;28:123–153. [Google Scholar]
- Resnick B, Inguito P, Orwig D, Yahiro JY, Hawkes W, Werner M, et al. Treatment fidelity in behavior change research: A case example. Nursing Research. 2005;54:139–143. doi: 10.1097/00006199-200503000-00010. [DOI] [PubMed] [Google Scholar]
- Serlin RC, Mendoza TR, Nakamura Y, Edwards KR, Cleeland CS. When is cancer pain mild, moderate or severe? Grading pain severity by its interference with function. Pain. 1995;61:277–284. doi: 10.1016/0304-3959(94)00178-H. [DOI] [PubMed] [Google Scholar]
- Ware JE, Jr, Gandek B. Overview of the SF-36 Health Survey and the International Quality-of-Life Assessment (IQOLA) Project. Journal of Clinical Epidemiology. 1998;51:903–912. doi: 10.1016/s0895-4356(98)00081-x. [DOI] [PubMed] [Google Scholar]
- Ware JE, Snow KK, Kosinski M, Gandek B. SF-36 Health Survey: Manual and interpretation guide. Boston: Nimrod Press; 1993. [Google Scholar]
- Williamson GM, Schulz R. Activity restriction mediates the association between pain and depressed affect: A study of younger and older adult cancer patients. Psychological Aging. 1995;10:369–378. doi: 10.1037//0882-7974.10.3.369. [DOI] [PubMed] [Google Scholar]