Abstract
Quantitative structure-activity relationship (QSAR) models are useful in understanding how chemical structure relates to the biological activity of natural and synthetic chemicals and for design of newer and better therapeutics. In the present study, 46 flavonoids and related polyphenols were evaluated for direct/indirect antioxidant activity in three different assay systems of increasing complexity (chemical, enzymatic, and intact phagocytes). Based on these data, two different QSAR models were developed using i) physicochemical and structural (PC&S) descriptors to generate multiparameter partial least squares (PLS) regression equations derived from optimized molecular structures of the tested compounds and ii) a partial 3D comparison of the 46 compounds with local fingerprints obtained from fragments of the molecules by the frontal polygon (FP) method. We obtained much higher QSAR correlation coefficients (r) for flavonoid end-point antioxidant activity in all 3 assay systems using the FP method (0.966, 0.948, and 0.965 for datasets in evaluated in the biochemical, enzymatic, and whole cells assay systems, respectively). Furthermore, high leave-one-out cross-validation coefficients (q2) of 0.907, 0.821, and 0.897 for these datasets, respectively, indicated enhanced predictive ability and robustness of the model. Using the FP method, structural fragments (submolecules) responsible for the end-point antioxidant activity in the three assay systems were also identified. To our knowledge, this is the first QSAR model derived for description of flavonoid direct/indirect antioxidant effects in a cellular system, and this model could form the basis for further drug development of flavonoid-like antioxidant compounds with therapeutic potential.
Keywords: Flavonoids, Antioxidants, Phagocytes, Reactive oxygen species, Quantitative structure-activity relationship analysis, Molecular descriptors, Frontal polygons, Drug design
1. Introduction
Flavonoids are widely distributed across the plant kingdom and represent the most abundant antioxidants in the diet 1,2. These compounds have gained tremendous interest as potential therapeutic agents against a wide variety of diseases, most of which involve oxidant damage 3. The unusually wide pharmacological spectrum of flavonoids was originally thought to result from their antioxidant activity; however, recent studies suggest various flavonoids may utilize other protective mechanisms as well 3,4. Flavonoids can scavenge a wide range of reactive oxygen species (ROS) and can inhibit lipid peroxidation 1,4. In biological organisms, ROS are generated by a number of enzymatic systems (reviewed in 5,6), and inhibition of these enzymes or down-regulation of their intracellular expression and activity has also been proposed to be a important mechanism of flavonoid “antioxidant” effects 7–10. Thus, the term antioxidant has been defined in a broader sense as any substance that directly scavenges ROS or indirectly acts to upregulate antioxidant defenses or inhibit ROS production 11.
A number of studies suggest flavonoids have anti-inflammatory action via their ability to modulate ROS production by phagocytic leukocytes 7,9,12. Phagocytes can generate high levels of ROS at sites of inflammation, which contributes to local tissue injury and can lead to the development chronic inflammatory conditions 13,14. Thus, the identification of new compounds that are able down-regulate phagocyte ROS production has been of great interest 12. Indeed, flavonoids have been shown to inhibit a variety of enzymes involved in phagocyte signaling and ROS production 7,9,15–22. Flavonoids utilize a diverse array of antioxidant and non-antioxidant mechanisms, making it difficult to develop quantitative structure-activity relationship (QSAR) models of flavonoid molecules that accurately predict end-point inhibitory effects on ROS production in enzymatic and cell-based systems. Nevertheless, such a QSAR model would be an extremely useful tool for the development of novel flavonoid-based antioxidants and anti-inflammatory agents 23.
Although structure-activity relationship (SAR) analysis has been reported for various flavonoid antioxidant and antiradical activities (e.g., see 24–27), only a few QSAR models have been developed 28–32. Most of these models are limited in scope, however, correlating to only a few molecular parameters and/or limited to structurally-related flavonoids. Since different moieties of the flavonoid scaffold are likely responsible for antiradical activity and inhibition of ROS production in enzymatic and whole cell systems 8,33, we suggest subdivision of the flavonoid molecule into submolecular fragments could potentially be a more informative approach in QSAR modeling. In addition, an indirect approach would be preferable for QSAR modeling of drug effects in complex systems (enzymatic systems, cells, and organisms), since this type of approach allows for modeling when an exact structure of the biological target is not known.
QSAR models utilizing a flexible docking approach have been shown to be highly efficient in the description of ligand-receptor interactions 34. Alternatively, approaches utilizing ligand-based 3D-QSAR principles are required when detailed receptor structure is not available. These methods rely on pair-wise comparison of molecular spatial structures within a dataset or their superimposition on a template molecule 35; however, the problems of conformational flexibility and structural diversity are significant in performing structure comparisons when a data set includes molecules from different chemical classes. Although several approaches for resolving these problems have been suggested 36,37, there are still difficulties in defining optimal orientation and/or conformation of a compound with respect to a given template.
In the present studies, we developed an indirect, integrated QSAR model to predict end-point antioxidant activity of flavonoids in chemical, enzymatic, and cell-based systems. Comparison with an independent model that was based on physicochemical and structural (PC&S) molecular descriptors showed the indirect QSAR approach provides a relatively accurate model to evaluate antioxidant activities of flavonoid compounds. Thus, this approach could be further developed for de novo design of novel polyphenol compounds.
2. Results and discussion
2.1. End-point antioxidant activity of polyphenols in chemical, enzymatic, and cellular systems
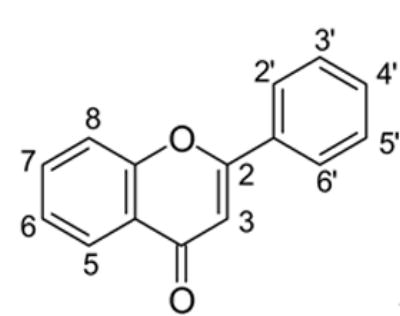
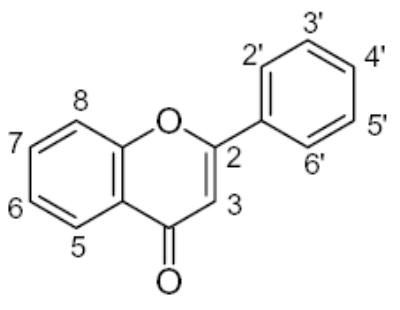
The set of 46 flavonoid and polyphenol compounds used in this study (indicated as compounds 1–46), included three main classes of flavonoids: flavones (34 compounds), flavanones (5 compounds), and isoflavones (2 compounds) (structures shown in Tables 1 and 2). These compounds were assessed for direct/indirect antioxidant activity in three different systems of increasing complexity (chemical, enzymatic, and intact cells). Consequently, end-point antioxidant activity was detected, regardless of whether the polyphenol exerted its effect on the radical itself or, in the case of the enzymatic and cellular systems, on the radical-generating system. As shown in Tables 1 and 2, the various flavonoid compounds exhibited different levels of activity in each system; however, there was little difference in the order of effectiveness of the compounds in the chemical and enzymatic test-systems. Flavones 1 and 2 were most potent free radical scavengers, with DPPH radical scavenging activity of IC25 <1 μM. Flavone 2 was the most potent antioxidant in the X/XO system as well. Flavones 1 and 29–31 were insoluble in aqueous buffers and could not be evaluated in the enzymatic and cellular systems.
Table 1.
Structure and antioxidant activity of the flavones and flavanones tested
 |
 |
|||||||||||
|---|---|---|---|---|---|---|---|---|---|---|---|---|
| Flavones 1–34 | Flavanones 35–39 | |||||||||||
| N | Substituents at carbon position | DPPH IC25, μM | X/XO IC25, μM | BM cells IC25, nM | ||||||||
| C-ring | A-ring | B-ring | ||||||||||
| 3 | 5 | 6 | 7 | 8 | 2’ | 3’ | 4’ | 5’ | ||||
| 1 | H | H | H | H | H | OH | OH | H | H | 0.5 | Ins. | Ins. |
| 2 | OH | H | H | H | H | H | OH | OH | H | 0.7 | 0.68 | 1.75 |
| 3 | OH | H | H | H | H | H | OH | H | H | N.A. | N.A. | 240 |
| 4 | OH | OH | H | OH | OGlu | H | OH | OH | H | 4.3 | 6.4 | 67.5 |
| 5 | OH | OH | H | OH | H | H | H | OH | H | 22.6 | N.A. | 4.0 |
| 6 | OH | H | H | OH | H | H | H | OH | H | 4.1 | 48.0 | 23.0 |
| 7 | H | H | H | H | H | H | OMe | OH | H | N.A. | N.A. | 14.5 |
| 8 | H | OMe | H | H | H | H | H | OH | H | N.A. | N.A. | 1270 |
| 9 | H | OH | H | OH | H | OH | H | H | H | N.A. | N.A. | 5.7 |
| 10 | H | H | H | OH | OH | OH | H | H | H | 2.1 | 1.2 | 0.52 |
| 11 | H | H | H | OH | OH | H | OH | H | H | 2.7 | 2.4 | 0.8 |
| 12 | OMe | H | H | OH | H | H | H | H | H | N.A. | N.A. | 1050 |
| 13 | H | H | H | OMe | OH | H | H | H | H | N.A. | N.A. | 3.1 |
| 14 | H | OH | H | OH | H | H | H | OMe | H | N.A. | 16.3 | 1180 |
| 15 | H | OH | H | OH | H | H | H | OH | H | N.A. | N.A. | 113 |
| 16 | H | OH | H | O-R1 | H | H | H | OH | H | N.D. | 7.2 | 201 |
| 17 | H | OH | OH | OH | H | H | H | H | H | 1.5 | 2.6 | 10.4 |
| 18 | H | OH | OH | OGlu | H | H | H | H | H | 6.4 | 18.9 | 2.0 |
| 19 | H | OH | H | OR2 | H | H | OH | OMe | H | N.A. | N.A. | 70 |
| 20 | OH | H | H | OH | H | H | OH | OH | H | 7.9 | 2.7 | 31 |
| 21 | OH | OH | H | OH | H | H | H | H | H | 86.4 | N.A. | 4.3 |
| 22 | OH | OH | H | OH | H | H | OH | OH | OH | 41.8 | 6.8 | 5.2 |
| 23 | OH | OH | H | OH | H | H | OH | OH | H | 8.1 | 3.0 | 3.5 |
| 24 | H | OH | H | OH | H | H | OH | OH | H | 12.1 | 6.9 | 13.7 |
| 25 | H | OH | H | OGlu | H | H | OH | OH | H | 2.0 | 2.9 | 4.4 |
| 26 | H | OH | H | OGlu* | H | H | H | OMe | H | N.A. | N.A. | 1930 |
| 27 | OMe | OH | H | OH | H | H | OH | OH | H | 5.9 | 3.6 | 58 |
| 28 | OR2 | OH | H | OH | H | H | OH | OH | H | 12.2 | 4.5 | 33 |
| 29 | OH | H | OH | H | H | H | H | OH | H | 4.5 | Ins. | Ins. |
| 30 | H | OH | H | H | H | H | OH | OH | H | 1.5 | Ins. | Ins. |
| 31 | OH | H | Me | H | H | H | OMe | OMe | H | 89 | Ins. | Ins. |
| 32 | OH | H | H | H | H | OMe | H | H | H | N.A. | Ins. | 49 |
| 33 | H | OH | H | OMe | H | H | H | H | H | N.A. | N.A. | 160 |
| 34 | H | OH | H | OH | H | H | H | H | H | N.A. | N.A. | 4480 |
| 35 | H | H | H | H | H | OH | H | H | H | N.A. | N.A. | 5620 |
| 36 | H | H | H | H | H | H | H | OH | H | N.A. | N.A. | 3300 |
| 37 | H | OH | H | OR2 | H | H | OH | OMe | H | N.A. | N.A. | 38 |
| 38 | H | OH | H | OH | H | H | H | OH | H | N.A. | N.A. | 551 |
| 39 | H | OH | H | OH | H | H | OH | OMe | H | 83 | N.A. | 647 |
R1, neohesperidoside, R2, rhamnose-glucose; OH groups with the lowest O-H bond dissociation energy are shown in bold (*for compound 26, the lowest dissociation energy obtained was obtained for the OH group from CH2OH of the carbohydrate residue). N.A., not active; N.D., not determined; Ins., compound was insoluble in the assay buffer.
Table 2.
Structure and antioxidant activity of the isoflavones and other polyphenols tested
OH groups with the lowest O-H bond dissociation energy are shown in bold (*for compound 40, the lowest dissociation energy obtained was for the OH group from CH2OH of the carbohydrate residue). N.A., not active; N.D., not determined
The majority of compounds (84.2%) with antioxidant activity in the X/XO system were also active in the DPPH system, and a relatively strong linear correlation (r=0.817, n=13) was obtained by plotting the logarithms of these activities, with the exception of 2 outliers (compounds 6 and 18) (Fig. 1A). To account for inactive compounds, we plotted the reciprocal values of IC25 (1/IC25), where inactive compounds were assigned a value of 0, and obtained an even stronger linear correlation without any outliers (r=0.920, n=33) (Fig. 1B). The point corresponding to compound 2 in this case lies far from the group of other points, so the correlation coefficient may be somewhat overestimated. Nevertheless, without this point we still obtained a relatively high correlation [r=0.788 (n=32)]. In support of these data, a positive relationship between DPPH radical scavenging activity and inhibition of superoxide anion (O2−·) production in the X/XO system was reported previously for several flavonoids 38,39. However, the antioxidant effect of flavonoids in the X/XO system can result from the combined effects of O2−· scavenging and XO inhibition 8,9,40. Thus, the mechanisms involved in flavonoid antioxidant effects in the X/XO system are difficult to define when there is close efficacy for radical scavenging and enzyme inhibition 41. Indeed, flavones have been proposed to act in their anionic form as electron donors in a charge-transfer mechanism with XO 42 and could, thereby, be undergoing redox cycling.
Figure 1.
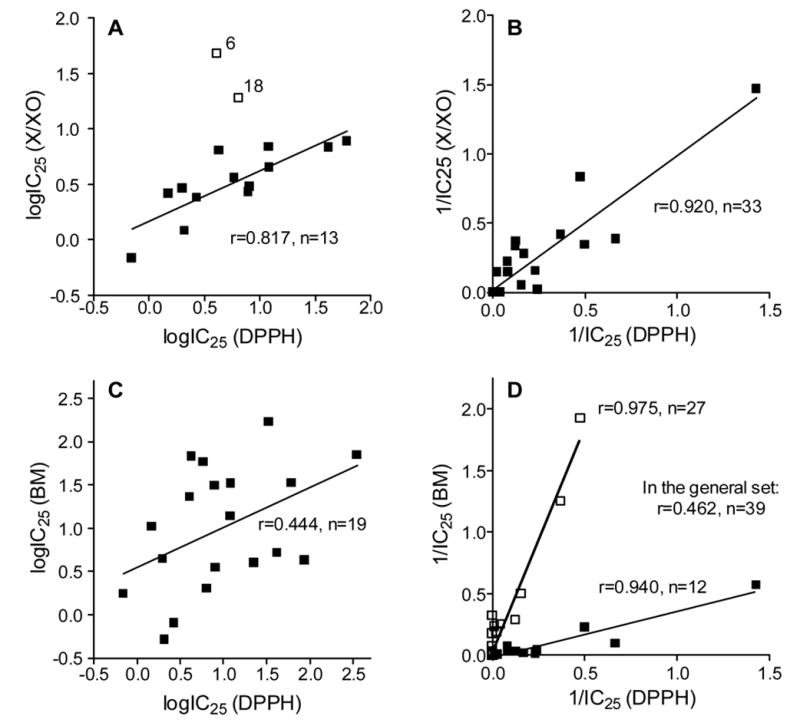
Correlation of end-point antioxidant activity in the DPPH, X/XO, and BM phagocyte assay systems. Panels A and B: Plots of polyphenol DPPH radical scavenging activity vs antioxidant effects in the X/XO system. Panels C and D: Plots of polyphenol DPPH radical scavenging activity vs antioxidant effects in the in BM cell system. Activities are represented as logarithm (logIC25) (A and C) and inverse (1/IC25) values (B and D). Compounds 6 and 18 were omitted from the regression calculation in panel A and are shown as outliers.
All of the water-soluble compounds tested (2–28, 32–46) exhibited end-point antioxidant activity in the BM leukocyte system, with a broad range of activity (IC25 values 0.5 nM < IC25 < 5.6 μM) (Tables 1 and 2). Flavones 2, 10, and 11 were the most potent compounds, with IC25<2 nM. However, in contrast to the X/XO system, the linear correlation was rather low (r=0.444, n=39) when comparing logarithm values of antioxidant activity in the DPPH radical and whole cell systems (Fig. 1C). One possible explanation for the low correlation is that a number of inactive compounds in the DPPH radical system were active in the whole cell system. Indeed, plotting these activities as reciprocal values split the compounds into two groups (Fig. 1D). One group had, in general, high DPPH radical scavenging activity (r=0.940, n=12), and the other group included, for the most part, low-activity and inactive DPPH radical scavengers (r=0.975, n=27). Note, however, that 10 of the 23 active polyphenols (hit rate of 43.5%) had very high antioxidant activity in this cell system (0.5 nM < IC25 < 6 nM) and were far more effective than similar and/or related flavonoids used to inhibit agonist-stimulated ROS production by neutrophils 19,33,43,44.
2.2. QSAR modeling
Based on relative antioxidant activity in each assay system, the compounds were grouped into three sets, designated as the DPPH, X/XO, and BM sets, respectively. The DPPH set consisted of 23 DPPH radical scavengers (1, 2, 4–6, 10, 11, 17, 18, 20–25, 27–31, 42, 43, and 45). The X/XO set included 19 compounds with the ability to scavenge and/or inhibit O2−· generation in the X/XO system (compounds 2, 4, 6, 10, 11, 14, 16–18, 20, 22–25, 27, 28, 38, 42, and 46). Finally, the BM set was comprised of 42 scavengers and/or inhibitors of ROS production by BM leukocytes (2–28, and 32–46).
Two types of QSAR approaches were utilized for characterization and analysis of relationship between polyphenol structures and their antioxidant activities. One approach used “classical” physicochemical and quantum-mechanical characteristics calculated by the semi-empirical PM3 method (ΔΔHf, S, V, Ehydr, logP, R, pe, EHOMO, ELUMO) together with integer variables obtained directly from structural formulae (NA, NB, NC, NBA, NBB, NOH, Npyr) (see Materials and Methods). These descriptors, which are shown in Supplementary Data Table S1, contain information about the whole molecule and have been applied previously to QSAR analysis of other flavonoid series 28,31,45–50. The second approach utilized the frontal polygon (FP) method and is based on the principles of local 3D similarity between molecules 51 and has been used previously to successfully develop QSAR models describing the biological activities of nitroazoles 52, cytochrome P450 inducers 53, and CXCR2 inhibitors 54. This method is based on determining local fingerprints obtained from rigid and flexible fragments of molecules and uses both geometric and physicochemical parameters of molecular recognition and overcomes problems associated with heterogeneity of target molecules. In addition, the FP method can allow one to derive QSAR for a variety of diverse molecules. For comparison, the characteristics derived for both models are summarized in Table 3, with FP models exhibiting the best correlation or predictive ability indicated in bold. Note that the highest quality QSAR models were derived by the FP method, with a significantly lower number of latent variables (H) than those obtained with PC&S descriptors (Table 3). Five variables were sufficient to attain high values of r and reasonable predictive ability expressed in terms of q2 for the DPPH and X/XO sets, whereas 9- and 7-dimensional space of orthogonal regressors were necessary for the PC&S models of these data sets, respectively. For the larger BM cell set, 8 variables were used in the FP method, as compared to 11 regressors for the PC&S descriptor approach. The number of latent variables in all the cases was chosen based on r and q2, and further increases of H did not lead to significant improvement of these coefficients.
Table 3.
Characteristics of the PC&S and FP QSAR models
| Test-system | QSAR model | H | K0 | s | r | q2 | Pinf |
|---|---|---|---|---|---|---|---|
| DPPH radical | PC&S | 9 | - | 0.332 | 0.889 | 0.760 | 0.999 |
| FP | 5 | 0.1 | 0.294 | 0.934 | 0.775 | 0.892 | |
| 0.2 | 0.212 | 0.966 | 0.907 | 0.955 | |||
| 0.3 | 0.211 | 0.967 | 0.888 | 0.982 | |||
| X/XO | PC&S | 7 | - | 0.289 | 0.789 | 0.522 | 0.999 |
| FP | 5 | 0.1 | 0.181 | 0.945 | 0.801 | 0.928 | |
| 0.2 | 0.185 | 0.942 | 0.791 | 0.968 | |||
| 0.3 | 0.176 | 0.948 | 0.821 | 0.988 | |||
| 0.4 | 0.234 | 0.906 | 0.303 | 0.994 | |||
| BM cells | PC&S | 11 | - | 0.656 | 0.781 | 0.587 | 0.999 |
| FP | 8 | 0.1 | 0.423 | 0.932 | 0.802 | 0.931 | |
| 0.2 | 0.305 | 0.965 | 0.897 | 0.959 | |||
| 0.3 | 0.438 | 0.927 | 0.792 | 0.979 |
K0 = threshold of the optimality criterion (Eq. 9); s = standard deviation of approximation by a QSAR model; Pinf = part of the information contained in initial variables (descriptors) and accounted for by H latent variables. Characteristics of the optimal QSAR models are indicated in bold.
To evaluate the PC&S and optimal FP models described in Table 3, we compared experimental with the calculated and cross-validated values for polyphenol antioxidant activity (Table 4), and corresponding plots of vs are shown in Fig. 2 for both models. For activity of polyphenols in all three test systems, much smaller deviations of and from were obtained in FP models, as compared to QSAR models that were based on conventional PC&S descriptors. Standard deviations of from the experimental values for antioxidant activities in the DPPH, X/XO and BM systems were 0.212, 0.176, and 0.305, respectively, and corresponding values for were of the same order of magnitude (0.221, 0.199, and 0.337, respectively). The PC&S approach with PLS regression achieved QSAR models of medium quality, with correlation coefficients ranging from 0.78 (BM set) to 0.89 (DPPH set). In contrast, this approach achieved a much higher r value for the DPPH set, which may be due to the defined chemical nature of this reaction. Hence, changes in flavonoid antioxidant activity in a radical scavenging assay system are described quite well by a QSAR model with PC&S descriptors. By comparison, the activities measured with the BM and X/XO systems appear to be determined by very specific interactions of the compounds with these biotargets. Thus, the activities for the X/XO and BM sets can be considered as biochemical and biological, respectively, resulting in QSAR models of lower quality with PC&S descriptors.
Table 4.
Experimental, calculated, and cross-validated activities of polyphenols in the DPPH, X/XO, and BM systems
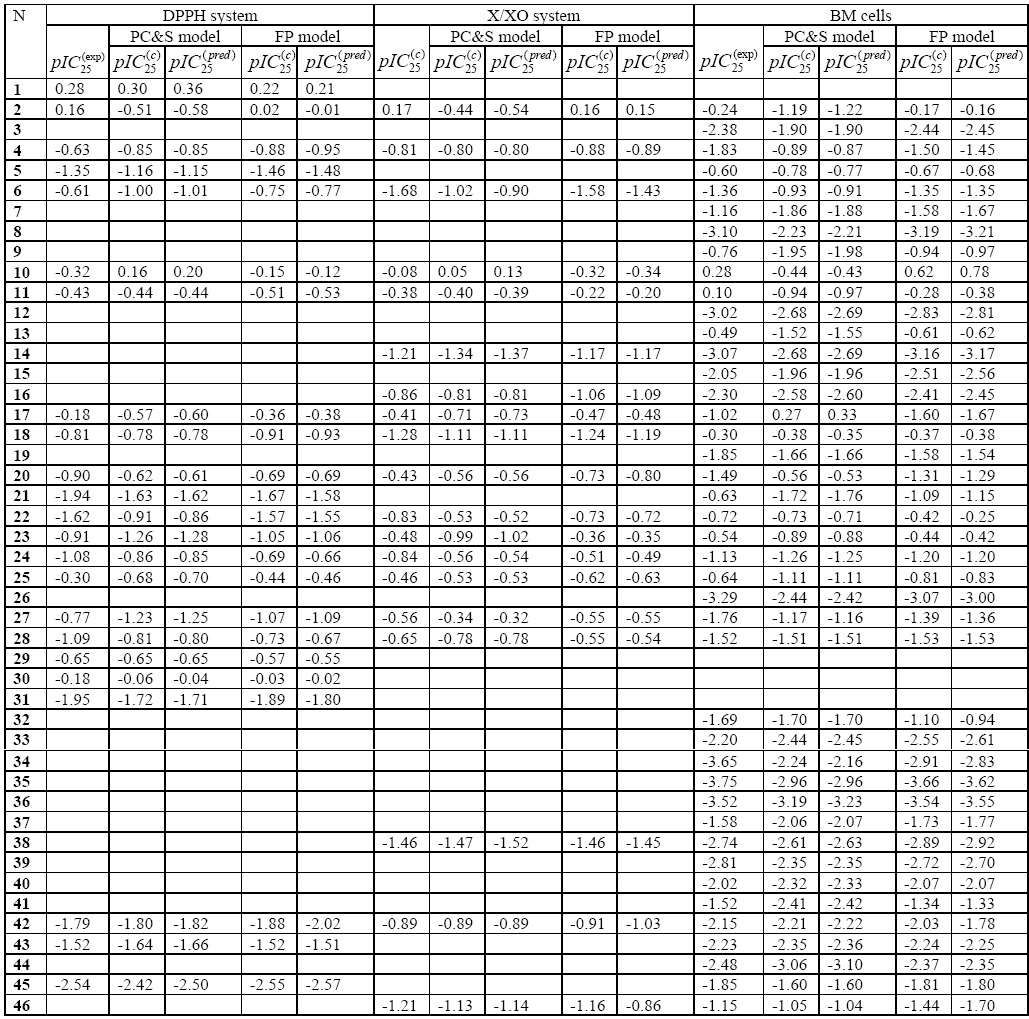 |
Figure 2.
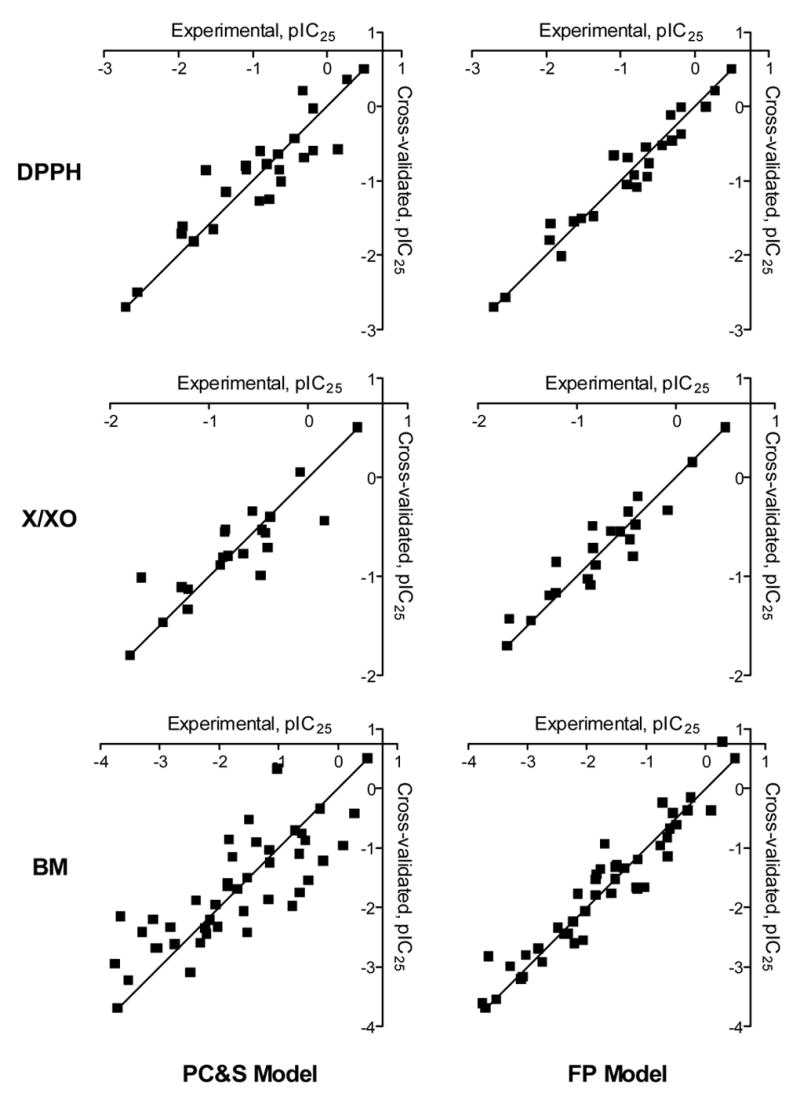
Comparison of calculated and experimentally-determined antioxidant activities for flavonoids and related polyphenols in the DPPH, X/XO, and BM phagocyte assay systems. QSAR analysis was performed using physicochemical and structural (PC&S) descriptors (left panels) and the FP method (right panels).
The FP method allows development of more extensive QSAR models based on local features of a chemical structure and also provides an assessment of the importance of different molecular fragments in the manifestation of biological activity. Thus, the FP method has the ability to account for local molecular substructures responsible for very specific processes of molecular recognition which contribute to activity in more complex enzymatic and biological systems. The modes of possible specific interactions are encoded in arrays of optimal superimpositions (OS). Interestingly, we obtained higher coefficients (r and q2) for the DPPH set using the FP method, as compared with the PC&S descriptor approach (Table 3). Although DPPH scavenging activity implies a lower specificity of interaction, it still can be sensitive to steric effects and planarity of the flavonoid molecule 55. Consequently, the higher level of structure description in the FP method can result in a higher quality QSAR model.
It is clear that one of the most important parameters for OS selection is the optimality criteria threshold, K0 (see Materials and Methods). It defines the specificity requirements for the superimposition to be treated as optimal. The influence of K0 on the quality of FP QSAR models is evident from Table 3. For the dataset from each assay system, r and q2 values first increased, reaching a maximal level, and then decreased with further increases in K0. This observation can be interpreted in terms of OS specificity. At K0=0.1, when only OS with very high specificity are included in the array, a lot of structural information useful for better QSAR models is lost, and the quality of linear models is not great. On the other hand, a more relaxed level of OS selection at higher K0 also decreases coefficients r and q2 because of informational “noise” (i.e., the OS array contains low-specificity superimpositions, which may not fully reflect all requirements for compound recognition). Thus, optimal QSAR models were constructed with K0=0.2 for activity in the DPPH radical and BM cell sets and with K0=0.3 for antioxidant activity determined in the X/XO system (Table 3, in bold). The q2 and r2 values were comparable, indicating the stability of the inclusion or deletion of cases.
Latent variables derived and used in the partial least squares (PLS) procedure were linear combinations of the initial descriptors. Hence, it is rather difficult to estimate the influence of each PC&S descriptor on activities of a compound directly from QSAR obtained on the basis of latent variables. We utilized an alternative approach for this estimation, which involved additional PLS-derived QSAR models constructed without one of the initial PC&S characteristics. From changes in the quality of these QSAR models, it was then possible to evaluate the importance of an excluded descriptor for a given type of activity of the polyphenol. The numbers of latent variables remained the same as those for the corresponding base models listed in Table 3 for each data set, and the correlation coefficients (r) for the models after exclusion of descriptors and for base models are shown in Fig. 3. Exclusion of the majority of PC&S characteristics did not lead to noticeable variations in r, and some r values were even slightly higher than for a base model. However, exclusion of some of PC&S descriptors resulted in significantly decreased r values, suggesting these descriptors were more important for the explanation of activity differences. Thus, the key descriptors are NBA, NBB, and Ehydr for DPPH scavenging properties, Ehydr and NBA for activity in the X/XO system, and EHOMO, ΔΔHf, and NC for end-point antioxidant activity of polyphenols in the BM cell system. Note that the ability to form a radical (EHOMO) correlates primarily with activity variations in the BM cell system. For relatively less complex systems, i.e., DPPH and X/XO, the exclusion of ΔΔHf and EHOMO from the set of initial variables did not lead to significant changes in r obtained by the PLS procedure, as compared to r from the corresponding base QSAR models (Fig. 3). For these systems, the neighborhood of the OH groups in rings A and B was more important than most other factors. The importance of Ehydr for the differences in activities of the compounds in the DPPH and X/XO systems can be explained by possible desolvation of molecules upon their interaction with corresponding targets in the chemical and enzymatic systems. In addition, Ehydr is closely associated with a number of OH groups in aglycone flavonoids 31 that, together with high importance of integer variables NBA and NBB for differentiation of their activities in the chemical and enzymatic systems, are in accordance with significance of total number of OH groups in flavonoid antioxidant activities 28,31.
Figure 3.
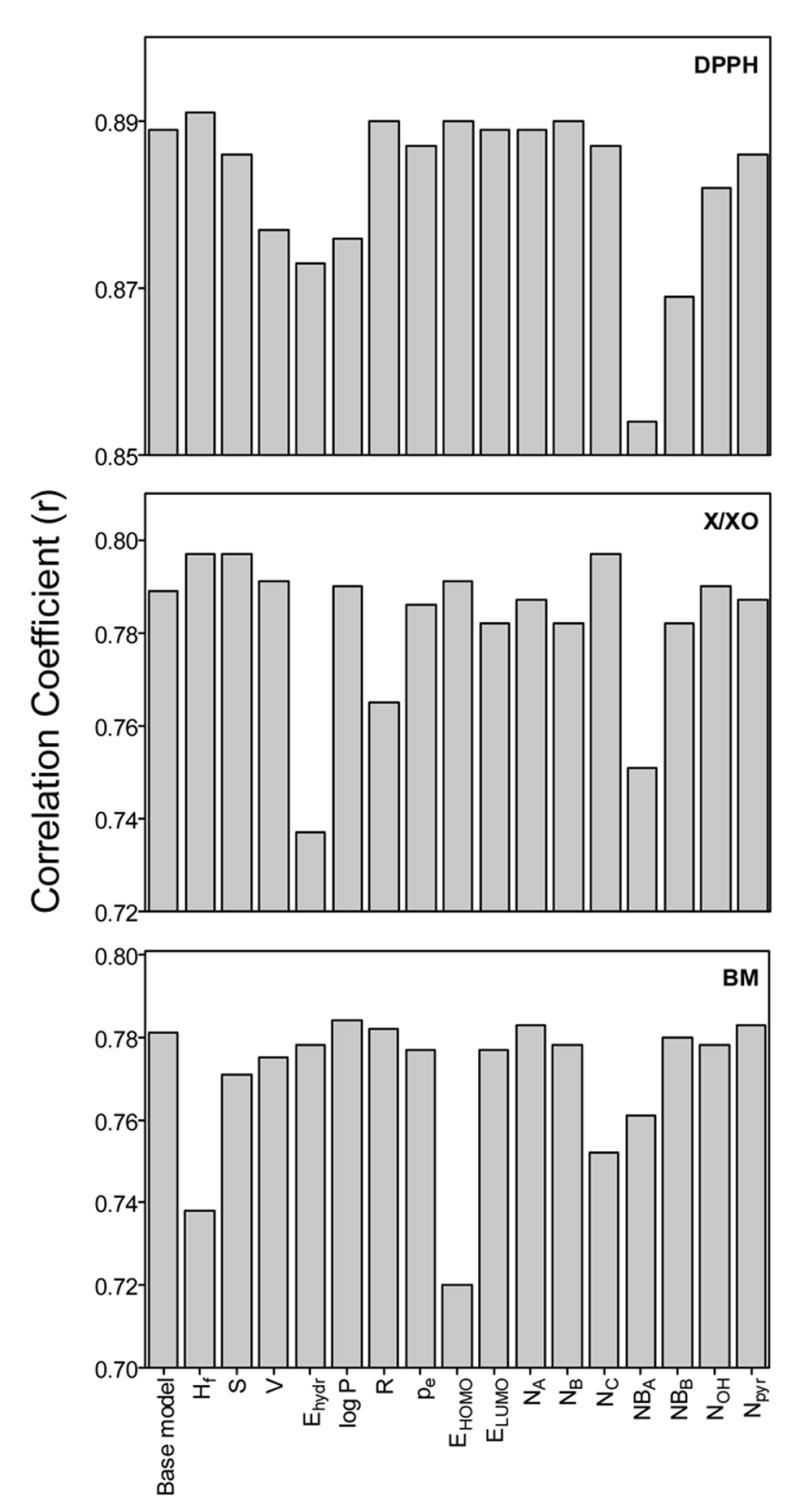
Correlation coefficient determined for the PLS-derived QSAR models after exclusion of individual PC&S descriptors. The indicated descriptor under each bar was excluded, and the resulting r values are shown.
In contrast to the PC&S descriptors, which characterize molecules as whole objects, the FP method is based on local representation of chemical structures. Analysis of prediction data for QSAR models obtained by the FP method (Table 3 and Fig. 2) shows that there are no distinct outliers among the compounds cross-validated within all data sets investigated. The greatest absolute differences |Δ| between predicted and experimental pIC25 values correspond to 24 (luteolin) (DPPH-set, Δ=0.424), 20 (fisetin) (XO-set, Δ=−0.372), and 34 (chrysin) (BM-set, Δ=0.820), although these values are only 1.92, 1.87 and 2.43 times higher than standard deviations between predicted and experimental data mentioned above. It is interesting to note that this lowered predictive ability of FP method occurs for these flavones that contain OH groups simultaneously in 5,7-positions and/or in 3′,4′-positions. This may be a consequence of specific interactions with radicals or enzymatic sites that are not accounted for by the FP method. Nevertheless, QSAR models based on local similarity principles are of much higher quality than models constructed by PLS-analysis of PC&S descriptors. It is noteworthy that the enhancement of q2 values [Δq2=q2(FP method)–q2(PC&S descriptors)] increases as the level of complexity increases in the three assay systems evaluated (Δq2=0.147, 0.229, and 0.310 for the DPPH, X/XO, and BM systems, respectively) (Table 3). Thus, the more detailed description of specific molecular features used in the FP method leads to improved QSAR models for the more complex enzymatic and cell-based systems.
2.3. Characteristics of submolecules and prospectives for de novo design of antioxidants
A key feature of the FP method is that the biological effect of a given compound can be represented by the sum of partial contributions (weights Wjl) due to the constituent rigid submolecules 56, as described by Eq. 1:
| [Equation 1] |
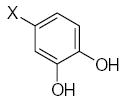
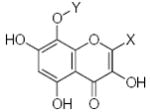
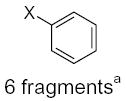
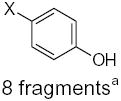
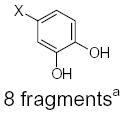
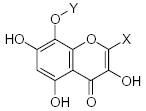
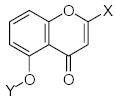
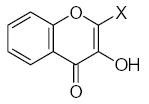
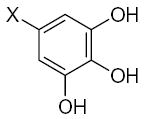
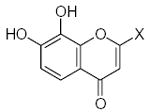
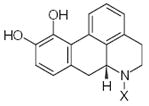
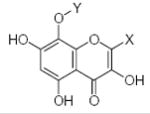
where L is the total number of rigid fragments in the jth molecule. Wjl reflects an increment of activity for the lth submolecule in a novel compound if this submolecule is surrounded by substituents similar in recognition parameters to the substituents surrounding a given submolecule in the parent compound and can be useful for the de novo design of active antioxidant substances 56. In other words, the fragment environment represents an important factor in this approach. Based on this paradigm, we considered the DPPH, X/XO, and BM cell sets of the flavonoids as a series of parent compounds and utilized refractions (R) and hydrophobicities (H) as recognition parameters. We then calculated Wjl for submolecules with the use of OS arrays obtained by construction of corresponding QSAR models, and selected values of Wjl for each type of molecular fragment are presented in Tables 5–7. The fragments in Tables 5–7 are generally listed in a descending order of Wjl. Note, however, that some chemical substructures had a range of different Wjl values, which were determined by their environment in a given molecule (i.e., R and H of substituents X, Y, and Z). Such a situation is consistent with the idea of optimal de novo design 57 where individual fragments are regarded not just as chemical substructures, but are considered in the context of environmental parameters (RX, HX). If these recognition parameters differ between chemically-equal substructures, the substructures are treated as different fragments with distinct Wjl. Likewise, de novo design can be performed through linking submolecules to one another to achieve a large sum of Wjl in a novel molecule 58. The latter should reflect an optimal environment for each fragment, which would be close to that in parent molecules. Consequently, this procedure suggests that not only fragments with large Wjl are useful for drug design, since some important submolecules possess low Wjl or are flexible (Wjl = 0) (e.g., X-CH=CH-Y) (see Table 5) and could form certain spatial arrangements that significantly influence the environment of other constituents of the molecule.
Table 5.
Characteristics of rigid submolecules of the polyphenols and their contributions to antioxidant activity in the DPPH assay system*
| Submolecule | RX | HX | Wjl | Submolecule | RX | HX | Wjl | Submolecule | RX | HX | Wjl |
|---|---|---|---|---|---|---|---|---|---|---|---|

|
27.90 | 1.55 | 0.70 |

|
27.90 | 1.55 | −0.07 | CH3-X | 71.40
113.5 78.64 |
2.42
2.03 2.64 |
−0.35
−0.35 −0.35 |

|
27.90 | 1.55 | 0.61 |
|
76.21
79.25 44.53 43.01 41.49 43.01 42.98 41.49 49.01 |
−4.20
−5.06 0.76 0.82 0.87 1.57 0.41 1.62 0.80 |
−0.08
−0.13 −0.34 −0.46 −0.49 −0.58 −0.66 −0.72 −0.77 |

|
24.86
26.38 29.42 27.90 |
1.66
1.60 1.50 1.55 |
−0.35
−0.41 −0.56 −0.53 |

|
24.86 | 1.66 | 0.48 |

|
43.01 | 1.58 | −0.51 | ||||

|
26.38 | 1.60 | 0.39 |

|
27.90 | 1.55 | −0.10 |

|
43.01 | 1.57 | −0.63 |

|
26.38 | 1.60 | 0.16 |

|
77.73
44.53 44.53 |
−4.25
1.51 0.76 |
−0.16
−0.85 −1.31 |

|
43.01
44.56 36.53 |
0.82
0.76 2.37 |
−0.88
−1.00 −1.35 |

|
27.90 | 1.55 | 0.09 |

|
39.97 | 1.68 | −0.28 |

|
44.53 | 0.76 | −1.05 |

|
26.38 | 1.60 | 0.07 |

|
74.13
27.90 |
2.03
1.55 |
−0.32
−0.86 |

|
35.01 | 2.42 | −1.16 |

|
27.90 | 1.55 | 26.38 | 1.60 | 0.00 |

|
27.90 | 1.55 | 33.57 | −6.03 | −0.50 |

|
38.18 | 1.95 | 5.51 | 0.61 | −0.01 |

|
24.86 | 1.66 | 33.57 | −6.03 | −0.55 |

|
27.90 | 1.55 | 5.51 | −0.07 | −0.20 |
|
27.90 | 1.55 | 33.57 | −6.03 | −0.62 |

|
85.95 | 0.21 | 5.51 | −0.07 | −0.29 |

|
24.86 | 1.66 | 33.57 | −6.03 | −0.55 |
| Submolecule | RX | HX | RY | HY | Rz | Hx | Wjl | ||||

|
45.97 | 1.30 | 5.51 | −0.07 | 5.51 | −0.07 | −0.50 | ||||

|
7.03 | −0.74 | 33.04 | 1.75 | 44.86 | −0.07 | −0.96 |
Submolecules with one (X), two (X and Y), and three (X, Y, and Z) substitutions are represented separately.
Table 7.
Characteristics of rigid submolecules of the polyphenols and their contributions to antioxidant activity in the BM phagocyte assay system*
| Submolecule | RX | HX | Wjl | Submolecule | RX | HX | Wjl | Submolecule | RX | HX | Wjl |
|---|---|---|---|---|---|---|---|---|---|---|---|

|
26.38 | 1.60 | 1.63 |
|
77.73
48.15 43.01 45.97 |
−4.25
1.77 1.57 1.30 |
−0.02
−1.29 −2.25 −2.29 |

|
31.52 | 1.80 | −0.80 |

|
24.86 | 1.66 | 0.83 |

|
26.38
24.86 27.90 31.52 |
1.60
1.66 1.55 1.80 |
−0.22
−0.50 −0.70 −1.40 |

|
26.38
33.04 |
1.60
1.75 |
−0.95
−1.13 |

|
24.86
26.38 27.90 29.42 |
1.66
1.60 1.56 1.50 |
0.77
0.64 −0.18 −0.23 |

|
27.90
31.52 26.38 |
1.55
1.80 1.60 |
−0.27
−0.28 −0.28 |

|
5.51 | −0.07 | −1.21 |

|
31.52 | 1.80 | 0.37 |

|
44.53 | 0.76 | −0.28 |
|
44.53
43.01 44.74 43.34 |
0.76
0.82 1.71 1.06 |
−1.31
−1.39 −1.84 −1.90 |

|
26.38
27.90 |
1.60
1.55 |
0.33
−0.90 |
CH3−X 6 fragmentsa | 67.50
65.32 70.87 102.2 |
3.49
2.35 2.88 −2.32 |
−0.41
−0.41 −0.42 −0.42 |

|
43.01
41.49 |
1.57
0.80 |
−1.64
−2.02 |

|
33.04 | 1.75 | 0.31 |

|
35.01 | 2.42 | −0.50 |

|
26.38 | 1.64 | −1.66 |
|
76.21
79.25 49.01 43.01 |
−4.20
−5.06 0.80 1.57 |
0.03
−0.08 −0.97 −1.00 |

|
43.01
40.30 |
1.57
1.17 |
−0.54
−1.10 |

|
27.90
74.13 |
1.50
2.03 |
−1.75
−2.09 |

|
41.70 | 1.82 | −0.76 |

|
74.13 | 2.03 | −2.09 | ||||
| Submolecule | RX | HX | RY | HY | Wjl | Submolecule | RX | HX | RY | HY | Wjl |

|
24.86 | 1.66 | 5.51 | −0.07 | 1.56 |

|
85.95
39.97 |
0.21
1.68 |
5.51
5.51 |
−0.07
−0.07 |
−0.49
−1.24 |

|
27.90 | 1.55 | 5.51 | −0.07 | 0.26 |

|
24.86
27.90 31.52 |
1.66
1.55 1.80 |
5.51
33.57 33.57 |
−0.07
−6.03 −6.03 |
−0.58
−1.85 −2.34 |

|
27.90 | 1.55 | 26.38 | 1.60 | 0.00 |

|
43.34 | 1.06 | 5.51 | −0.07 | −1.02 |

|
76.21
43.01 43.01 41.49 |
−4.20
1.57 1.07 1.13 |
5.51
5.51 5.51 5.51 |
−0.07
−0.07 −0.07 −0.07 |
−0.10
−1.02 −1.02 −1.05 |

|
41.49 | 0.87 | 5.51 | −0.07 | −1.08 |

|
24.86 | 1.66 | 5.51 | 0.61 | −0.19 |
|
27.90 | 1.55 | 33.57 | −6.03 | −1.25 |

|
24.86 | 1.66 | 33.57 | −6.03 | −0.41 |
|
26.38 | 1.60 | 5.51 | −0.07 | −1.50 |
| Submolecule | RX | HX | RY | HY | RZ | HZ | Wjl | ||||

|
33.04 | 1.75 | 7.03 | −0.74 | 44.86 | −0.07 | 0.16 |
Submolecules with one (X), two (X and Y), and three (X, Y, and Z) substitutions are represented separately.
Selected fragments of each type with minimal and maximal Wjl values are presented.
As it shown in Tables 5–7, submolecules containing a benzo-γ-pyrone fragment (rings A and C of the flavonoid moiety) had the highest correlation with DPPH-scavenging properties and antioxidant activity in the BM cell system, while multiply-substituted phenyl fragments (ring B) were among the most important features correlating with antioxidant action in the X/XO system. For example, 7,8-dihydroxy substituted benzo-γ-pyrone had the highest activity in BM cells and was the fourth highest for DPPH scavenging activity. In comparison, this fragment was much less important in the X/XO system, being tenth in the descending order of Wjl (Table 6). Similarly, 5,6,7-trihydroxy substituted benzo-γ-pyrone was third in importance for DPPH scavenging and antioxidant activity in BM cells (Tables 5 and 7), while it was thirteenth in the X/XO enzymatic system (Table 6). Conversely, the m,p-dihydroxyphenyl submolecule was second in importance for antioxidant activity in the X/XO system, but only eleventh and twelfth in the BM cell and DPPH systems, respectively. Thus, these data suggest the possibility that ring B of the flavonoid moiety significantly determines interaction of a compound with XO, thereby influencing the end-point antioxidant activity in the X/XO system 59,60.
Table 6.
Characteristics of rigid submolecules of the polyphenols and their contributions to antioxidant activity in the X/XO assay system*
| Submolecule | RX | HX | Wjl | Submolecule | RX | HX | Wjl | Submolecule | RX | HX | Wjl |
|---|---|---|---|---|---|---|---|---|---|---|---|
|
27.90 | 1.55 | 0.22 |

|
43.34
43.01 |
1.06
0.82 |
−0.17
−0.82 |

|
27.90
31.52 |
1.55
1.80 |
−0.48
−0.539 |

|
41.49
44.53 43.01 76.21 79.25 43.01 49.01 |
0.87
0.76 0.82 −4.20 −5.06 1.57 0.80 |
0.11
0.00 −0.08 −0.15 −0.16 −0.16 −0.19 |
|
44.53 | 0.76 | −0.18 |

|
27.90
29.42 |
1.55
1.50 |
−0.53
−0.55 |

|
43.01 | 1.57 | 0.07 |

|
44.53
77.73 |
1.51
−4.25 |
−0.19
−0.30 |

|
27.90
26.38 |
1.55
1.60 |
−0.58
−0.78 |
| CH3−X | 71.40
69.02 113.5 69.03 |
2.42
3.44 2.03 2.57 |
−0.07
−0.07 −0.07 −0.07 |
|
26.38 | 1.60 | −0.20 |

|
74.13 | 2.03 | −0.74 |

|
76.21 | −4.20 | −0.15 |

|
24.86 | 1.66 | −0.46 |

|
26.38 | 1.60 | −0.87 |
|
5.51 | −0.07 | −1.19 | ||||||||
| Submolecule | RX | HX | RY | HY | Wjl | Submolecule | RX | HX | RY | HY | Wjl |

|
85.95 | 0.21 | 5.51 | −0.07 | 0.09 |

|
27.90 | 1.55 | 33.57 | −6.03 | −0.59 |

|
27.90 | 1.55 | 5.51 | −0.07 | −0.42 |
|
27.90 | 1.55 | 33.57 | −6.03 | −0.62 |

|
43.01 | 1.57 | 5.51 | −0.07 | −0.44 |

|
24.86 | 1.66 | 33.57 | −6.03 | −0.74 |
| Submolecule | RX | HX | RY | HY | RZ | HZ | Wjl | ||||

|
33.04 | 1.75 | 7.03 | −0.74 | 44.86 | −0.07 | −0.03 |
Submolecules with one (X), two (X and Y), and three (X, Y, and Z) substitutions are represented separately.
In all three data sets, the m,p-dihydroxyphenyl chemical substructure (substituted ring B) occured in many different environments, thus providing many individual building fragments (Tables 5–7). Such a variety of data allowed us to derive statistically-relevant linear regressions for m,p-dihydroxyphenyl submolecules [Eq. 2–4 for the DPPH (r=0.853; s=0.14; n=9), X/XO (r=0.889; s=0.06; n=7), and BM (r=0.911; s=0.19; n=8) sets, respectively]:
| [Equation 2] |
| [Equation 3] |
| [Equation 4] |
Using these formulae, it is possible to evaluate the increment in Wjl for this submolecule when varying the benzo-γ-pyrone moiety X for the construction of new antioxidant compounds. From the absolute values of the regression coefficients in Eq. 2–4, it is evident that the sensitivity of Wjl to changes in substituent characteristics RX and HX increases as the assay system increases in complexity from chemical to enzymatic to whole cells. In contrast, the correlation between Wjl and the characteristics of substituents X is very weak (r=0.260) for the p-hydroxyphenyl substructure, which had 8 different fragments within the BM-set (Table 7), perhaps, due to less specific interactions of this substructure with biotargets, as compared to the m,p-dihydroxyphenyl moiety. The occurrence of multiple fragments of other chemical entities in Tables 5–7 was not very high, so construction of regressions similar to Eq. 2–4 was not possible. Nevertheless, all of the submolecules listed in these tables, as well as flexible fragments, can be exploited in a systematic manner to perform de novo design 57 for development of novel flavonoid compounds in the future.
3. Conclusions
In the present study, end-point antioxidant activities of 46 flavonoids and related polyphenols were determined in systems of different complexity and organization, including a chemical system (DPPH radical system), a biochemical/enzymatic system (X/XO system), and an ex vivo cellular system (BM phagocyte system). QSAR modeling was performed on compounds with relative antioxidant activity in each of the three systems utilizing two alternative approaches using (i) conventional PC&S descriptors and (ii) the FP approach. As summarized in Table 8, the models obtained in this study were highly predictive, especially the indirect integrated FP-based QSAR model, as indicated r and cross-validated q2 values. Note that q2 coefficients were not reported in most previous studies on flavonoids. Furthermore, this is the first reported QSAR model for end-point antioxidant activity in a cell-based system. Although QSAR model based on PC&S descriptors had similar or better r values than most previously published relationships for end-point antioxidant activity in chemical 28,29 and biochemical/enzymatic 31,47, our data show QSAR models of even higher quality were derived by the indirect FP method with a significantly lower number latent variables (H) as compared to the models obtained with PC&S descriptors. These FP-derived models were achieved by more complex and elaborate computations involving partitioning of molecules into fragments and searching for optimal superimpositions of “fingerprints”. With this submolecule-based approach it was possible to identify structural molecular fragments responsible for differences in activity in the assay systems tested. Thus, the FP QSAR models reported here are among the best available in relation to predictive ability and will significantly advance our efforts in de novo design of new flavonoid analogs with potent antioxidant activity in biological systems.
Table 8.
Comparison of QSAR models developed for antioxidant activity of flavonoids and related polyphenols in chemical, enzymatic, and cellular systems.
| Test system | Molecule parameter and model | r | q2 | n | References |
|---|---|---|---|---|---|
| Chemical | Number of OH groups and indicator variables representing position of OH groups | 0.890 | N.D. | 42 | 28 |
| Number of OH groups and indicator variables representing position of OH groups | 0.938 | N.D. | 29 | 29 | |
| 13 PLS components based on topological descriptors | 0.994 | N.D. | 36 | 30 | |
| EHYDR | 0.747 | N.D. | 12 | 31 | |
| EHYDR and LUMO | 0.759 | N.D. | 12 | 31 | |
| Topological descriptors and 5 PC&S descriptors | 0.938 | 0.846 | 27 | 32 | |
| Ep/2 | 0.734 | N.D. | 19 | 47 | |
| 9 PLS components based on PC&S descriptors | 0.889 | 0.760 | 23 | Our model | |
| FP model | 0.966 | 0.907 | 23 | Our model | |
| Enzymatic | Ep/2 | 0.762 | N.D. | 19 | 47 |
| 7 PLS components based on PC&S descriptors | 0.789 | 0.522 | 19 | Our model | |
| FP model | 0.948 | 0.821 | 19 | Our model | |
| Cellular | 11 PLS components based on PC&S descriptors | 0.781 | 0.587 | 42 | Our model |
| FP model | 0.965 | 0.897 | 42 | Our model |
r, correlation coefficient; q2, cross-validation coefficient; n, number of compounds in the set; Ep/2, half peak oxidation potential; EHYDR, hydration energy.
4. Materials and methods
4.1. Test compounds and chemicals
Most flavonoids and related polyphenols (42 of 46 compounds) were obtained from TimTec, Inc. (Newark, DE). The general set of compounds included well-known flavonoids and polyphenols (compound number shown in bold, see Tables 1 and 2), such as gossypin (4), kaempferol (5), apigenin (15), baicalein (17), baicalin (18), diosmin (19), fisetin (20), galangin (21), gardenin (22), quercetin (23), luteolin (24), rutin (27), chrysin (34), sissotrin (40), biochanin A (41), catechin (43), phloretin (44), resveratrol (45), and apomorphine (46). Four additional flavonoids [(acacetin (14), rhoifolin (16), 2’-hydroxyflavone (35), and 4’-hydroxyflavone (36)] were purchased from Sigma Chemical Co. (St. Louis, MO, USA). Sixteen compounds (7, 8, 12–14, 19, 26, 27, 31–33, 37, 39, and 40–42) were methylated derivatives, and eight compounds (4, 16, 18, 19, 25, 26, 28, and 37) contained sugar moieties. Commercial reagents and solvents were used as obtained without further purification. 8-Amino-5-chloro-7-phenylpyridol[3,4-d]pyridazine-1,4(2H,3H)-dione (L-012) was purchased from Wako Chemicals (Richmond, VA, USA). Bovine superoxide dismutase (SOD), xanthine, xanthine oxidase, horseradish peroxidase, nitroblue tetrazolium (NBT), and 1,1-diphenyl-2-picrylhydrazyl (DPPH) were purchased from Sigma Chemical Co.
4.2. Measurement of DPPH radical scavenging activity
Radical scavenging activity was evaluated using a modification of the DPPH assay described by Munoz-Espada et al. 61. Thirty μL of each compound were added to wells of a 96-well microtiter plate containing 220 μL of 100 μM DPPH dissolved in ethanol. The plate was covered with aluminum foil, incubated at room temperature for 20 min, and sample absorption was measured at 517 nm using a SpectraMax Plus microtiter plate reader (Molecular Devices, Sunnyvale, CA) versus ethanol as a blank. The percent antiradical activity (ARA%) against DPPH radical was calculated using with the following equation:
| [Equation 5] |
Antiradical activity was plotted against the compound concentration, and a logarithmic regression curve was established in order to calculate the IC25, which is the amount of sample necessary to decrease the absorbance of DPPH radical by 25%. Each line was determined using 5–6 tested concentrations. Compound was assigned as “non-active” (N.A.) if no effect on absorbance of DPPH radical was seen at the highest concentration tested (400 μM).
4.3. Xanthine/xanthine oxidase (X/XO) system
O2−· was generated in an enzymatic system consisting of 500 μM xanthine, 500 μM NBT, 3.75 mU/mL XO, and 0.1 M phosphate buffer (pH 7.5), and O2−· production was determined by monitoring reduction of NBT to monoformazan dye at 560 nm in the presence or absence of test compounds. The reactions were monitored at 560 nm with a SpectraMax Plus microtiter plate spectrophotometer at 25°C, and the rate of absorption change was determined. To minimize potential effects caused by direct inhibition of XO by the tested compounds, the value of the concentration required to produce 25% inhibition (IC25) was used 62. The IC25 was obtained by graphing the rate of NBT reduction versus the logarithm of the concentration of tested compound. Each line was determined using 5–7 tested concentrations. A compound was assigned as “non-active” (N.A.) if no effect on inhibition of NBT reduction was seen at the highest concentration tested (50 μM). This concentration was used because some compounds are poorly soluble at concentrations above 50 μM.
4.4. Murine bone marrow phagocyte isolation
Most comparative studies on phagocyte isolation techniques have shown either activation or functional impairment of the cells due to different separation processes 63. Thus, murine whole bone marrow (BM) cells were used in these studies as an ex vivo model of cellular ROS production. This procedure minimizes any phagocyte activation during isolation and, thus, their function more accurately reflects the physical condition of these cells in vivo. ROS-generation in BM preparations is primarily due to neutrophils, as lymphocytes present do not release detectable ROS 64. BM cells were flushed from tibias and femurs of BALB/c mice with Hank’s balanced salt solution (HBSS) without phenol red (pH 7.4) using a syringe with 27-gauge needle. Cells were resuspended by gentle pipetting, filtered through 70 μm nylon cell strainers (Becton Dickinson), and diluted as needed to final suspensions of 1 × 10⁶ cells/mL.
4.5. Ex vivo phagocyte ROS production
We evaluated phagocyte basal ROS production without any additional stimulation, as flavonoid effects on functional activity of agonist-stimulated phagocytes have been shown to be highly dependent on the type of agonist used 9,15,19,43,44, making it difficult to interpret their mode of action. ROS production was determined by monitoring L-012-enhanced luminescence, which represents a sensitive and reliable method for detecting O2−· production in in vitro and ex vivo systems 65. L-102 and horseradish peroxidase were added to BM suspensions at final concentrations of 40 μM and 8 μg/ml, accordingly, and 100 μL of this mixture was added to the wells of white 96-well flat-bottom microtiter plates containing 100 μL of HBSS with various concentrations of test compounds (from DMSO stock) or DMSO (solvent control). The final concentration of DMSO was 1% in the test and control samples. Luminescence was monitored for 60 min (2 min intervals) at 37°C using a Fluroscan Ascent FL microtiter plate reader and kinetics software (Thremo Electron, Waltham, MA). The curve of light intensity (in relative luminescent units) was plotted against time, and the area under the curve was calculated as total luminescence. The percent inhibition of luminescence was calculated as:
| [Equation 6] |
IC25 was obtained by graphing the % inhibition of luminescence versus the logarithm of concentration of tested compound. Each line was determined using 5–7 tested concentrations. L-012-enhanced luminescence due to phagocyte basal ROS production was completely inhibited by 1 U/mL SOD (data not shown).
4.6. Conformational analysis and semiempirical calculations
The geometric structures of molecules, atomic charges (qX), and energies of O-H bond dissociation were calculated by a semiempirical PM3 method, as implemented in the HyperChemTM program package (Version 7). Semiempirical calculations of radicals obtained upon homolytic dissociation of O–H bonds were performed using the unrestricted Hartree-Fock (UHF) approximation. Full optimization of geometry was made by the conjugate gradient procedure until the rms gradient became less than 0.01 kcal·mol−1Å−1. Atomic coordinates and charges obtained for molecules were used in similarity comparisons with the FP method. Other molecular features necessary for this analysis were hydrophobicities (HX) and molar refractions (RX) of the corresponding substituents at atoms X. Hydrophobicities and refractions of substituents and fragments were calculated by an additive scheme 66 that includes various increments for different atom types and is well suited for compounds 1–46.
4.7. Generation and orthogonalization of descriptors
Based on published data for the construction of SAR and QSAR models with different series of flavonoids and related polyphenols 18,28,31,45,47–50, we selected the following set of physicochemical and structural (PC&S) descriptors for QSAR analysis of compounds 1–46 (compounds shown in Tables 1 and 2): minimal energy of O-H bond homolytic dissociation estimated as the difference in enthalpies of formation (ΔΔHf) between a corresponding radical and an initial polyphenol; surface area (S); molecular volume (V); hydration energy (Ehydr); logarithm of octanol-water partition coefficient (logP); refractivity (R); polarizability (pe); energies of the highest occupied and lowest unoccupied molecular orbitals (EHOMO and ELUMO, respectively); and integer variables: number of OH groups in rings A, B, C (NA, NB, NC), maximal number of neighboring OH groups in rings A and B (NBA, NBB, respectively), total number of OH groups in a molecule, including pyranose rings (NOH), and number of carbohydrate pyranose rings (Npyr). These values were obtained with the use of HyperChemTM for the geometries optimized by the PM3 method (described above) or taken directly from structural formulae (NA, NB, NC, NBA, NBB, NOH, Npyr). As an example, the integer variables for compound 4 were 2, 2, 1, 1, 2, 9, 1 for NA, NB, NC, NBA, NBB, NOH, and Npyr, respectively. For compounds 44–46, the A-C-B ring structure was not assigned, and these integer variables, except NOH, were set equal to zero. In compound 42, the fused benzene ring belonging to the terminal bicyclic moiety was considered as ring A, the neighboring oxygen-containing cycle was regarded as ring C, while the fused benzene cycle in the central bicyclic moiety was considered as ring B for calculation of integer descriptors NA, NB, NC, NBA, and NBB.
Since the number of PC&S descriptors was quite large for the data sets investigated here, standard multivariate regression analysis was not possible. In order to reduce dimensionality, we applied the partial least squares (PLS) procedure 67, which converts descriptor space into a subspace of orthogonal latent variables linearly dependent on the initial PC&S descriptors. The number of latent variables (H) is smaller than the initial dimensionality, which is statistically acceptable. H values were chosen as small as possible, but still providing for negligible increases in conventional (r) and cross-validated (q2) correlation coefficients with further increases of H. The PLS regression technique is especially useful in common cases where the number of descriptors (independent variables) is comparable to or greater than the number of compounds (data points) and/or there exist other factors leading to correlations between variables. On the other hand, PLS approach leads to stable, correct and highly predictive models even for correlated descriptors 68. The PLS procedure was used as implemented in the data analysis software system STATISTICA 6.0 (StatSoft, Inc., Tulsa, OK).
4.8. FP method
The FP method considers the three-dimensional (3D) similarity of molecules, making it possible to process a series of conformationally-flexible and structurally-diverse compounds 51,56. Molecules were subdivided into rigid and flexible fragments (submolecules), as described previously 56. Flavonoid bicyclic moieties, phenyl and methyl groups, as well as olefinic substructures were treated as rigid fragments. All other submolecules that were too small for local similarity analysis or containing internal rotational degrees of freedom, including carbohydrate residues, were treated as flexible. Local similarity was investigated between peripheral areas (fingerprints) of rigid fragments only. Flexible fragments did not serve as sources of fingerprints, and their properties were accounted for through substituent characteristics HX and RX (vide infra). An example of subdividing compounds 32 and 42 into rigid and flexible submolecules is shown in Fig. 4.
Figure 4.
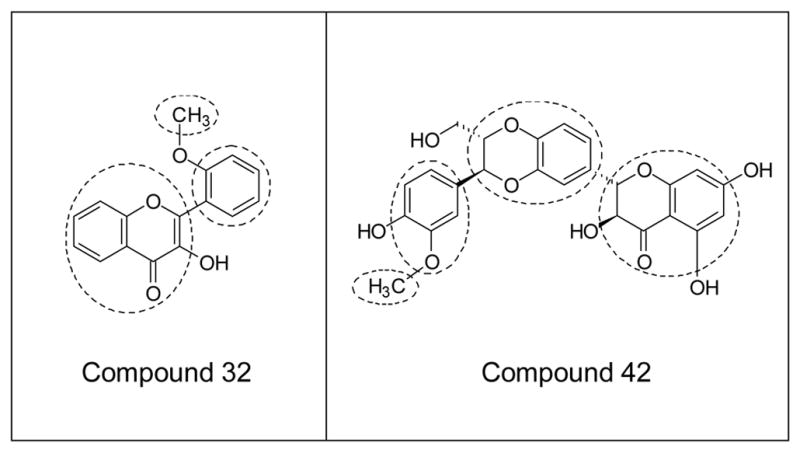
Illustration of molecule subdivision into fragments for QSAR analysis. Subdivision of compounds 32 and 42 into rigid (enclosed by dashed lines) and flexible fragments is shown.
Template molecules for structure comparison were chosen for each set from the most active and the least active compounds as follows: DPPH set [high activity (compounds 1, 2, 17, 25, 30) and low activity (compounds 21, 22, 31, 45)]; X/XO set [high activity (compounds 2, 10, 11, 17, 20) and low activity (compounds 6, 14, 18, 38)]; and BM cell set [high activity (compounds 2, 10, 11, 13, 18) and low activity (compounds 26, 34, 35)]. These compounds were used for obtaining template fingerprints. Fingerprints were obtained from rigid fragments using the previously described parameters 51,56 and included the projections of atoms characterized by their distances (hX) to the parent atom X with the atomic charge (qX). Projections of the boundary atoms (adjacent to other fragments) were additionally characterized by hydrophobicities (HX) and molar refractions (RX) of the corresponding substituents at atom X.
The fingerprints of the compounds investigated were subjected to a pair-wise comparison with template fingerprints to establish the degree of local similarity of molecules in optimal superimpositions (OS), using the following optimality criterion 51,69:
| [Equation 7] |
where n0 is the number of assignments in a given OS; α=1.5 is the parameter reflecting the specificity of the superimposition (increasing with n0); P is the atom from a template molecule fingerprint and X is the atom from a given molecule fingerprint assigned to each other in a given superimposition; rXP is the distance (in Å) between assigned projections in a given superimposition; HX, HP and RX, RP are hydrophobicities and molar refractions, respectively, of substituents bound atoms X and P (if no submolecules are bound to an atom, these values are equal to 0); and wr, wh, wq, wH, and wR are the weight coefficients. Weight coefficient values were adopted to be reciprocal to dispersions of the molecular recognition criteria rXY, hX, qX, HX, RX among all compounds under consideration. Taking into account that five criteria were used, each weight was calculated as follows:
| [Equation 8] |
where D is the dispersion of the corresponding criterion. Summation in Eq. 7 was performed over the pairs of projections (for atoms X, P) related by assignments. Superimpositions satisfying the conditions:
| [Equation 9] |
(where K0 and N0 are parameters) were considered as optimal.
Projection of an atom from the superimposed fingerprint was regarded as assigned to a projection from the template fingerprint if the distance between these projections was ≤ 0.45 Å 51,56. Optimality of a superimposition was attained by mutual translations and rotations of fingerprints with the use of the efficient algorithm 69. See our recent report for an example of a superimposition and details on the general scheme of the FP method 54. For further details on the FP method and software features, refer to previous publications 51,56,65.
QSAR models were constructed using the arrays of OS obtained with N0 = 4 (the value recommended in previous publications using the FP method 52,56) and for various K0 (i.e., for different requirements on the degree of structural similarity between molecules) to attain the best predictive ability with high correlation coefficient (r).
Finally, particular QSAR were established in the form of linear equations based on the arrays of OS:
| [Equation 10] |
where is the calculated activity and are the regression coefficients. Using the αh information contained in OS array, the reduced basis of variables (Zh) was determined by the PLS procedure 67, as described previously 56. The dimensionality (H) of the basis was selected as small as possible but still providing for sufficiently high values of the correlation coefficient (r) and the cross-validation coefficient (q2). The latter characterizes the quality of the activity prediction in a leave-one-out procedure:
| [Equation 11] |
where Scv2 is the mean-square uncertainty of the cross-validation prognosis and Sser2 is the mean-square deviation of activity in the series of compounds studied.
Supplementary Material
Acknowledgments
This work was supported in part by Department of Defense grant W9113M-04-1-0001, National Institutes of Health grant RR020185, and the Montana State University Agricultural Experimental Station. The U.S. Army Space and Missile Defense Command, 64 Thomas Drive, Frederick, MD 21702 is the awarding and administering acquisition office. The content of this report does not necessarily reflect the position or policy of the U.S. Government.
Abbreviations
- QSAR
quantitative structure-activity relationship
- SAR
structure-activity relationship
- ROS
reactive oxygen species
- PC&S descriptors
physicochemical and structural descriptors
- FP method
frontal polygon method
- PLS
partial least squares
- OS
optimal superimpositions
- DPPH
1,1-diphenyl-2-picrylhydrazyl
- X/XO
xanthine/xanthine oxidase
- BM
bone marrow
- NBT
nitro blue tetrazolium
- HBSS
Hanks’ balanced-salt solution
- DMSO
dimethyl sulfoxide
- SOD
superoxide dismutase
Footnotes
Dr. Mark T. Quinn, Veterinary Molecular Biology, Montana State University, Bozeman, MT 59717, Phone: 406-994-5721; Fax 406-994-4303 mquinn@montana.edu
Supplementary data: Supplementary data associated with this report consists of physicochemical descriptors calculated for compounds 1–46 and can be found in the online version.
Publisher's Disclaimer: This is a PDF file of an unedited manuscript that has been accepted for publication. As a service to our customers we are providing this early version of the manuscript. The manuscript will undergo copyediting, typesetting, and review of the resulting proof before it is published in its final citable form. Please note that during the production process errors may be discovered which could affect the content, and all legal disclaimers that apply to the journal pertain.
Reference List
- 1.Rice-Evans C. Curr Med Chem. 2001;8:797. doi: 10.2174/0929867013373011. [DOI] [PubMed] [Google Scholar]
- 2.Ross JA, Kasum CM. Annu Rev Nutr. 2002;22:19. doi: 10.1146/annurev.nutr.22.111401.144957. [DOI] [PubMed] [Google Scholar]
- 3.Williams RJ, Spencer JP, Rice-Evans C. Free Radic Biol Med. 2004;36:838. doi: 10.1016/j.freeradbiomed.2004.01.001. [DOI] [PubMed] [Google Scholar]
- 4.Heim KE, Tagliaferro AR, Bobilya DJ. J Nutr Biochem. 2002;13:572. doi: 10.1016/s0955-2863(02)00208-5. [DOI] [PubMed] [Google Scholar]
- 5.Wolin MS, Ahmad M, Gupte SA. Kidney Int. 2005;67:1659. doi: 10.1111/j.1523-1755.2005.00257.x. [DOI] [PubMed] [Google Scholar]
- 6.Balaban RS, Nemoto S, Finkel T. Cell. 2005;120:483. doi: 10.1016/j.cell.2005.02.001. [DOI] [PubMed] [Google Scholar]
- 7.Tauber AI, Fay JR, Marletta MA. Biochem Pharmacol. 1984;33:1367. doi: 10.1016/0006-2952(84)90194-1. [DOI] [PubMed] [Google Scholar]
- 8.Cos P, Ying L, Calomme M, Hu JP, Cimanga K, Van PB, Pieters L, Vlietinck AJ, Vanden BD. J Nat Prod. 1998;61:71. doi: 10.1021/np970237h. [DOI] [PubMed] [Google Scholar]
- 9.Selloum L, Reichl S, Muller M, Sebihi L, Arnhold J. Arch Biochem Biophys. 49;2001:395. doi: 10.1006/abbi.2001.2562. [DOI] [PubMed] [Google Scholar]
- 10.Beckmann-Knopp S, Rietbrock S, Weyhenmeyer R, Bocker RH, Beckurts KT, Lang W, Hunz M, Fuhr U. Pharmacol Toxicol. 2000;86:250. doi: 10.1111/j.0901-9928.2000.860602.x. [DOI] [PubMed] [Google Scholar]
- 11.Møller P, Loft S. Free Radic Biol Med. 2006;41:388. doi: 10.1016/j.freeradbiomed.2006.04.001. [DOI] [PubMed] [Google Scholar]
- 12.Middleton E, Jr, Kandaswami C, Theoharides TC. Pharmacol Rev. 2000;52:673. [PubMed] [Google Scholar]
- 13.Hallett MB. Clin Exp Immunol. 2003;132:181. doi: 10.1046/j.1365-2249.2003.02158.x. [DOI] [PMC free article] [PubMed] [Google Scholar]
- 14.Hensley K, Robinson KA, Gabbita SP, Salsman S, Floyd RA. Free Radic Biol Med. 2000;28:1456. doi: 10.1016/s0891-5849(00)00252-5. [DOI] [PubMed] [Google Scholar]
- 15.Limasset B, Le Doucen C, Dore JC, Ojasoo T, Damon M, De Paulet AC. Biochem Pharmacol. 1993;46:1257. doi: 10.1016/0006-2952(93)90476-d. [DOI] [PubMed] [Google Scholar]
- 16.Chang HW, Baek SH, Chung KW, Son KH, Kim HP, Kang SS. Biochem Biophys Res Commun. 1994;205:843. doi: 10.1006/bbrc.1994.2741. [DOI] [PubMed] [Google Scholar]
- 17.Takemura OS, Banno Y, Nozawa Y. Biochem Pharmacol. 1997;53:1503. doi: 10.1016/s0006-2952(97)00067-1. [DOI] [PubMed] [Google Scholar]
- 18.Oblak M, Randic M, Solmajer T. J Chem Inf Comput Sci. 2000;40:994. doi: 10.1021/ci000001a. [DOI] [PubMed] [Google Scholar]
- 19.Lu HW, Sugahara K, Sagara Y, Masuoka N, Asaka Y, Manabe M, Kodama H. Arch Biochem Biophys. 2001;393:73. doi: 10.1006/abbi.2001.2457. [DOI] [PubMed] [Google Scholar]
- 20.Liu G, Wang WF, Masuoka N, Isobe T, Yamashita K, Manabe M, Kodama H. Planta Medica. 2005;71:933. doi: 10.1055/s-2005-871283. [DOI] [PubMed] [Google Scholar]
- 21.Poolman TM, Ng LL, Farmer PB, Manson MM. Free Radic Biol Med. 2005;39:118. doi: 10.1016/j.freeradbiomed.2005.02.036. [DOI] [PubMed] [Google Scholar]
- 22.Pignatelli P, Di SS, Buchetti B, Sanguigni V, Brunelli A, Violi F. FASEB J. 2006;20:1082. doi: 10.1096/fj.05-5269com. [DOI] [PubMed] [Google Scholar]
- 23.Voskresensky ON, Levitsky AP. Curr Med Chem. 2002;9:1367. doi: 10.2174/0929867023369790. [DOI] [PubMed] [Google Scholar]
- 24.Rice-evans CA, Miller NJ, Paganga G. Free Radic Biol Med. 1996;20:933. doi: 10.1016/0891-5849(95)02227-9. [DOI] [PubMed] [Google Scholar]
- 25.Bors W, Michel C, Stettmaier K. Methods Enzymol. 2001;335:166. doi: 10.1016/s0076-6879(01)35241-2. [DOI] [PubMed] [Google Scholar]
- 26.Choi JS, Chung HY, Kang SS, Jung MJ, Kim JW, No JK, Jung HA. Phytother Res. 2002;16:232. doi: 10.1002/ptr.828. [DOI] [PubMed] [Google Scholar]
- 27.Chen JW, Zhu ZQ, Hu TX, Zhu DY. Acta Pharmacol Sin. 2002;23:667. [PubMed] [Google Scholar]
- 28.Lien EJ, Ren S, Bui HH, Wang R. Free Radic Biol Med. 1999;26:285. doi: 10.1016/s0891-5849(98)00190-7. [DOI] [PubMed] [Google Scholar]
- 29.Amic D, vidovic-Amic D, Beslo D, Trinajstic N. Croatica Chem Acta. 2003;76:55. [Google Scholar]
- 30.Farkas O, Jakus J, Heberger K. Molecules. 2004;9:1079. doi: 10.3390/91201079. [DOI] [PMC free article] [PubMed] [Google Scholar]
- 31.Rackova L, Firakova S, Kostalova D, Stefek M, Sturdik E, Majekova M. Bioorg Med Chem. 2005;13:6477. doi: 10.1016/j.bmc.2005.07.047. [DOI] [PubMed] [Google Scholar]
- 32.Rasulev BF, Abdullaev ND, Syrov VN, Leszczynski J. QSAR Comb Sci. 2005;24:1056. [Google Scholar]
- 33.Varga Z, Seres I, Nagy E, Ujhelyi L, Balla G, Balla J, Antus S. Phytomedicine. 2006;13:85. doi: 10.1016/j.phymed.2004.06.019. [DOI] [PubMed] [Google Scholar]
- 34.Moitessier N, Henry C, Maigret B, Chapleur Y. J Med Chem. 2004;47:4178. doi: 10.1021/jm0311386. [DOI] [PubMed] [Google Scholar]
- 35.Loew GH, Villar HO, Alkorta I. Pharm Res. 1993;10:475. doi: 10.1023/a:1018977414572. [DOI] [PubMed] [Google Scholar]
- 36.Vedani A, Dobler M, Dollinger H, Hasselbach KM, Birke F, Lill MA. J Med Chem. 2005;48:1515. doi: 10.1021/jm040827u. [DOI] [PubMed] [Google Scholar]
- 37.Liu J, Pan D, Tseng Y, Hopfinger AJ. J Chem Inf Comput Sci. 2003;43:2170. doi: 10.1021/ci034142z. [DOI] [PubMed] [Google Scholar]
- 38.Saint-Cricq De Gaulejac N, Provost C, Vivas N. J Agric Food Chem. 1999;47:425. doi: 10.1021/jf980700b. [DOI] [PubMed] [Google Scholar]
- 39.Marfak A, Trouillas P, Allais DP, Champavier Y, Calliste CA, Duroux JL. J Agric Food Chem. 2003;51:1270. doi: 10.1021/jf020836g. [DOI] [PubMed] [Google Scholar]
- 40.Hanasaki Y, Ogawa S, Fukui S. Free Radic Biol Med. 1994;16:845. doi: 10.1016/0891-5849(94)90202-x. [DOI] [PubMed] [Google Scholar]
- 41.Valentova K, Sersen F, Ulrichova J. J Agric Food Chem. 2005;53:5577. doi: 10.1021/jf050403o. [DOI] [PubMed] [Google Scholar]
- 42.Rastelli G, Costantino L, Albasini A. Eur J Med Chem. 1995;30:141. [Google Scholar]
- 43.Lu J, Feng X, Sun Q, Lu H, Manabe M, Sugahara K, Ma D, Sagara Y, Kodama H. Clin Chim Acta. 2002;316:95. doi: 10.1016/s0009-8981(01)00725-2. [DOI] [PubMed] [Google Scholar]
- 44.Kanashiro A, Kabeya LM, Polizello AC, Lopes NP, Lopes JL, Lucisano-Valim YM. Phytother Res. 2004;18:61. doi: 10.1002/ptr.1368. [DOI] [PubMed] [Google Scholar]
- 45.Vaya J, Mahmood S, Goldblum A, Aviram M, Volkova N, Shaalan A, Musa R, Tamir S. Phytochemistry. 2003;62:89. doi: 10.1016/s0031-9422(02)00445-4. [DOI] [PubMed] [Google Scholar]
- 46.Arora A, Nair MG, Strasburg GM. Free Radic Biol Med. 1998;24:1355. doi: 10.1016/s0891-5849(97)00458-9. [DOI] [PubMed] [Google Scholar]
- 47.van Acker SA, van den Berg DJ, Tromp MN, Griffioen DH, van Bennekom WP, van d V, Bast A. Free Radic Biol Med. 1996;20:331. doi: 10.1016/0891-5849(95)02047-0. [DOI] [PubMed] [Google Scholar]
- 48.Estrada E, Quincoces JA, Patlewicz G. Mol Divers. 2004;8:21. doi: 10.1023/b:modi.0000006804.97390.40. [DOI] [PubMed] [Google Scholar]
- 49.Sadeghipour M, Terreux R, Phipps J. Toxicol In Vitro. 2005;19:155. doi: 10.1016/j.tiv.2004.06.009. [DOI] [PubMed] [Google Scholar]
- 50.Nemeikaite-Ceniene A, Imbrasaite A, Sergediene E, Cenas N. Arch Biochem Biophys. 2005;441:182. doi: 10.1016/j.abb.2005.07.002. [DOI] [PubMed] [Google Scholar]
- 51.Khlebnikov AI. Khim Farm Zhurn. 1994;28(11):32. [Google Scholar]
- 52.Khlebnikov A, Schepetkin I, Kwon BS. Cancer Biother Radiopharm. 2002;17:193. doi: 10.1089/108497802753773810. [DOI] [PubMed] [Google Scholar]
- 53.Khlebnikov AI, Naboka OI, Akhmedzhanov RR, Novozheeva TP, Saratikov AS. Khim Farm Zhurn. 1998;32(7):35. [Google Scholar]
- 54.Khlebnikov AI, Schepetkin IA, Quinn MT. Bioorg Med Chem. 2006;14:352. doi: 10.1016/j.bmc.2005.08.026. [DOI] [PubMed] [Google Scholar]
- 55.Mathiesen L, Malterud KE, Sund RB. Free Radic Biol Med. 1997;22:307. doi: 10.1016/s0891-5849(96)00277-8. [DOI] [PubMed] [Google Scholar]
- 56.Khlebnikov AI. Khim Farm Zhurn. 1997;31(3):41. [Google Scholar]
- 57.Khlebnikov AI. Zhurn Strukt Khim. 1998;39:698. [Google Scholar]
- 58.Khlebnikov AI, Akhmedzhanov RR, Naboka OI, Bakibaev AA, Tartynova MI, Novozheeva TP, Saratikov AS. Khim Farm Zhurn. 2005;39(1):19. [Google Scholar]
- 59.Cotelle N, Bernier JL, Catteau JP, Pommery J, Wallet JC, Gaydou EM. Free Radic Biol Med. 1996;20:35. doi: 10.1016/0891-5849(95)02014-4. [DOI] [PubMed] [Google Scholar]
- 60.Costantino L, Rastelli G, Albasini A. Eur J Med Chem. 1996;31:693. [Google Scholar]
- 61.Munoz-Espada AC, Wood KV, Bordelon B, Watkins BA. J Agric Food Chem. 2004;52:6779. doi: 10.1021/jf040087y. [DOI] [PubMed] [Google Scholar]
- 62.Furuno K, Akasako T, Sugihara N. Biol Pharm Bull. 2002;25:19. doi: 10.1248/bpb.25.19. [DOI] [PubMed] [Google Scholar]
- 63.Zahler S, Kowalski C, Brosig A, Kupatt C, Becker BF, Gerlach E. J Immunol Methods. 1997;200:173. doi: 10.1016/s0022-1759(96)00206-2. [DOI] [PubMed] [Google Scholar]
- 64.Li W, Chung SC. In Vitro Cell Dev Biol Anim. 2003;39:413. doi: 10.1290/1543-706X(2003)039<0413:FCEOLF>2.0.CO;2. [DOI] [PubMed] [Google Scholar]
- 65.Daiber A, August M, Baldus S, Wendt M, Oelze M, Sydow K, Kleschyov AL, Munzel T. Free Radic Biol Med. 2004;36:101. doi: 10.1016/j.freeradbiomed.2003.10.012. [DOI] [PubMed] [Google Scholar]
- 66.Ghose AK, Crippen GM. J Med Chem. 1985;28:333. doi: 10.1021/jm00381a013. [DOI] [PubMed] [Google Scholar]
- 67.Glen WG, Dunn WJ, Jr, Scott DR. Tetrahedron Comput Methodol. 1989;2:349. [Google Scholar]
- 68.Höskuldsson A. J Chemometrics. 1988;2:211. [Google Scholar]
- 69.Khlebnikov AI. Zhurn Strukt Khim. 1995;36:1083. [Google Scholar]
Associated Data
This section collects any data citations, data availability statements, or supplementary materials included in this article.


