Abstract
Selection of model organisms in the laboratory has the potential to generate useful substrates for testing evolutionary theories. These studies generally employ relatively long-term selections with weak selective pressures to allow the accumulation of multiple adaptations. In contrast to this approach, we analyzed two strains of Saccharomyces cerevisiae that were selected for resistance to multiple stress challenges by a rapid selection scheme to test whether the variation between rapidly selected strains might also be useful in evolutionary studies. We found that resistance to oxidative stress is a multigene trait in these strains. Both derived strains possess the same major-effect adaptations to oxidative stress, but have distinct modifiers of the phenotype. Similarly, both derived strains have altered their global transcriptional responses to oxidative stress in similar ways, but do have at least some distinct differences in transcriptional regulation. We conclude that short-term laboratory selections can generate complex genetic variation that may be a useful substrate for testing evolutionary theories.
SELECTIONS of model organisms in the laboratory are a useful complement to the study of natural variation in wild populations aimed at understanding principles of adaptive evolution. Indeed, selections in the laboratory have previously been used to address important questions in evolutionary biology such as the existence of transgressive segregation (Castle 1951), the fitness effects of mutation (Lenski and Travisano 1994; De Visser and Lenski 2002; Estes et al. 2004; Ostrowski et al. 2005; De Visser and Rozen 2006; Hegreness et al. 2006; Kassen and Bataillon 2006; Silander et al. 2007), the role of genome rearrangements (Dunham et al. 2002), the effects of haploidy and diploidy (Paquin and Adams 1983a; Zeyl et al. 2003), the frequency of parallelism vs. convergence (Cohan and Hoffmann 1986; Lenski and Travisano 1994; Buckling et al. 2003; Cooper et al. 2003; Herring et al. 2006), the effects of asexual and sexual lifestyles (Grimberg and Zeyl 2005; De Visser and Rozen 2006), and evolutionary change in gene expression (Ferea et al. 1999; Cooper et al. 2003; Riehle et al. 2003; Rifkin et al. 2005; Pelosi et al. 2006). Microorganisms are particularly attractive for these kinds of experiments due to the ease of culturing, control of environment, short generation time, and genetic tractability (Zeyl 2000; Elena and Lenski 2003). Several studies have employed the yeast, Saccharomyces cerevisiae as a model for natural selection (Paquin and Adams 1983a,b; Ferea et al. 1999; Zeyl et al. 2001, 2003, 2005; Dunham et al. 2002; Grimberg and Zeyl 2005).
One goal of these studies is to generate diversity that resembles, in some respects, the diversity found in natural populations. Most phenotypic variation in nature is continuous and results from the segregation of alleles at multiple genetic loci, as well as from environmental effects. Beneficial alleles that confer a fitness advantage tend to increase in frequency and eventually fix in natural populations. One major question is how many different combinations of alleles can be beneficial when a continuously varying trait comes under selection. The relative contribution of structural and regulatory changes to adaptive evolution is also unknown. Genetic diversity generated from selections in the laboratory could be a useful tool for addressing these questions.
Genetic diversity generated from selections in the laboratory must be sufficiently complex to serve as a useful model of natural variation. Intuitively, strong selections applied over short intervals are expected to produce single genetic changes of large effect that show simple monogenic inheritance, while weak selections applied over long periods of time are expected to produce multiple genetic changes of smaller effect that show complex inheritance (Elena and Lenski 2003). Empirically, weak selection regimes applied over long periods of time do allow the accumulation of multiple genetic changes with smaller effect sizes (Lenski and Travisano 1994; De Visser and Lenski 2002) and may better mimic natural variation. The practical difficulty, however, of continually and accurately maintaining multiple lines over the course of long-term selections presents a barrier to performing certain types of experiments. For example, to address mechanisms of convergence, it is necessary to maintain a very large number of independent lines over a long period of time, an experiment that is not currently practical in many systems (Castle 1951; Paquin and Adams 1983a,b; Lenski and Travisano 1994; Laurie et al. 2004). This barrier might be overcome if stronger selections conducted over shorter periods of time can generate comparable genetic variation.
As a complement to existing studies on yeast selections, we analyzed two strains from a selection in the laboratory designed to produce stress-resistant clones for industrial purposes (Cakar et al. 2005). We sought to determine whether the relatively short duration of selection, the stringency of selection, and the use of a mutagen would bias the selection toward less genetically complex phenotypes or whether such selections could produce strains with genetically complex traits that can be used to study adaptive evolution.
MATERIALS AND METHODS
Strains, plasmids, and primers:
Strains were cultured on solid yeast extract-peptone-dextrose (YPD) medium or in liquid synthetic complete (SC) medium unless otherwise noted.
The haploid S. cerevisiae strain CEN.PK 113-14A (MATa, MAL2-8c, SUC2) was used as the ancestor for the selections performed. JWY100 is a clonal isolate of the MATα CEN.PK 113-14A haploid with the MET14 locus replaced by the kanamycin resistance cassette (KanMX4) (Goldstein and Mccusker 1999) (amplified using primers 5′-ACGACGCCTTGGCAATGTAGCA-3′ and 5′-GCAAAGCACGCCTCAAAATCTGGT-3′) from the met14Δ0 homozygous diploid from the systematic deletion collection (Giaever et al. 2002). All transformations were performed as described in Gietz and Woods (2002).
Strain JWY101 is a clonal isolate of population H1T2N3 that has been transformed with a plasmid containing a nourseothricin (Nat) resistance cassette (Goldstein and Mccusker 1999) (Mark Johnston, Washington University School of Medicine, St. Louis). Strain JWY102 is a clonal isolate of population H1H2 that has been transformed with a plasmid containing a Nat resistance cassette. To cross JWY101 and JWY102 we transformed the same clonal isolate of H1H2 as JWY102 with a plasmid containing both a Kan resistance cassette and the HO locus (John McCusker, Duke University, Durham, NC). We used dual selection (geneticin and Nat) to select hybrid diploids from all crosses.
Quantitative 96-well growth assay:
We arrayed samples in 96-well plate format. Two days prior to the assay, frozen samples were pinned onto solid YPD and incubated overnight at 30°. One day prior to the assay, single colonies were suspended in 500 μl SC medium and incubated overnight at 30° with shaking at 325 rpm in deep-well 96-well plates (Corning no. 3960). We diluted 10 μl of each sample in 490 μl fresh SC medium and incubated them at 30° for 5 hr with shaking at 325 rpm.
After incubation, all samples were diluted in SC medium to 5.26 × 10⁶ cells/ml in 190 μl total volume. We divided each dilute culture into two 95-μl samples in adjacent wells of a 96-well microtiter plate (Corning no. 3595). We added 5 μl of either SC medium or 20 mm H2O2 in SC (1 mm H2O2 final) to each well. Samples were incubated on a BioTek (Winooski, VT) Synergy HT plate reader for 20 hr at 30° with shaking at ∼1200 rpm (level 3) for 20 sec every 4 min. The reader measured the cell density (absorbance at 600 nm: A600) immediately after every shaking period (299 total measurements).
To calculate the growth constant for a sample, we Log2 transformed the A600 measurements and analytically determined the best-fit least-squares linear regression through all time points where −2.5 < Log2(A600) < −2. The best-fit least-squares linear regression assumes the form  , where y is Log2(A600), x is time in seconds, b is the intercept, and m is the growth constant in Log2(OD600) · s−1 units.
Biometric analysis of tetrads:
Spores were identified as having the phenotype of the ancestral parent (JWY100), the derived parent (JWY101 or JWY102), or neither, using the z-test (α = 0.05) to determine from which phenotypic distribution an individual spore measurement was drawn. Tetrads with two spores with the ancestral phenotype and two with the derived phenotype were identified as having 2:2 segregation. The probability of a false positive (a tetrad with 2:2 segregation identified as not having 2:2 segregation due to mislabeling of a spore), if the phenotype is monogenic and all tetrads segregate 2:2, can be determined from the binomial distribution
 |
where p = 0.05 is the probability of incorrectly calling a spore derived from a parental distribution as being distinct, q = 0.95 is the probability of correctly calling the spore, and N = 4 is the number of spores in the tetrad. This analysis assumes that the parental distributions are Gaussian and the probability of sampling one parent sample from the other parental distribution is infinitesimal (JWY100 vs. JWY101, P = 1.83 × 10−44; JWY100 vs. JWY102, P = 6.38 × 10−48; two-tailed student's t-test). If any one of the four spores is incorrectly labeled, then the tetrad will also be incorrectly labeled. Therefore, the probability, PI, of incorrectly labeling a tetrad that segregates 2:2 is
 |
where P(x = 0) is the probability of making no incorrect calls on the spores in a tetrad. The expected number of incorrect calls, if every tetrad is segregating 2:2, is
 |
where n is the number of tetrads assayed.
Additionally, we determined the distribution of growth constants in H2O2 for eight replicates of each spore from a single tetrad from the JWY100 × JWY101 and JWY100 × JWY102 crosses as above. We ranked the spores in a tetrad by their average growth constant in H2O2 and defined 2:2 segregation as the null hypotheses where
 |
where μ is the mean growth constant (A, ancestral parent; D, derived parent; α, highest-ranked spore; β, second-ranked spore; γ, third-ranked spore; δ, lowest-ranked spore). Deviation from either null hypothesis indicates non-2:2 segregation. We used a single-factor analysis of variance (ANOVA) (α = 0.05) to test the 2:2 segregation null hypotheses.
We calculated the segregational variance ( ) as described elsewhere (Lynch and Walsh 1998). Broad sense heritability (H2) for each cross was calculated as described elsewhere (Moore and Mccabe 2006),
 |
where  is the variance due to environment, which is equal to the pooled variance of the parents (Lynch and Walsh 1998).
To test for epistasis, we used an adaptation, from Brem and Kruglyak (2005), of the Δ-statistic of Lynch and Walsh (1998).
Transcription profiling:
Three clones each of JWY100, JWY101, and JWY102 were suspended in 3 ml SC medium and incubated overnight at 30° with shaking at 325 rpm. On the next day, we diluted the 3-ml overnight cultures in 125 ml fresh SC medium. We incubated these cultures at 30° for 6 hr at 325 rpm until all cultures were in exponential-phase growth. The cell density of each culture was measured on an Eppendorf (Westbury, NY) BioPhotometer. We diluted each culture to 8 × 10⁶ cells/ml in SC medium (50 ml total volume) twice. Either 7 μl SC medium or 8.8 m H2O2 (1.2 mm H2O2 final) was added to each replicate. Both treatments were incubated at 30° for 1 hr at 325 rpm.
RNA extractions, sample labeling, microarray hybridizations, and mixed-model ANOVA were performed as described by Gerke et al. (2006) with the following changes.
The first mixed ANOVA model removes the genomewide effects of strain and condition on transcript levels,
 |
where  is the median of ratios for each spot, μ is the baseline expression at each spot independent of all other factors,
  is the average strain main effect,
  is the average condition main effect,
  is the average array main effect,
  is the average strain-by-condition interaction effect, and
  is the residual.
The second mixed ANOVA model, applied separately to each transcript using the residuals of the first model with outliers removed,
 |
where  is the residual from the first mixed ANOVA model for each spot,
  is the average gene expression for each gene g,
  is the expression due to strain i,
  is the expression due to condition j,
  is the expression due to array k,
  is the expression due to the strain-by-condition interaction effect, and
  is the residual. Genes with significant effects were determined using a false discovery rate (FDR) of 0.05 as described in Gerke et al. (2006). For genes with significant strain main effects, differences in expression between pairs of strains were identified by comparing the least-squares means of each strain using the t-test.
The unrooted tree and estimated branch lengths describing the relationships among transcription profiles were found using CONTML from Phylogeny Inference Package (PHYLIP) version 3.6 (Felsenstein 1985, 1989, 2005). Bootstrap support (Felsenstein 1985) for this tree was determined using 1000 pseudo-data sets by CONSENSE from PHYLIP version 3.6.
RESULTS
Oxidative stress resistance in ancestral and derived strains:
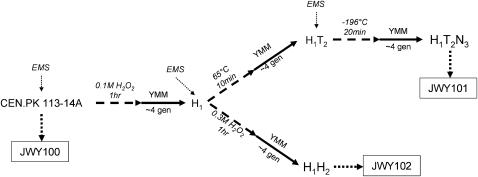
To test whether the variation between rapidly selected strains might be useful in evolutionary studies, we isolated individual clones from two different populations of yeast that were selected for tolerance to multiple stresses (Cakar et al. 2005) (Figure 1). JWY101 is an individual clone from the H1T2N3 population that was first selected for tolerance to the oxidizing agent hydrogen peroxide (H2O2) and then subjected to both a high-temperature selection and a freeze/thaw selection. JWY102 is a clone from the H1H2 population, which was split from the H1T2N3 population after the initial selection in H2O2 and then subjected to additional selection in H2O2. The ancestral strain for both populations is CEN.PK 113-14A.
Figure 1.—
Derivation and phenotype of strains. A schematic of selection used to derive JWY101 and JWY102 after Cakar et al. (2005) is shown. JWY100 is an isogenic, clonal derivative of CEN.PK 113-14A. Cakar et al. (2005) performed the selection for stress-resistant populations as follows. The ancestral population was EMS mutagenized and then treated with H2O2 for 1 hr. The surviving population recovered overnight in minimal medium (YMM). This population was EMS mutagenized and split into two lines. One line was exposed to heat stress followed by overnight recovery in YMM and EMS mutagenesis and freeze/thaw stress (H1T2N3) from which a clonal derivative was isolated (JWY101). The second line was exposed to H2O2 and allowed to recover overnight in YMM. From this population (H1H2), a clonal derivative was isolated (JWY102).
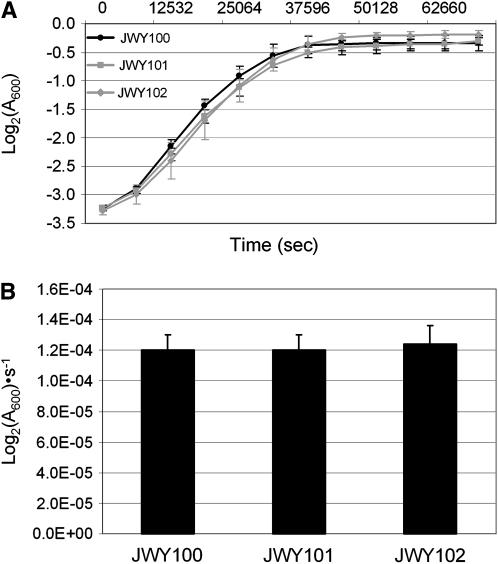
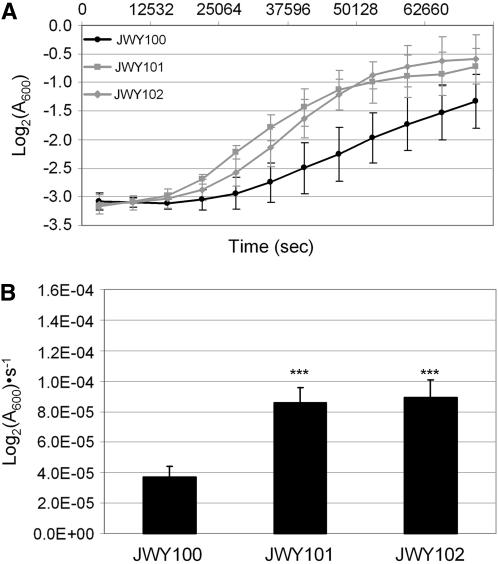
We quantified the oxidative stress resistance phenotype of JWY100, an isogenic derivative of the ancestral strain, CEN.PK 113-14A, and of the two derived strains, JWY101 and JWY102. We measured the growth constants (Log2(A600) · s−1) of each of these strains in SC medium in either the presence or the absence of 1 mm H2O2. In untreated SC medium, the growth curves for all three strains were similar (Figure 2A) and there was no statistical difference in growth constants in untreated media between the strains (P > 0.044 for all comparisons, two-tailed student's t-test, Figure 2B). When challenged with H2O2, the two derived strains grew more rapidly than the ancestral strain (Figure 3A). The growth constants of both JWY101 and JWY102 in oxidative stress are approximately twofold greater than that of their ancestor, JWY100 (Figure 3B). The differences between growth constants in oxidative stress for the two derived strains is not significant (P = 0.087, two-tailed student's t-test).
Figure 2.—
Growth in untreated media. (A) Growth in untreated SC medium of JWY100, JWY101, and JWY102 over 20 hr. (B) Growth constants in untreated SC medium of JWY100, JWY101, and JWY102. Growth constants in untreated SC medium are approximately equal in the three strains.
Figure 3.—
Growth in oxidative stress conditions. (A) Growth in SC medium treated with 1 mM H2O2 of JWY100, JWY101, and JWY102. JWY101 and JWY102 show greater growth in the presence of H2O2 than the ancestral strain, JWY100. (B) Growth constants in SC medium treated with 1 mm H2O2 of JWY100, JWY101, and JWY102. Growth constants for JWY101 and JWY102 are approximately equal, but are significantly greater than that of JWY100 (***P ≪ 0.001).
Evidence that oxidative stress resistance segregates as a multigene trait:
The derivation of JWY101 and JWY102 used a strong selection applied over a relatively small number of generations. We sought to determine if this scheme allowed time for multiple, adaptive, genetic changes to fix in these strains or if a single adaptive change could account for the phenotypic variation in the F2 generations of crosses between the ancestral strain, JWY100, and the derived strains, JWY101 and JWY102.
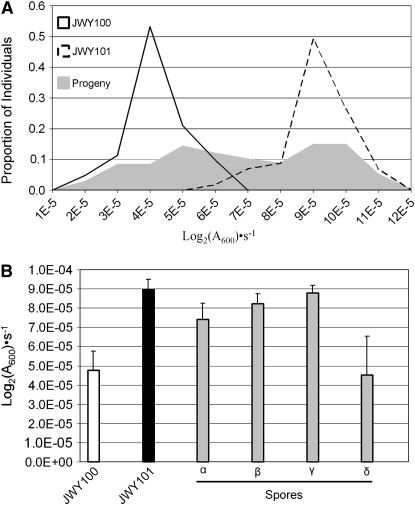
The phenotypic distribution of the progeny of the JWY100 × JWY101 cross is not strictly bimodal, suggesting the phenotype is controlled by more than one locus (Figure 4A). The distribution of progeny phenotypes, however, is not significantly different from a composite of the two parental distributions (two-tailed P = 0.1145, Mann–Whitney–Wilcoxon test). We, therefore, sought additional lines of evidence to determine whether oxidative stress resistance is a monogenic or a multigenic trait in JWY101.
Figure 4.—
Segregation of oxidative stress resistance in a JWY100 × JWY101 cross. (A) Frequency distribution of growth constants in SC medium treated with 1 mm H2O2 of JWY100, JWY101, and the F2 progeny of the JWY100 × JWY101 cross. (B) Growth constants in SC medium treated with 1 mm H2O2 for JWY100, JWY101, and the four spores (α, β, γ, and δ) of a representative tetrad from the JWY100 × JWY101 cross. Oxidative stress resistance does not segregate 2:2 in this tetrad.
We took advantage of the fact that, in S. cerevisiae, the four meiotic products are encased in a structure called a tetrad and can be analyzed individually. In the case where a single adaptive change is responsible for the oxidative stress resistance of a derived strain, the resistance phenotype should segregate 2:2 in tetrads. If more than one adaptive change is involved, the spores in tetrads will show a more complex pattern of segregation.
We determined whether oxidative stress resistance segregates 2:2 in tetrads derived from the JWY100 × JWY101 cross. Among the progeny, the oxidative stress resistance phenotype does not segregate 2:2 in 44 of 54 tetrads (10/54 expected if all tetrads are 2:2). The phenotypes of the spores from a representative tetrad are shown in Figure 4B. In this tetrad, there is significant variation in the mean oxidative stress resistance between JWY100 and the two lowest-ranked spores (P = 5.95 × 10⁻⁴, single-factor ANOVA) and between JWY101 and the two highest-ranked spores (P = 0.024, single-factor ANOVA). This segregation pattern is not consistent with oxidative stress resistance arising from a single genetic change in JWY101. In addition, the progeny mean phenotypic value is located between the mean of JWY101 and the midparent value, suggesting epistasis between segregating loci. In this cross, a t-test for epistasis was significant (P = 0.024).
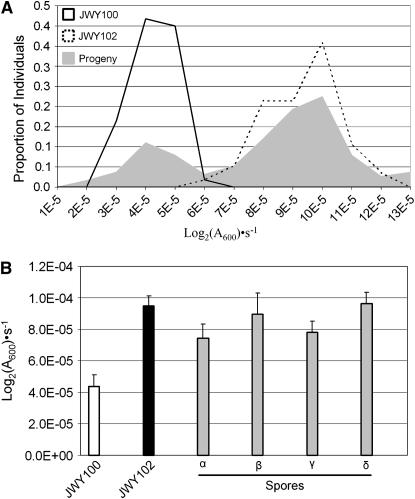
Oxidative stress resistance is also a multigenic trait in JWY102. The progeny distribution from the JWY100 × JWY102 cross is not strictly bimodal, suggesting the segregation of multiple involved genes (Figure 5A). This distribution of phenotypes in the progeny is significantly different from a composite of the JWY100 and JWY102 phenotype distributions (two-tailed P = 0.0007, Mann–Whitney–Wilcoxon test). Similarly, oxidative stress resistance does not segregate 2:2 in 38 of 48 tetrads (9/48 expected if all tetrads are 2:2) from the JWY100 × JWY102 cross. The phenotypes of the spores from a representative tetrad are shown in Figure 5B. In this tetrad, there is significant variation in the mean oxidative stress resistance between JWY100 and the two lowest-ranked spores (P = 2.16 × 10⁻⁸, single-factor ANOVA), but there is not significant variation between JWY102 and the two highest-ranked spores (P = 0.667, single-factor ANOVA). This segregation pattern strongly suggests that oxidative stress resistance is not a monogenic trait in JWY102. In addition, the progeny mean phenotypic value is located between the mean of JWY102 and the midparent value, suggesting epistasis between segregating loci. A t-test for epistasis was significant (P < 0.0001).
Figure 5.—
Segregation of oxidative stress resistance in a JWY100 × JWY102 cross. (A) Frequency distribution of growth constants in SC medium treated with 1 mm H2O2 of JWY100, JWY102, and the F2 progeny of the JWY100 × JWY102 cross. (B) Growth constants in SC medium treated with 1 mm H2O2 for JWY100, JWY102, and the four spores (α, β, γ, and δ) of a representative tetrad from the JWY100 × JWY102 cross. Oxidative stress resistance does not segregate 2:2 in this tetrad.
JWY101 and JWY102 have the same major-effect adaptations:
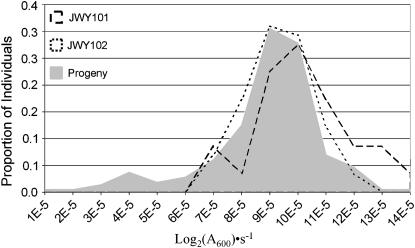
We sought to determine whether JWY101 and JWY102 contain the same or different genetic adaptations. We compared the segregational variance [the additional variation in the F2 progeny due to the segregation of parental genes (Lynch and Walsh 1998)] from a cross between JWY101 and JWY102 ( ) (Figure 6) to the variance observed in the crosses of these strains to the ancestral strain (JWY100 × JWY101,
  ; and JWY100 × JWY102,
  ) (Figures 4A and 5A). There is a threefold reduction in segregational variance in the cross between the derived lines, suggesting that fewer parental genes are segregating in the cross between the derived lines and that JWY101 and JWY102 have the same major-effect adaptations for oxidative stress resistance.
Figure 6.—
Segregation of oxidative stress resistance in a JWY100 × JWY102 cross. (A) Frequency distribution of growth constants in SC medium treated with 1 mm H2O2 of JWY101, JWY102, and the F2 progeny of the JWY101 × JWY102 cross.
The broad sense heritability (H2) represents the portion of the variance in the progeny phenotypes that can be explained by variance in their genotypes. The heritability in the progeny of the JWY101 × JWY102 cross (H2 = 0.490) indicates that additional loci of small effect, which differ between JWY101 and JWY102, are also segregating in this cross. Because a t-test for epistasis was highly significant (P < 0.0001), these additional minor-effect loci appear to have epistatic interactions with each other or with the major-effect loci in this cross.
Transcription profiling of derived strains:
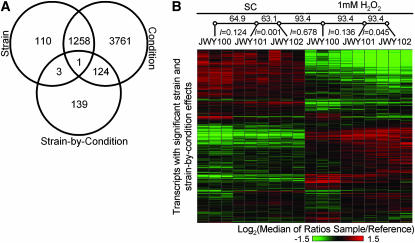
The oxidative stress response in yeast includes dramatic changes in transcriptional regulation (Jamieson 1998; Gasch et al. 2000). Accordingly, the transcriptional response to H2O2 treatment can be used to assess the level of similarity in the oxidative stress response of JWY100, JWY101, and JWY102. To assess the similarity of transcriptional regulatory responses, we extracted mRNA from three replicate cultures of JWY100, JWY101, and JWY102 grown in both the presence and the absence of H2O2. We used a mixed-model ANOVA to identify transcripts with significant (FDR < 0.05) strain main effects, condition main effects, and strain-by-condition main effects (Figure 7A).
Figure 7.—
Transcription profiling. (A) Venn diagram showing the number of transcripts with significant effects from mixed-model ANOVA. (B) Heat map of relative transcript abundance of transcripts with a significant strain main effect or a strain-by-condition main effect (1635 transcripts). Relationship between transcription profiles is shown by an unrooted tree (open circles are nodes). Bootstrap support for each branch is indicated above the branch and estimated branch lengths are shown below.
Downregulation of oxidative phosphorylation and increased proteolysis characterize the response to oxidative stress in yeast (Jamieson 1998; Gasch et al. 2000). Transcripts with significant strain-by-condition effects, which are expressed similarly in JWY101 and JWY102, but differently in JWY100, are enriched for Gene Ontology (GO) function terms (Berriz et al. 2003) related to oxidative phosphorylation and protein catabolism. The derived strains appear to have an exaggerated version of the typical response to oxidative stress.
We evaluated the relationship of the transcriptional response to oxidative stress among the three strains by constructing an unrooted tree from all 18 samples, using transcripts with either a significant strain main effect or a strain-by-condition interaction effect (Figure 7B). We did not include transcripts with only a significant condition main effect, because these transcripts represent the response to oxidative stress that is common among the three strains. Samples are grouped by condition. Within conditions, there is strong bootstrap support, indicating that the transcription profiles of the two derived strains, JWY101 and JWY102, are closer to each other than to JWY100, in both conditions. The transcription profiles of the derived strains have the greatest divergence from the ancestral strain in the presence of H2O2 (Figure 7B).
Although the expression profiles of the derived strains are far more similar to each other then they are to that of the ancestral strain, there are at least some distinct differences. In particular, the transcriptional response of JWY102 appears to have diverged further from the ancestral response than that of JWY101. We therefore tested the hypothesis that JWY101 has significantly fewer mRNAs transcribed differently from the ancestral line than JWY102. The results of this test indicate that the transcriptional profile of JWY101 has diverged less from the ancestral strain than that of JWY102 (P = 6.36 × 10−40, χ2-test).
DISCUSSION
It has been previously shown that long-term, weak selections in the laboratory can produce variation similar to that observed in natural isolates. The traits generated are generally genetic and quantitative, increase directionally throughout the period of selection, and involve both regulatory and structural adaptations (Castle 1951; Paquin and Adams 1983a,b; Cohan and Hoffmann 1986; Lenski and Travisano 1994; Ferea et al. 1999; De Visser and Lenski 2002; Dunham et al. 2002; Buckling et al. 2003; Cooper et al. 2003; Elena and Lenski 2003; Riehle et al. 2003; Zeyl et al. 2003, 2005; Laurie et al. 2004; Crozat et al. 2005; Grimberg and Zeyl 2005; Rifkin et al. 2005; De Visser and Rozen 2006; Pelosi et al. 2006). These studies, however, can be intensive in both labor and resources. As a result, these studies are limited in the number of replicate strains and conditions that can be explored. If comparable variation can be generated from short selections in the laboratory, the reduction in labor and cost would allow key questions to be explored more systematically, such as the frequency of convergence relative to parallelism or the relationship of the strength of selection to the genetic complexity of adaptation.
We examined the adaptation to oxidative stress in two strains derived in the laboratory to determine whether a short intense selection can generate variation comparable to long-term, weak selections. A key element of this selection was the use of ethyl methanesulfonate (EMS) mutagenesis to create genetic variation in the starting population, therefore reducing the time required for mutation accumulation.
In natural populations, quantitative variation is the result of segregation of alleles at multiple loci. A primary concern with short-term selections in the laboratory is that they are likely to produce adaptive phenotypes arising from a single genetic change. We sought to determine whether a short-term selection for stress resistance produced multigenic phenotypes in the derived lines. The oxidative stress phenotype in JWY102 is clearly multigenic. Both biometric and tetrad analyses indicated the presence of multiple involved genes segregating among the progeny of a cross between JWY102 and the ancestral strain. The results with JWY101 were less clear cut. Biometric analysis showed no significant deviation from the progeny distribution that would be expected if only one gene caused the oxidative stress phenotype, but tetrad analysis showed clear deviation from 2:2 segregation, suggesting more than one involved locus. The evidence for epistasis in the JWY100 × JWY101 cross and transgressive segregation in the JW101 × JWY102 cross also suggests the involvement of more than one gene in the oxidative stress resistance phenotype of JWY101. Our interpretation of these data is that the oxidative stress resistance phenotype is a relatively simple complex trait, perhaps with as few as one major-effect locus and a few additional minor-effect loci. Our results suggest that short-term selection in the laboratory can generate traits with a complex genetic basis, but that sometimes these complex traits will have relatively simple architectures.
Given that the ancestral strain was selected for oxidative stress resistance before it was split into two strains (Figure 1), we asked whether JWY101 and JWY102 had the same adaptations to oxidative stress. To answer this question, we crossed the two derived strains and examined the segregation of the phenotype in the F2 haploid progeny. We observed a threefold reduction in segregational variance in the progeny of this cross compared to the progeny of either strain backcrossed to the ancestral strain. This result suggests that JWY101 and JWY102 have the same major-effect adaptations to oxidative stress. It also suggests that the major-effect adaptations fixed in the population early, before the strains were split at H1 (Figure 1). The transcriptional profiles of JWY101 and JWY102 also show marked similarities in both treated and untreated cells that are distinct from the ancestral strain, JWY100. These differences in expression may result, directly or indirectly, from the influence of shared major-effect loci.
The two derived strains also have distinct differences that likely accumulated after the culture was split. The heritability of stress resistance in the JWY101 × JWY102 cross (H2 = 0.490) and evidence for epistatic interactions between loci indicate that unique modifiers of the phenotype have arisen in each strain after they were split from their common ancestor. Likewise there are small, but significant, differences in the expression profiles between the two derived strains. Overall, the transcription data are in agreement with the genetic data. The transcriptional responses of JWY101 and JWY102 are very similar, with some differences (Figures 6 and 7B); but, both strains differ substantially from JWY100 (Figures 4A, 5A, and 7B).
Regulatory effects have been shown to be important for evolutionary changes in several different lineages (Carroll 2005; Wray 2007). The set of transcripts with significant strain-by-condition effects was enriched for functions related to oxidative phosphorylation and protein degredation. These classes of genes are known to be regulated as part of the typical response to oxidative stress (Jamieson 1998; Gasch et al. 2000). The fact that the regulation of these classes of genes is altered in the derived strains suggests that they are likely part of the adaptation to oxidative stress.
Here we have shown that a short-term selection on a mutagenized population can be used to develop genetically complex adapted strains. These strains may be suitable substrates for testing theories of adaptive evolution. While long-term selection in the laboratory will continue to play an important role in testing evolutionary theories, short-term selections will be a useful complement to these studies, especially when the study design requires generating large numbers of parallel strains.
Acknowledgments
We thank Petek Çakar and Uwe Sauer for providing strains, Mark Johnston and John McCusker for providing plasmids, and Justin Fay and members of the Cohen Lab for advice and discussion. This work was supported by grants from the American Cancer Society (RSG-06-039-01-GMC) and the National Science Foundation (0543156).
References
- Berriz, G. F., O. D. King, B. Bryant, C. Sander and F. P. Roth, 2003. Characterizing gene sets with FuncAssociate. Bioinformatics 19: 2502–2504. [DOI] [PubMed] [Google Scholar]
- Brem, R. B., and L. Kruglyak, 2005. The landscape of genetic complexity across 5,700 gene expression traits in yeast. Proc. Natl. Acad. Sci. USA 102: 1572–1577. [DOI] [PMC free article] [PubMed] [Google Scholar]
- Buckling, A., M. A. Wills and N. Colegrave, 2003. Adaptation limits diversification of experimental bacterial populations. Science 302: 2107–2109. [DOI] [PubMed] [Google Scholar]
- Cakar, Z. P., U. O. Seker, C. Tamerler, M. Sonderegger and U. Sauer, 2005. Evolutionary engineering of multiple-stress resistant Saccharomyces cerevisiae. FEMS Yeast Res. 5: 569–578. [DOI] [PubMed] [Google Scholar]
- Carroll, S. B., 2005. Evolution at two levels: on genes and form. PLoS Biol. 3: e245. [DOI] [PMC free article] [PubMed] [Google Scholar]
- Castle, W. E., 1951. Variation in the hooded pattern of rats, and a new allele of Hooded. Genetics 36: 254–266. [DOI] [PMC free article] [PubMed] [Google Scholar]
- Cohan, F. M., and A. A. Hoffmann, 1986. Genetic divergence under uniform selection. II. Different responses to selection for knockdown resistance to ethanol among Drosophila melanogaster populations and their replicate lines. Genetics 114: 145–164. [DOI] [PMC free article] [PubMed] [Google Scholar]
- Cooper, T. F., D. E. Rozen and R. E. Lenski, 2003. Parallel changes in gene expression after 20,000 generations of evolution in Escherichia coli. Proc. Natl. Acad. Sci. USA 100: 1072–1077. [DOI] [PMC free article] [PubMed] [Google Scholar]
- Crozat, E., N. Philippe, R. E. Lenski, J. Geiselmann and D. Schneider, 2005. Long-term experimental evolution in Escherichia coli. XII. DNA topology as a key target of selection. Genetics 169: 523–532. [DOI] [PMC free article] [PubMed] [Google Scholar]
- de Visser, J. A., and R. E. Lenski, 2002. Long-term experimental evolution in Escherichia coli. XI. Rejection of non-transitive interactions as cause of declining rate of adaptation. BMC Evol. Biol. 2: 19. [DOI] [PMC free article] [PubMed] [Google Scholar]
- de Visser, J. A., and D. E. Rozen, 2006. Clonal interference and the periodic selection of new beneficial mutations in Escherichia coli. Genetics 172: 2093–2100. [DOI] [PMC free article] [PubMed] [Google Scholar]
- Dunham, M. J., H. Badrane, T. Ferea, J. Adams, P. O. Brown et al., 2002. Characteristic genome rearrangements in experimental evolution of Saccharomyces cerevisiae. Proc. Natl. Acad. Sci. USA 99: 16144–16149. [DOI] [PMC free article] [PubMed] [Google Scholar]
- Elena, S. F., and R. E. Lenski, 2003. Evolution experiments with microorganisms: the dynamics and genetic bases of adaptation. Nat. Rev. Genet. 4: 457–469. [DOI] [PubMed] [Google Scholar]
- Estes, S., P. C. Phillips, D. R. Denver, W. K. Thomas and M. Lynch, 2004. Mutation accumulation in populations of varying size: the distribution of mutational effects for fitness correlates in Caenorhabditis elegans. Genetics 166: 1269–1279. [DOI] [PMC free article] [PubMed] [Google Scholar]
- Felsenstein, J., 1985. Confidence limits on phylogenies: an approach using the bootstrap. Evolution 39: 783–791. [DOI] [PubMed] [Google Scholar]
- Felsenstein, J., 1989. PHYLIP - Phylogeny Inference Package (version 3.2). Cladistics 5: 164–166. [Google Scholar]
- Felsenstein, J., 2005. PHYLIP (Phylogeny Inference Package) version 3.66. Department of Genome Sciences, University of Washington, Seattle. (http://evolution.genetics.washington.edu/phylip.html).
- Ferea, T. L., D. Botstein, P. O. Brown and R. F. Rosenzweig, 1999. Systematic changes in gene expression patterns following adaptive evolution in yeast. Proc. Natl. Acad. Sci. USA 96: 9721–9726. [DOI] [PMC free article] [PubMed] [Google Scholar]
- Gasch, A. P., P. T. Spellman, C. M. Kao, O. Carmel-Harel, M. B. Eisen et al., 2000. Genomic expression programs in the response of yeast cells to environmental changes. Mol. Biol. Cell 11: 4241–4257. [DOI] [PMC free article] [PubMed] [Google Scholar]
- Gerke, J. P., C. T. L. Chen and B. A. Cohen, 2006. Natural isolates of Saccharomyces cerevisiae display complex genetic variation in sporulation efficiency. Genetics 174: 985–997. [DOI] [PMC free article] [PubMed] [Google Scholar]
- Giaever, G., A. M. Chu, L. Ni, C. Connelly, L. Riles et al., 2002. Functional profiling of the Saccharomyces cerevisiae genome. Nature 418: 387–391. [DOI] [PubMed] [Google Scholar]
- Gietz, R. D., and R. A. Woods, 2002. Transformation of yeast by lithium acetate/single-stranded carrier DNA/polyethylene glycol method. Methods Enzymol. 350: 87–96. [DOI] [PubMed] [Google Scholar]
- Goldstein, A. L., and J. H. McCusker, 1999. Three new dominant drug resistance cassettes for gene disruption in Saccharomyces cerevisiae. Yeast 15: 1541–1553. [DOI] [PubMed] [Google Scholar]
- Grimberg, B., and C. Zeyl, 2005. The effects of sex and mutation rate on adaptation in test tubes and to mouse hosts by Saccharomyces cerevisiae. Evol. Int. J. Org. Evol. 59: 431–438. [PubMed] [Google Scholar]
- Hegreness, M., N. Shoresh, D. Hartl and R. Kishony, 2006. An equivalence principle for the incorporation of favorable mutations in asexual populations. Science 311: 1615–1617. [DOI] [PubMed] [Google Scholar]
- Herring, C. D., A. Raghunathan, C. Honisch, T. Patel, M. K. Applebee et al., 2006. Comparative genome sequencing of Escherichia coli allows observation of bacterial evolution on a laboratory timescale. Nat. Genet. 38: 1406–1412. [DOI] [PubMed] [Google Scholar]
- Jamieson, D. J., 1998. Oxidative stress responses of the yeast Saccharomyces cerevisiae. Yeast 14: 1511–1527. [DOI] [PubMed] [Google Scholar]
- Kassen, R., and T. Bataillon, 2006. Distribution of fitness effects among beneficial mutations before selection in experimental populations of bacteria. Nat. Genet. 38: 484–488. [DOI] [PubMed] [Google Scholar]
- Laurie, C. C., S. D. Chasalow, J. R. LeDeaux, R. McCarroll, D. Bush et al., 2004. The genetic architecture of response to long-term artificial selection for oil concentration in the maize kernel. Genetics 168: 2141–2155. [DOI] [PMC free article] [PubMed] [Google Scholar]
- Lenski, R. E., and M. Travisano, 1994. Dynamics of adaptation and diversification: a 10,000-generation experiment with bacterial populations. Proc. Natl. Acad. Sci. USA 91: 6808–6814. [DOI] [PMC free article] [PubMed] [Google Scholar]
- Lynch, M., and B. Walsh, 1998. Genetics and Analysis of Quantitative Traits. Sinauer, Sunderland, MA.
- Moore, D. S., and G. P. McCabe, 2006. Introduction to the Practice of Statistics. W. H. Freeman, New York.
- Ostrowski, E. A., D. E. Rozen and R. E. Lenski, 2005. Pleiotropic effects of beneficial mutations in Escherichia coli. Evol. Int. J. Org. Evol. 59: 2343–2352. [PubMed] [Google Scholar]
- Paquin, C., and J. Adams, 1983. a Frequency of fixation of adaptive mutations is higher in evolving diploid than haploid yeast populations. Nature 302: 495–500. [DOI] [PubMed] [Google Scholar]
- Paquin, C. E., and J. Adams, 1983. b Relative fitness can decrease in evolving asexual populations of S. cerevisiae. Nature 306: 368–370. [DOI] [PubMed] [Google Scholar]
- Pelosi, L., L. Kuhn, D. Guetta, J. Garin, J. Geiselmann et al., 2006. Parallel changes in global protein profiles during long-term experimental evolution in Escherichia coli. Genetics 173: 1851–1869. [DOI] [PMC free article] [PubMed] [Google Scholar]
- Riehle, M. M., A. F. Bennett, R. E. Lenski and A. D. Long, 2003. Evolutionary changes in heat-inducible gene expression in lines of Escherichia coli adapted to high temperature. Physiol. Genomics 14: 47–58. [DOI] [PubMed] [Google Scholar]
- Rifkin, S. A., D. Houle, J. Kim and K. P. White, 2005. A mutation accumulation assay reveals a broad capacity for rapid evolution of gene expression. Nature 438: 220–223. [DOI] [PubMed] [Google Scholar]
- Silander, O. K., O. Tenaillon and L. Chao, 2007. Understanding the evolutionary fate of finite populations: the dynamics of mutational effects. PLoS Biol. 5: 94. [DOI] [PMC free article] [PubMed] [Google Scholar]
- Wray, G. A., 2007. The evolutionary significance of cis-regulatory mutations. Nat. Rev. Genet. 8: 206–216. [DOI] [PubMed] [Google Scholar]
- Zeyl, C., 2000. Budding yeast as a model organism for population genetics. Yeast 16: 773–784. [DOI] [PubMed] [Google Scholar]
- Zeyl, C., M. Mizesko and J. A. G. M. d. Visser, 2001. Mutational meltdown in laboratory yeast populations. Evolution 55: 909–917. [DOI] [PubMed] [Google Scholar]
- Zeyl, C., T. Vanderford and M. Carter, 2003. An evolutionary advantage of haploidy in large yeast populations. Science 299: 555–558. [DOI] [PubMed] [Google Scholar]
- Zeyl, C., C. Curtin, K. Karnap and E. Beauchamp, 2005. Antagonism between sexual and natural selection in experimental populations of Saccharomyces cerevisiae. Evol. Int. J. Org. Evol. 59: 2109–2115. [PubMed] [Google Scholar]


