Abstract
The importance of post-transcriptional regulation by small non-coding RNAs has recently been recognized in both pro- and eukaryotes. Small RNAs (sRNAs) regulate gene expression post-transcriptionally by base pairing with the mRNA. Here we use dynamical simulations to characterize this regulation mode in comparison to transcriptional regulation mediated by protein–DNA interaction and to post-translational regulation achieved by protein–protein interaction. We show quantitatively that regulation by sRNA is advantageous when fast responses to external signals are needed, consistent with experimental data about its involvement in stress responses. Our analysis indicates that the half-life of the sRNA–mRNA complex and the ratio of their production rates determine the steady-state level of the target protein, suggesting that regulation by sRNA may provide fine-tuning of gene expression. We also describe the network of regulation by sRNA in Escherichia coli, and integrate it with the transcription regulation network, uncovering mixed regulatory circuits, such as mixed feed-forward loops. The integration of sRNAs in feed-forward loops provides tight repression, guaranteed by the combination of transcriptional and post-transcriptional regulations.
Keywords: cellular networks, network motifs, small non-coding RNA, transcriptional and post-transcriptional regulation
Introduction
Living cells are self-regulated by interactions between different molecules. Until very recently, most research has focused on transcription regulation interactions and on protein–protein interactions, which in many cases are involved in post-translational regulation. During the last years it has become evident that another type of interaction plays a prominent role in the regulation of cellular processes, manifested by small RNA (sRNA) molecules that base pair with the mRNA and regulate gene expression post-transcriptionally. This mode of regulation was found in both pro- and eukaryotes (for review see Storz et al, 2005). Although there are differences in the characteristics of the eukaryotic and prokaryotic regulatory RNAs and in the fine-details of their mechanism of action, both exert their regulatory function mostly by base pairing with the mRNA and influencing translation or mRNA stability. It is intriguing to study the properties of this type of regulatory interactions in comparison to the other types of interactions, and to understand their integration in the cellular circuitry. In this paper we focus on bacterial sRNAs, and particularly on regulatory interactions found in Escherichia coli, for which most experimental data on sRNAs are available.
At present there are about 80 known sRNAs in E. coli (for review see Gottesman, 2005; Storz et al, 2005). These molecules are 50–400 nucleotides long and many of them are evolutionary conserved (Hershberg et al, 2003), hinting to their important roles in the cellular mechanisms. Still, for many of the sRNAs, their cellular and molecular functions have not yet been determined. Many of those, for which some functional knowledge has been acquired, were often shown to act as inhibitors of translation by base pairing with the mRNA in the ribosome-binding site (for review see Gottesman, 2005). However, in E. coli there are also a couple of examples where the sRNAs play a role as translational activators, promoting ribosome binding to the mRNA by exposing its binding site (Majdalani et al, 1998, 2001; Prevost et al, 2007). In many cases the sRNA–mRNA interactions are assisted by the RNA chaperone Hfq (Valentin-Hansen et al, 2004).
The acknowledgment that post-transcriptional regulation by sRNAs is a global phenomenon has raised many interesting questions and speculations regarding their roles in the cellular regulatory networks. It was suggested that it would be cost-effective for the cell to use this mode of regulation, because these molecules are small and are not translated, and therefore the energetic cost of their synthesis is smaller in comparison to synthesis of regulatory proteins (Altuvia and Wagner, 2000). The ease of synthesis led to the suggestion that it would be beneficial for the cell to use these molecules for quick responses to environmental stresses. In this paper we describe this regulatory mechanism by dynamical simulations, and analyze quantitatively these intuitive conjectures. Furthermore, we compare the properties of post-transcriptional regulation by sRNA–mRNA base pairing to those of transcriptional regulation by protein–DNA interaction and post-translational regulation by protein–protein interaction. We show that there are measurable differences between the three regulation modes and describe the situations when regulation by sRNA is advantageous.
The interactions between molecules within the cell can be described as a network in which nodes represent genes (or their products) and edges represent the interactions between them. Recently, a considerable effort has been put in deducing the structure of these networks from experimental data, aiming at a systematic understanding of regulation mechanisms and cell function (Milo et al, 2002; Shen-Orr et al, 2002; Yeger-Lotem et al, 2004). Here we describe the network of post-transcriptional regulation by sRNAs in E. coli, where nodes represent either sRNA genes or their targets, and edges point from sRNA genes to their targets. By integrating this network with the transcription regulation network, we discover intriguing regulatory circuits involving both transcriptional regulation and post-transcriptional regulation. The different properties of transcription regulation and regulation by sRNAs have important implications in these mixed regulatory circuits. We demonstrate this by comparing analogous feed-forward loops that are either composed of transcription regulation per se or involve also regulation by sRNA.
Results and discussion
We analyze different types of regulation of gene expression mediated by three different interaction types, protein–DNA, protein–protein and sRNA–mRNA. To this end we described the regulatory mechanisms involving these interactions by mathematical models, followed by simulations, using average kinetic parameters based on experimental data (Altuvia et al, 1997; Altuvia and Wagner, 2000; Alon, 2006). We distinguished between two scenarios. In the first scenario, we assumed that the products of both the regulated gene (target) and the regulator are already present in the cell when an external signal turns on the regulation. In the second scenario, the target protein is already present when an external signal turns on the synthesis of the regulator. For both scenarios we compared the kinetics of regulation mediated by protein–DNA, protein–protein or sRNA–mRNA interaction.
We describe in some detail the modeling of regulation by sRNA. Let the sRNA transcription rate be gs (molecules/second), and the target mRNA transcription rate be gm (molecules/second). The target mRNAs are translated into proteins at a rate gp. The degradation rates are ds, dm and dp, for the sRNAs, mRNAs and proteins, respectively. The sRNA base pairs with the target mRNA at a rate α. The base pairing blocks the binding of the ribosome to the mRNA, thus negatively regulating translation. This system is described by the following rate equations:
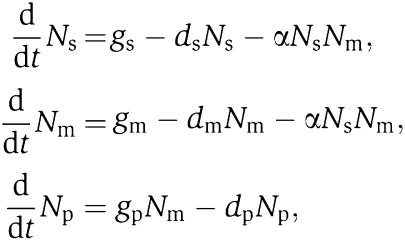 |
where Ns, Nm and Np are the number of sRNA, mRNA and protein molecules per cell, respectively. In the analysis below, these equations are solved by direct numerical integration starting from suitable initial conditions, as specified. A similar model was recently used for the analysis of regulation by the sRNA RyhB (Levine et al, 2007). Analogous equations are used in the analysis of transcriptional regulation by protein–DNA interaction and post-translational regulation by protein–protein interaction.
The parameters used in the simulations are based on experimental measurements in E. coli (Altuvia et al, 1997; Altuvia and Wagner, 2000; Alon, 2006). The transcription rate of mRNAs was taken to be gm=0.02 (molecules/second). Based on the high abundance of sRNAs, we assumed an average transcription rate of gs=1 (molecules/second), 50 times faster than that of mRNAs. The high abundance of sRNAs may be due to duplicated copies of their genes (Wilderman et al, 2004), strong promoters or high stability (Altuvia and Wagner, 2000). This difference in transcription rates is supported by experimental results obtained with oxyS (Altuvia et al, 1997). The translation rate was taken as gp=0.01 (s−1). The degradation rates for sRNAs, mRNAs and proteins were taken as ds=0.0025, dm=0.002 and dp=0.001 (s−1), respectively. The rate constants for binding of sRNA to mRNA, regulatory protein to promoter and protein to protein were all taken as α=1 (s−1/molecule). It should be noted that we ran the simulations for a range of biologically relevant parameters around these average values and obtained similar conclusions.
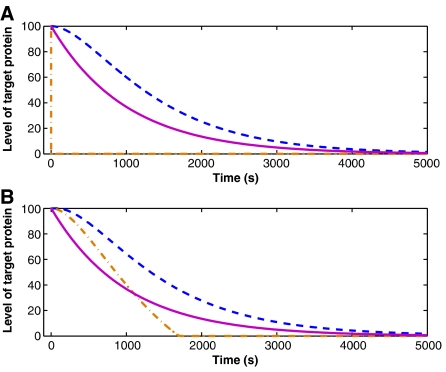
In Figure 1 we present for each regulation type the level of the target protein versus time, starting from the time at which the regulation is turned on. At time t=0, a sudden change in the external conditions turns on the regulation. In case of transcriptional regulation, the regulatory protein binds to the promoter of the target gene and represses its transcription. In case of post-translational regulation mediated by protein–protein interaction, regulator proteins bind to the target proteins and form complexes, which do not exhibit the activity of the free target proteins (they may be degraded, as in the case of E. coli σ32, which is targeted to degradation by the binding of DnaKJ proteins; Straus et al, 1990). In case of post-transcriptional regulation by sRNA, the sRNA molecules bind the transcripts of the target gene and inhibit their translation. In these simulations it is assumed that the complex of regulator and target molecules does not dissociate back to its original components (Masse et al, 2003). We discuss below the case in which such dissociation takes place, and its effects.
Figure 1.
Repression of a single gene. Shown is the level of the target protein (number of molecules) versus time: transcriptional regulation (dashed line), post-translational regulation by protein–protein interaction (dashed-dotted line) and post-transcriptional regulation by sRNA (solid line). (A) Both the regulator and the target molecules are present in the cell when the regulation is turned on in response to an external stimulus. The post-translational regulation by protein–protein interaction results in a much faster response than the two other mechanisms. (B) The target protein is present while the regulator is produced in response to an external stimulus. The response mediated by sRNA regulation is the fastest at a time interval immediately after the stimulus takes place.
The two panels in Figure 1 differ in their initial conditions. In Figure 1A both the regulator and the target are already present in the cell when the regulation is turned on due to some external stimulus. In Figure 1B the regulator is initially absent and is produced due to an external stimulus, while the target gene is expressed independent of the stimulus. The first scenario may be regarded as turning the regulator on by a conformational change exerted by the external stimulus (e.g., phosphorylation of OmpR by EnvZ under high osmolarity; Pratt et al, 1996). In the second scenario, the regulator's synthesis is turned on following the stimulus (e.g., induction of synthesis of the sRNA OxyS by OxyR under oxidative stress; Altuvia et al, 1997).
When both the regulator and the target are present in the cell, protein–protein interaction provides the fastest response to the external stimulus (Figure 1A). The regulator proteins are available to carry out the regulation and they quickly bind to the target proteins and suppress their activity. When the regulation is mediated by sRNA–mRNA base pairing, the sRNA molecules quickly bind to the mRNA molecules and prevent their translation. However, the already present target proteins are active until they degrade. As a result, the regulation by sRNA results in a slower response than that exerted by protein–protein interaction. In case of transcriptional regulation, the regulatory protein binds the promoter of the target and represses its transcription. However, the target proteins that are already present are active until they degrade. Moreover, already transcribed mRNA molecules continue to be translated into proteins until they degrade too. As a result, transcriptional regulation leads to the slowest response.
We now turn to analyze the second scenario, in which the regulator is produced in response to the external signal while the target protein is already present. In case of transcription regulation, the regulation process remains virtually the same as in Figure 1A and even slower. This is because at the time of the stimulus the regulatory protein is absent and needs to be transcribed and translated. The post-translational regulation by protein–protein interaction results in a faster response. Once the regulatory proteins are formed, they bind to the target proteins and deactivate them, regardless of the degradation times. However, in this situation, unlike the previous scenario, the regulatory proteins are not available at t=0 to carry out the regulation, and therefore the response time depends on their production rate. The response time in case of regulation by sRNA is intermediate. It consists of the time it takes to produce the sRNA molecules and the degradation time of the target proteins that remain after the sRNAs bind to their target mRNAs and suppress their translation. However, since sRNA production rate is extremely fast, the kinetics of the regulation by sRNAs in both scenarios is very similar. It is noteworthy that shortly after the regulation is turned on, no mRNA molecules of the regulatory proteins are present. Thus, the initial production rate of regulatory proteins is much lower than that of sRNAs. As a result, shortly after t=0, regulation by sRNA exerts a faster response than regulation by protein–protein interaction. Hence, when the regulator is not present in the cell and a fast response is needed in a short time interval, such as upon an external stress, regulation by sRNA has an advantage over the two other regulation types. Indeed, several of the sRNAs with known functions play a role in response to sudden changes in environmental conditions (Altuvia and Wagner, 2000). These include OxyS that is induced in response to oxidative stress and regulates ∼40 genes, as suggested by genetic screens (Altuvia et al, 1997), and RyhB that is induced in response to iron depletion and regulates genes involved in iron metabolism (Masse et al, 2007).
Another difference between the various regulation mechanisms is considered below. In case of transcriptional regulation, a single bound repressor is sufficient to shutdown the expression of the target gene. In this case, the regulation effectiveness does not depend on the transcription rate of the target gene. It depends only on the production rate of the regulatory protein and on its binding/dissociation rates to the promoter of the target. Thus, with suitable binding/dissociation rates, transcriptional regulation enables using a protein of low concentration to regulate a protein of high concentration. In case of protein–protein interaction, the regulation effectiveness is determined by the relative production rates of the regulator and target proteins. If the production rate of the regulatory protein is faster than that of the target protein, the regulation will be very effective. On the other hand, when the production rates of these two proteins are comparable, it enables fine-tuning of the regulation strength, which is not possible in transcriptional regulation.
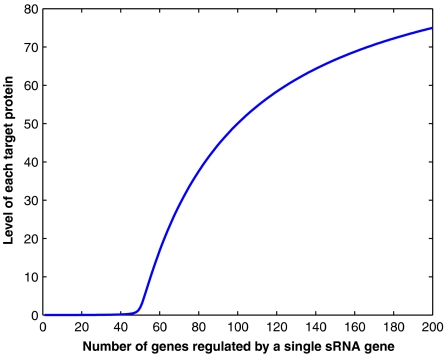
A similar property characterizes regulation by sRNA. The regulation effectiveness strongly depends on the relative production rates of the sRNA and the target mRNA. Since the rate of production of sRNAs is up to two orders of magnitude faster than of typical mRNAs, it enables effective regulation. It also enables a single sRNA-encoding gene to regulate dozens of other genes. As long as the sRNA is produced at a faster rate than the combined production rate of all the target mRNAs, the regulation is strong. It gradually weakens when the combined production rate of the target mRNAs exceeds that of the sRNA. As an example, we consider an sRNA-encoding gene that regulates n other genes. In this case, the rate equations shown above are modified such that the second and third equations are copied into n equations, accounting for the number of sRNA molecules and the number of protein molecules of each of the n target genes. In addition, the first equation is modified such that Nm is replaced by the total number of mRNA molecules of all the target genes. For simplicity, the parameter values of all the target genes are taken to be identical. In Figure 2 we present the number of molecules of each of the target proteins versus n. In this example, when n exceeds 50, the regulation weakens and the number of molecules of each target protein increases. Indeed, there are a few examples where a single sRNA-encoding gene regulates several genes involved in the same physiological process, hinting for the existence of sRNA regulons in accord with the regulons governed by transcriptional regulatory proteins (Altuvia, 2004). Our results suggest that for appropriate relations between the production rates of the regulator sRNA and its target genes in the regulon, the simultaneous regulation of these genes will be very effective. The applicable parameter range for production rates of sRNA and mRNA in E. coli suggests that in order to be effective, such a regulon should contain only several dozens of genes. In general, the targets may differ from each other in their transcription and translation rates, as well as in their affinities to the sRNA. These differences may provide a hierarchy of regulation.
Figure 2.
A single sRNA-encoding gene may be responsible for the regulation of many genes. Shown is the protein level (number of molecules) of each of the n target genes regulated by a single sRNA-encoding gene. Here, the production of the sRNA is 50 times faster than that of each of the target mRNAs. In this case, as long as n<50, the regulation is effective. It gradually weakens as n exceeds 50, and the level of each of the target proteins increases.
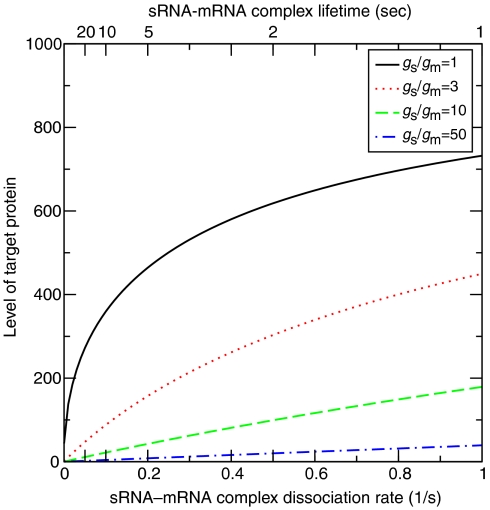
Kinetic studies indicated that the sRNA–mRNA complexes might dissociate back into their original components (Argaman and Altuvia, 2000; Wagner et al, 2002), with dissociation rates γ in the range between 0.02 and 0.1 s−1, which is much faster than the degradation rate of the complex. To address this additional scenario, we added one more equation to the model, which accounts for the copy number Nx of the complex. This equation takes the form dNx/dt=αNsNm−(dx+γ)Nx, where dx is the degradation rate of the complex. For simplicity, we chose the degradation rate of the complex to be equal to that of the free mRNA molecule, namely dx=dm. In addition, we added the term +γNx to the equations that describe the time derivatives of Ns and Nm. As the dissociation rate increases, the regulation effectiveness is reduced. As a result, there are more mRNA molecules available for translation into proteins, and the protein level increases. In Figure 3 we present the number of the target protein molecules Np versus the dissociation rate of the complex γ for four different values of the ratio between the production rates of the sRNA and target mRNA, gs/gm. When sRNAs are produced much faster than mRNAs, there is a large surplus of sRNAs and the regulation remains strong even when dissociation takes place. However, when the sRNA production rate is close to that of the mRNA, even small dissociation rates significantly weaken the regulation and the protein level increases. Delicate control of the dissociation rate enables fine-tuning and maintenance of the target protein level at a desired steady-state level.
Figure 3.
Effect of sRNA–mRNA dissociation. Shown is the target protein level (number of molecules) versus the dissociation rate of the sRNA–mRNA complex. Four different ratios of sRNA to mRNA production rates (gs/gm) were considered. When the ratio is high, the regulation remains effective even when dissociation takes place. However, when the ratio is low, dissociation significantly reduces the effectiveness of the regulation.
Another post-transcriptional regulation mechanism is manifested by mRNA-binding proteins (or metabolites). The rate equations describing this kind of regulation are similar to those describing regulation by sRNA. However, unlike sRNAs, the regulatory proteins do not degrade together with the mRNA. As a result, a smaller copy number of regulatory proteins are sufficient in order to provide strong negative regulation at steady state. However, the transient dynamics of this type of regulation is the same as shown in Figure 1 for regulation by sRNAs.
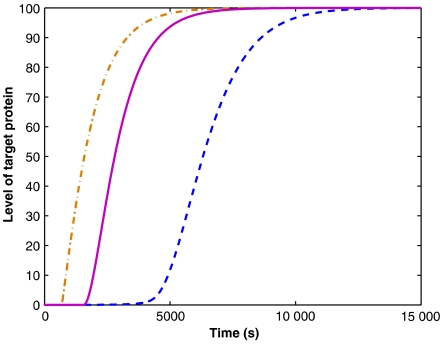
We now consider the recovery of the target gene after the transcription of the regulator is turned off. For concreteness, we focus on regulation by sRNAs, where a single target gene is regulated. We assume that the binding of the sRNA to mRNA is fast, and that the sRNA–mRNA complex does not dissociate. In this analysis, the initial copy number of sRNAs is given by the steady-state result of the rate equation, namely Ns=(gs−gm)/ds. It then decreases according to dNs/dt=−dsNs−gm, giving rise to Ns(t)=(gse−dst−gm)/ds. The translation of the target proteins will resume when all the sRNA molecules are removed at time t=ln(gs/gm)/ds, denoted as the recovery time. Our simulations show that for the same parameters as in Figure 1 the recovery time in case of regulation by sRNA is faster than in the case of transcriptional regulation, but somewhat slower than for protein-protein interaction (Figure 4). Clearly, when the regulation is mediated by sRNA, two parameters determine the recovery time: (1) the ratio between the production rates of the regulatory sRNA and target mRNA; and (2) the degradation rate of the sRNA. The latter has a greater influence on the determination of the recovery time. For example, the recovery time can be made equal to that of transcriptional regulation by either increasing the ratio gs/gm by a factor of 5000 or by decreasing the degradation rate of the sRNA by a factor of 3. When the regulatory protein loses its activity without degradation (e.g., by phosphorylation/dephosphorylation), no differences in the kinetics of recovery were observed for the various regulation modes.
Figure 4.
Recovery of the target gene after the regulation is turned off. Shown is the level of the target protein (number of molecules) versus time: transcriptional regulation (dashed line), post-translational regulation by protein–protein interaction (dashed-dotted line) and post-transcriptional regulation by sRNA (solid line). When using the same parameters as in Figure 1, the recovery time in case of regulation by sRNA is faster than in case of transcriptional regulation, but somewhat slower than for protein–protein interaction. However, the recovery time depends strongly on the degradation rate of the sRNAs, and more weakly on the ratio gs/gm. Changing these parameters can result in a recovery time that is longer than the recovery time in case of transcriptional regulation.
Network view of sRNA–target interactions
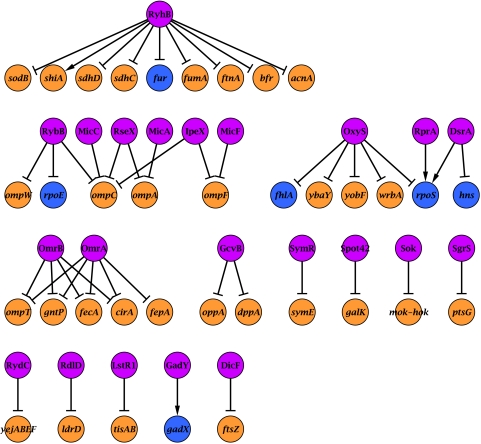
To establish the framework of our analysis, we described and analyzed in the previous section regulation of a gene as an isolated event. However, regulation of gene expression in response to external stimuli is often achieved by more complex regulatory patterns, involving various types of regulatory interactions. In recent years the transcription regulation networks and protein–protein interaction networks were analyzed in an attempt to identify and characterize such regulatory patterns (Milo et al, 2002; Shen-Orr et al, 2002; Mangan and Alon, 2003; Yeger-Lotem et al, 2004; Zhang et al, 2005). Likewise, it is interesting to examine the network of post-transcriptional regulation by sRNAs and study its structure. We compiled from the literature and from the NPInter database (Wu et al, 2006) regulatory interactions between sRNAs and targets based on experimental evidence (Figure 5; Supplementary information), resulting in a network of 47 interactions. Some of these interactions were shown to be direct by binding experiments or compensatory mutations (e.g., Argaman and Altuvia, 2000; Moller et al, 2002). Some interactions lack such evidence and therefore may be indirect. The sRNA regulatory network shows characteristics that are similar to those of other networks. For example, there are hubs in the network, both of an sRNA that regulates several genes (e.g., RyhB) and of a gene that is regulated by several sRNAs (e.g., ompC), and there is also a Dense-Overlapping-Regulon (OmrA and OmrB), as found in the transcription regulation network (Shen-Orr et al, 2002).
Figure 5.
The sRNA–target network. Nodes represent sRNAs and their targets (see Supplementary information for references). sRNAs are in pink, protein-coding genes in orange and genes encoding transcriptional regulators in blue. Arrows represent activation while truncated arrows represent inhibition.
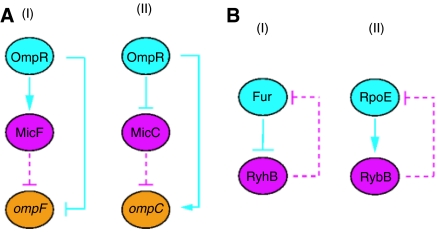
We next integrated the post-transcriptional regulatory network by sRNAs with the transcription regulatory network, in search of mixed regulatory patterns involving the two modes of regulation. For this analysis we used the transcription regulation network based on RegulonDB (Salgado et al, 2006) and on the literature, including 2861 regulatory interactions. Transcription regulation interactions between regulatory proteins and sRNA genes, either direct or indirect, were compiled from the literature (Supplementary information). Since at present the network of regulation by sRNAs is very limited, it is too early to examine the statistical significance of various mixed regulatory circuits in the integrated network, as done earlier for other integrated networks (Yeger-Lotem et al, 2004). Instead, we looked for mixed regulatory circuits of biological meaning (Figure 6) and analyzed their kinetics. Two interesting examples of mixed feed-forward loops regard the outer membrane porins, the small pore porin OmpC and the larger pore porin OmpF (Figure 6A). Under high osmolarity two feed-forward loops involving both transcriptional and post-transcriptional regulation cause OmpC to predominate, thus limiting the entry of toxic compounds (reviewed in Guillier et al, 2006). Other interesting regulatory circuits in the integrated network involve mixed feedback loops (Figure 6B). These examples demonstrate mixed regulatory circuits in various cellular contexts. With more experimentally verified sRNA–target interactions even richer and more complex mixed patterns may be revealed.
Figure 6.
Examples of mixed regulatory circuits involving transcriptional regulation and post-transcriptional regulation by sRNA. (A) Feed-forward loop. Under high osmolarity, OmpR activates transcription of the sRNA gene micF, which represses the translation of the porin-coding gene ompF. OmpR also inhibits directly the transcription of ompF. Under the same conditions, OmpR represses (either directly or indirectly) the transcription of the sRNA gene micC, which inhibits the translation of the porin-coding gene ompC. OmpR also activates directly the transcription of ompC. (B) Mixed negative feedback loop. The repressor Fur inhibits the transcription of the sRNA gene ryhB, which in turn inhibits Fur's translation. RpoE activates the transcription of the sRNA gene rybB, which in turn represses RpoE synthesis. Colors and arrows are as in Figure 5. Dashed lines represent regulation by sRNA and solid lines represent transcription regulation.
Mixed feed-forward loops
As described above for isolated regulatory interactions, it is intriguing to understand the mechanistic differences between a feed-forward loop that contains both transcriptional regulation and post-transcriptional regulation by sRNA, and one that involves only transcriptional regulation. In the analysis below we focus on one type of feed-forward loop shown in Figure 7, where both paths lead to the repression of the target gene.
Figure 7.
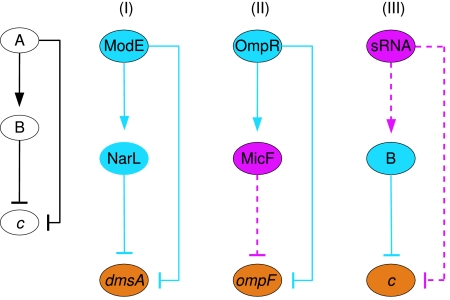
Coherent feed-forward loops. General scheme (left hand side) and specific examples of (I) transcriptional regulation and (II–III) two different combinations of transcriptional regulation and post-transcriptional regulation by sRNA. Colors and arrows are as in Figure 5. Dashed lines represent regulation by sRNA and solid lines represent transcription regulation.
A feed-forward loop consists of gene a, whose product A regulates gene c both directly and indirectly through a B regulator encoded by gene b. This module was shown to be superior to direct regulation alone in both regulation efficiency and tolerance to noise (Mangan and Alon, 2003; Mangan et al, 2003, 2006). Several versions of the feed-forward loop were described, including coherent circuits in which the two regulation paths are both positive or both negative, as well as incoherent circuits in which one of them is positive and the other is negative. The circuit analyzed here is a coherent circuit in which in both paths gene c is negatively regulated.
The standard feed-forward loop of this type consists only of transcriptional regulations (circuit I in Figure 7). In this circuit, the A protein represses the transcription of gene c. Protein A also activates the expression of gene b, whose product B, in turn, negatively regulates the transcription of gene c. This feed-forward loop was described before by Mangan and Alon (2003), and was termed coherent feed-forward loop type 3. In a typical state of this circuit, gene a is inactive while gene c is expressed. When an external stimulus activates gene a, the expression of gene c is repressed. During this process an A protein binds to the promoter of gene c. Shortly later, a B protein, whose transcription has been activated by A, may also bind to the promoter of gene c. The exact function of the circuit depends on the structure and logical operation of the promoter of gene c. The promoter may operate as an OR gate in which it is sufficient that either an A or a B protein is bound in order to repress the expression of c. Another possibility is an AND gate in which both A and B should bind simultaneously in order to obtain the negative regulation. We identified several instances of such feed-forward loops in the network of E. coli, most of which involve genes that participate in anaerobic respiration (one example is demonstrated in Figure 7, circuit I).
Regulation by sRNA provides further variation to this type of feed-forward loop. One possibility is that gene b encodes an sRNA that negatively regulates gene c (circuit II in Figure 7), as manifested by OmpR-MicF-ompF. Another variation of this feed-forward loop is possible when gene a encodes an sRNA that positively regulates gene b and negatively regulates gene c (circuit III in Figure 7). Since there are examples of positive translation regulation by sRNA (Majdalani et al, 1998, 2001; Prevost et al, 2007), this feed-forward loop is theoretically possible. However, a particular circuit of this form has not yet been identified in actual regulatory networks.
A special property of both feed-forward loops that involve sRNAs is that the negative regulation of gene c is carried out simultaneously at two different levels, transcriptional and post-transcriptional. For example, in circuit II of Figure 7, OmpR represses the transcription of ompF, while MicF inhibits its translation. This combination provides strict control on the expression of ompF, so that any leakage at the transcriptional level is blocked post-transcriptionally. This strict control is consistent with the biological context of this circuit. Under high osmolarity, such as in an environment inside the host, it is important to block the porin OmpF, which enables passage of relatively large compounds, and thus to prevent the entry of toxic compounds. The incorporation of regulation by sRNA in this circuit enables simultaneous regulation of the target gene at both transcriptional and translational levels, leading to a more assured inhibition of ompF.
Implicitly, the mixed feed-forward loop that includes sRNA (circuits II and III in Figure 7) forms an OR gate, and therefore we compare it to a transcriptional feed-forward loop with an OR gate. In such a circuit, regulation of gene c is initiated through the direct shorter path, whereas the indirect longer path affects gene c at a later time. Therefore, the effect of gene a on gene c repression is similar to that shown in Figure 1, fastest for circuit III and equivalent for circuits I and II. The recovery time, however, depends on the longer path. For a broad range of parameters where the degradation of the sRNA is sufficiently fast, circuit III, in which sRNA is involved in both regulation pathways, exhibits the fastest recovery. In circuits I and II, in which A is a transcriptional regulator, the differences in recovery time are determined by the downstream regulator B. In circuit I it is a transcriptional regulator and in circuit II it is an sRNA. Therefore, the difference in their recovery times is similar to that shown in Figure 4. Here again, fast sRNA degradation assures a faster recovery. Thus, involvement of sRNA in this type of feed-forward loop not just guarantees a tighter regulation, but might also provide a faster recovery after the external stimulus has ended.
Our analysis may be extended to other types of feed-forward loops and other types of regulatory modules, some of which have already been identified in both pro- and eukaryotes. One example of the Fur-RyhB negative mixed feedback loop in E. coli is demonstrated in Figure 6B. Another example from human involves miR223 and the transcription factor NFI-A, which form a mixed negative feedback loop that was shown to play a role in human granulopoiesis (Fazi et al, 2005). Like in the Fur-RyhB example, in this feedback loop the transcription factor represses the transcription of the miRNA gene, and the miRNA in turn inhibits the translation of the transcription factor. This module belongs to a large class of circuits in which two genes mutually regulate each other. This class includes the toggle switch, which includes transcriptional regulation (Lipshtat et al, 2006), and the mixed feedback loop that combines transcriptional regulation and post-translational regulation by protein-protein interactions (Francois and Hakim, 2005). This family of circuits may exhibit bistability when both regulations are negative, and oscillations when negative regulation applies in one direction and positive regulation in the opposite direction (Lahav et al, 2004). Analysis of several mixed feedback loops with post-transcriptional regulation by sRNA shows that they typically exhibit neither bistability nor oscillations, unlike those that involve transcriptional regulation per se or transcriptional regulation and post-translational regulation by protein–protein interactions (manuscript in preparation).
Conclusions
Previous studies speculated that non-coding RNAs would provide an efficient mode of regulation (Guillier et al, 2006), which is manifested by fast responses of the target gene to an external stimulus, and also by fast recovery after removal of the stimulus. Our mathematical modeling and simulations support these conjectures for a wide range of parameters, and provide additional insights. When considering only transcription regulation by regulatory proteins and post-transcriptional regulation by sRNAs, it is evident from Figure 1 that regulation by sRNA leads to a faster response. When adding the possibility of post-translational regulation by protein–protein interaction, we observe two distinct phenomena; in case the regulator is present in the cell when the regulation is turned on, protein–protein interaction results in the fastest response, as it acts directly on the target proteins and decreases their levels (Figure 1A). However, when the regulator is produced in response to the stimulus, there is a time range when the sRNA exerts the fastest response (Figure 1B). This stems from its relatively fast production relative to protein production. Thus, for stimuli that require fast responses in a short time interval, regulation by sRNA may be advantageous, as, for example, under transient stress conditions.
The effectiveness of the regulation by sRNA depends on its production rate relative to the production rates of the target mRNAs. Appropriate relations between these two values may allow a single sRNA-encoding gene to regulate many genes, as has indeed been observed experimentally (e.g., Altuvia et al, 1997; Masse et al, 2005). By taking into account the valid range of these parameters in E. coli, we may conclude that such a simultaneous regulation will be effective for only a few dozens of genes (Figure 2). Dissociation of the sRNA–mRNA complex reduces the regulation effectiveness, and enables fine-tuning of the target mRNA level, and thus the protein level (Figure 3).
Despite the small number of known targets of sRNAs in E. coli, our integrative analysis of the transcriptional and post-transcriptional regulation networks has identified mixed regulatory circuits involving combinations of the two levels of regulation. Particularly interesting are the mixed feed-forward loops. These feed-forward loops comprise both a repressor and an sRNA (both regulating the same target), and thus provide a means to guarantee the shutdown of the target gene (Figure 7). Even if some transcripts are produced despite the transcription repression, the sRNA will block their translation. Such feed-forward loops suit conditions where it is crucial to completely abolish expression of a gene, as in the case of ompF under high osmolarity (circuit II in Figure 7). At the same time, compared with the equivalent transcriptional feed-forward loop (circuit I in Figure 7), this circuit may lead to faster recovery upon the deactivation of the repressor, another important advantage in changing environments.
While transcription regulation involves recognition between amino acids and bases, and protein interaction is determined by recognition between amino acids, regulation by sRNAs involves, in many of the studied cases, base pairing with the mRNA of the target gene. Hence, at least intuitively, it seems that evolutionary design of sRNAs that will regulate target genes by base pairing should be simpler than the evolution of the other regulatory molecules (Eddy, 2001). This evolutionary advantage of sRNAs along with their other properties, implied by the above simulations, may suggest why these molecules are so widespread in all kingdoms of life.
Materials and methods
The analyses were carried out using rate equation models. These equations account for the concentration (average number of molecules per cell) of each component in the circuit, namely mRNA and sRNA molecules, free proteins and proteins that are bound to the promoter site. The model consists of a set of coupled ordinary differential equations, each equation evaluates the time derivative of the concentration of one type of molecule.
The model is based on several assumptions made in order to simplify the equations and their analysis. One assumption is that the binding rates of pairs of molecules are diffusion-limited. The transcription rate constants gm and gs incorporate all the molecular processes involved in the transcription of the mRNA and sRNA molecules, respectively. The simulation is Markovian, in the sense that it does not include any time delays. A similar assumption regards the translation rates.
The sRNA network in Figure 5 was generated using Cytoscape software 2.4.0 (Shannon et al, 2003).
Supplementary Material
Supplementary Information
Supplementary Information
Acknowledgments
This work was supported by a grant from the Center for Complexity Science founded by the Horowitz Association (granted to HM, SA and OB), by the Israeli Ministry of Science Grant 3/2559 and by BACRNA, a Specific Targeted Research Project supported by European Union's FP6 Life Science, Genomics and Biotechnology for Health, LSHM-CT-2005-018618 (granted to SA and HM), and by grants from the Israeli Cancer Research Foundation and the Binational US-Israel Science Foundation (granted to HM).
References
- Alon U (2006) Introduction to Systems Biology. London: Chapman & Hall/CRC [Google Scholar]
- Altuvia S (2004) Regulatory small RNAs: the key to coordinating global regulatory circuits. J Bacteriol 186: 6679–6680 [DOI] [PMC free article] [PubMed] [Google Scholar]
- Altuvia S, Wagner EG (2000) Switching on and off with RNA. Proc Natl Acad Sci USA 97: 9824–9826 [DOI] [PMC free article] [PubMed] [Google Scholar]
- Altuvia S, Weinstein-Fischer D, Zhang A, Postow L, Storz G (1997) A small, stable RNA induced by oxidative stress: role as a pleiotropic regulator and antimutator. Cell 90: 43–53 [DOI] [PubMed] [Google Scholar]
- Argaman L, Altuvia S (2000) FhlA repression by OxyS RNA: kissing complex formation at two sites results in a stable antisense–target RNA complex. J Mol Biol 300: 1101–1112 [DOI] [PubMed] [Google Scholar]
- Eddy SR (2001) Non-coding RNA genes and the modern RNA world. Nat Rev Genet 2: 919–929 [DOI] [PubMed] [Google Scholar]
- Fazi F, Rosa A, Fatica A, Gelmetti V, De Marchis ML, Nervi C, Bozzoni I (2005) A minicircuitry comprised of microRNA-223 and transcription factors NFI-A and C/EBPalpha regulates human granulopoiesis. Cell 123: 819–831 [DOI] [PubMed] [Google Scholar]
- Francois P, Hakim V (2005) Core genetic module: the mixed feedback loop. Phys Rev E Stat Nonlin Soft Matter Phys 72: 031908. [DOI] [PubMed] [Google Scholar]
- Gottesman S (2005) Micros for microbes: non-coding regulatory RNAs in bacteria. Trends Genet 21: 399–404 [DOI] [PubMed] [Google Scholar]
- Guillier M, Gottesman S, Storz G (2006) Modulating the outer membrane with small RNAs. Genes Dev 20: 2338–2348 [DOI] [PubMed] [Google Scholar]
- Hershberg R, Altuvia S, Margalit H (2003) A survey of small RNA-encoding genes in Escherichia coli. Nucleic Acids Res 31: 1813–1820 [DOI] [PMC free article] [PubMed] [Google Scholar]
- Lahav G, Rosenfeld N, Sigal A, Geva-Zatorsky N, Levine AJ, Elowitz MB, Alon U (2004) Dynamics of the p53-Mdm2 feedback loop in individual cells. Nat Genet 36: 147–150 [DOI] [PubMed] [Google Scholar]
- Levine E, Zhang Z, Kuhlman T, Hwa T (2007) Quantitative characteristics of gene regulation by small RNA. PLoS Biol 5: e229. [DOI] [PMC free article] [PubMed] [Google Scholar]
- Lipshtat A, Loinger A, Balaban NQ, Biham O (2006) Genetic toggle switch without cooperative binding. Phys Rev Lett 96: 188101. [DOI] [PubMed] [Google Scholar]
- Majdalani N, Chen S, Murrow J, St John K, Gottesman S (2001) Regulation of RpoS by a novel small RNA: the characterization of RprA. Mol Microbiol 39: 1382–1394 [DOI] [PubMed] [Google Scholar]
- Majdalani N, Cunning C, Sledjeski D, Elliott T, Gottesman S (1998) DsrA RNA regulates translation of RpoS message by an anti-antisense mechanism, independent of its action as an antisilencer of transcription. Proc Natl Acad Sci USA 95: 12462–12467 [DOI] [PMC free article] [PubMed] [Google Scholar]
- Mangan S, Alon U (2003) Structure and function of the feed-forward loop network motif. Proc Natl Acad Sci USA 100: 11980–11985 [DOI] [PMC free article] [PubMed] [Google Scholar]
- Mangan S, Itzkovitz S, Zaslaver A, Alon U (2006) The incoherent feed-forward loop accelerates the response-time of the gal system of Escherichia coli. J Mol Biol 356: 1073–1081 [DOI] [PubMed] [Google Scholar]
- Mangan S, Zaslaver A, Alon U (2003) The coherent feedforward loop serves as a sign-sensitive delay element in transcription networks. J Mol Biol 334: 197–204 [DOI] [PubMed] [Google Scholar]
- Masse E, Escorcia FE, Gottesman S (2003) Coupled degradation of a small regulatory RNA and its mRNA targets in Escherichia coli. Genes Dev 17: 2374–2383 [DOI] [PMC free article] [PubMed] [Google Scholar]
- Masse E, Salvail H, Desnoyers G, Arguin M (2007) Small RNAs controlling iron metabolism. Curr Opin Microbiol 10: 140–145 [DOI] [PubMed] [Google Scholar]
- Masse E, Vanderpool CK, Gottesman S (2005) Effect of RyhB small RNA on global iron use in Escherichia coli. J Bacteriol 187: 6962–6971 [DOI] [PMC free article] [PubMed] [Google Scholar]
- Milo R, Shen-Orr S, Itzkovitz S, Kashtan N, Chklovskii D, Alon U (2002) Network motifs: simple building blocks of complex networks. Science 298: 824–827 [DOI] [PubMed] [Google Scholar]
- Moller T, Franch T, Udesen C, Gerdes K, Valentin-Hansen P (2002) Spot 42 RNA mediates discoordinate expression of the E. coli galactose operon. Genes Dev 16: 1696–1706 [DOI] [PMC free article] [PubMed] [Google Scholar]
- Pratt LA, Hsing W, Gibson KE, Silhavy TJ (1996) From acids to osmZ: multiple factors influence synthesis of the OmpF and OmpC porins in Escherichia coli. Mol Microbiol 20: 911–917 [DOI] [PubMed] [Google Scholar]
- Prevost K, Salvail H, Desnoyers G, Jacques JF, Phaneuf E, Masse E (2007) The small RNA RyhB activates the translation of shiA mRNA encoding a permease of shikimate, a compound involved in siderophore synthesis. Mol Microbiol 64: 1260–1273 [DOI] [PubMed] [Google Scholar]
- Salgado H, Gama-Castro S, Peralta-Gil M, Díaz-Peredo E, Sánchez-Solano F, Santos-Zavaleta A, Martínez-Flores I, Jiménez-Jacinto V, Bonavides-Martínez C, Segura-Salazar J, Martínez-Antonio A, Collado-Vides J (2006) RegulonDB (version 5.0): Escherichia coli K-12 transcriptional regulatory network, operon organization, and growth conditions. Nucleic Acids Res 34: D394–D397 [DOI] [PMC free article] [PubMed] [Google Scholar]
- Shannon P, Markiel A, Ozier O, Baliga NS, Wang JT, Ramage D, Amin N, Schwikowski B, Ideker T (2003) Cytoscape: a software environment for integrated models of biomolecular interaction networks. Genome Res 13: 2498–2504 [DOI] [PMC free article] [PubMed] [Google Scholar]
- Shen-Orr SS, Milo R, Mangan S, Alon U (2002) Network motifs in the transcriptional regulation network of Escherichia coli. Nat Genet 31: 64–68 [DOI] [PubMed] [Google Scholar]
- Storz G, Altuvia S, Wassarman KM (2005) An abundance of RNA regulators. Annu Rev Biochem 74: 199–217 [DOI] [PubMed] [Google Scholar]
- Straus D, Walter W, Gross CA (1990) DnaK, DnaJ, and GrpE heat shock proteins negatively regulate heat shock gene expression by controlling the synthesis and stability of sigma 32. Genes Dev 4: 2202–2209 [DOI] [PubMed] [Google Scholar]
- Valentin-Hansen P, Eriksen M, Udesen C (2004) The bacterial Sm-like protein Hfq: a key player in RNA transactions. Mol Microbiol 51: 1525–1533 [DOI] [PubMed] [Google Scholar]
- Wagner EG, Altuvia S, Romby P (2002) Antisense RNAs in bacteria and their genetic elements. Adv Genet 46: 361–398 [DOI] [PubMed] [Google Scholar]
- Wilderman PJ, Sowa NA, FitzGerald DJ, FitzGerald PC, Gottesman S, Ochsner UA, Vasil ML (2004) Identification of tandem duplicate regulatory small RNAs in Pseudomonas aeruginosa involved in iron homeostasis. Proc Natl Acad Sci USA 101: 9792–9797 [DOI] [PMC free article] [PubMed] [Google Scholar]
- Wu T, Wang J, Liu C, Zhang Y, Shi B, Zhu X, Zhang Z, Skogerbø G, Chen L, Lu H, Zhao Y, Chen R (2006) NPInter: the noncoding RNAs and protein related biomacromolecules interaction database. Nucleic Acids Res 34: D150–D152 [DOI] [PMC free article] [PubMed] [Google Scholar]
- Yeger-Lotem E, Sattath S, Kashtan N, Itzkovitz S, Milo R, Pinter RY, Alon U, Margalit H (2004) Network motifs in integrated cellular networks of transcription-regulation and protein–protein interaction. Proc Natl Acad Sci USA 101: 5934–5939 [DOI] [PMC free article] [PubMed] [Google Scholar]
- Zhang LV, King OD, Wong SL, Goldberg DS, Tong AH, Lesage G, Andrews B, Bussey H, Boone C, Roth FP (2005) Motifs, themes and thematic maps of an integrated Saccharomyces cerevisiae interaction network. J Biol 4: 6. [DOI] [PMC free article] [PubMed] [Google Scholar]
Associated Data
This section collects any data citations, data availability statements, or supplementary materials included in this article.
Supplementary Materials
Supplementary Information
Supplementary Information


