

Abstract
Neurofilament proteins are known to be transported along axons by slow axonal transport, but the form in which they move is controversial. In previous studies on cultured rat sympathetic neurons, we found that green fluorescent protein-tagged neurofilament proteins move predominantly in the form of filamentous structures, and we proposed that these structures are single-neurofilament polymers. In the present study, we have tested this hypothesis by using a rapid perfusion technique to capture these structures as they move through naturally occurring gaps in the axonal neurofilament array. Because the gaps lack neurofilaments, they permit unambiguous identification of the captured structure. Using quantitative immunofluorescence microscopy and correlative light and electron microscopy, we show that the captured structures are single continuous neurofilament polymers. Thus, neurofilament polymers are one of the cargo structures of slow axonal transport.
Keywords: axonal transport (axoplasmic transport), cytoskeleton, neurofilament, ultrastructure, live-cell imaging, fluorescence microscopy
Introduction
Cytoskeletal and cytosolic proteins move along axons in the slow components of axonal transport, but the mechanism of movement is not well understood and has been debated for almost three decades (Baas and Brown, 1997; Hirokawa et al., 1997; Nixon, 1998; Shah and Cleveland, 2002). Recent studies on the movement of green fluorescent protein (GFP)-tagged neurofilament proteins in cultured neurons have demonstrated that these proteins actually move at fast rates and that the movements are also intermittent and bidirectional (Yabe et al., 1999; Roy et al., 2000; Wang et al., 2000; Wang and Brown, 2001; Helfand et al., 2003). These observations suggest that the slow rate of neurofilament transport is actually an average of rapid bidirectional movements interrupted by prolonged pauses (Shah and Cleveland, 2002; Brown, 2003b), an idea that we have termed the “stop and go” hypothesis (Brown, 2000).
The idea that neurofilament proteins move along axons in a rapid intermittent manner is now generally accepted, but the form in which they move remains controversial. This controversy has been fueled by apparently conflicting reports in the literature. In one of the first studies to address this issue, an epitope-tagged neurofilament protein was expressed in neurons of transgenic mice lacking axonal neurofilaments, and this exogenous protein was observed to move into the axons, suggesting that neurofilament proteins can be transported in an unpolymerized form (Terada et al., 1996). In support of this idea, studies on cultured neuronal cell lines have reported the movement of GFP-tagged neurofilament protein and peripherin in the form of punctate nonfilamentous structures (Yabe et al., 1999; Helfand et al., 2003). More recently, GFP-tagged neurofilament protein has also been reported to move in a predominantly punctate form in chick DRG neurons (Theiss et al., 2005). In contrast, studies on cultured rat sympathetic and cortical neurons by ourselves and others have reported that GFP-tagged neurofilament proteins move in a predominantly filamentous form (Roy et al., 2000; Wang et al., 2000; Wang and Brown, 2001; Ackerley et al., 2003; Uchida and Brown, 2004). In squid, one study has described the movement of fluorescently labeled neurofilament protein in giant axons and concluded that neurofilament protein is transported as assembled polymers (Galbraith et al., 1999), whereas another study has described the movement of punctate structures containing neurofilament protein in extruded axoplasm and concluded that neurofilament protein is transported in an unassembled form (Prahlad et al., 2000).
We have suggested that the GFP-tagged filamentous structures that move in cultured neurons are assembled neurofilament polymers. However, Hirokawa and colleagues have argued that they are not (Terada and Hirokawa, 2000; Terada, 2003). The principal reason for the persistence of this controversy is the limited resolution of fluorescence microscopy, which has precluded unambiguous identification of the moving structures. To resolve this issue, we sought to devise a definitive test of the hypothesis that these moving structures are indeed single neurofilament polymers. This proved to be challenging because the movement is both rapid and infrequent. To circumvent this problem, we took advantage of the existence of naturally occurring gaps in the axonal neurofilament array of cultured rat sympathetic neurons (Wang et al., 2000). Because these gaps lack neurofilaments, they are the only place in the axon where moving filaments can be observed in isolation. Our strategy has been to observe a filament entering a gap and then capture it, before it exits, by rapidly permeabilizing the axon. Using quantitative immunofluorescence microscopy and correlative light and electron microscopy, we show that the captured filaments are indeed single neurofilament polymers.
Materials and Methods
Cell culture. Neurons dissociated from superior cervical ganglia of neonatal (postnatal day 0-1) rats were cultured at low density (0.002 dissociated ganglia per mm2) on glass coverslips coated with poly-d-lysine and Matrigel (BD Biosciences, Franklin Lakes, NJ) and maintained at 37°C in Leibovitz's L-15 medium (phenol red-free; Invitrogen, San Diego, CA) supplemented with glucose, l-glutamine, nerve growth factor (BD Biosciences), adult rat serum (Harlan Bioproducts, Indianapolis, IN), and hydroxypropylmethylcellulose (Methocel; Dow Corning, Corning, NY) as described by Brown (2003a).
Transfection. The GFP-NFM expression vector, which directs the expression of the F64L/S65T variant of green fluorescent protein (Clontech, Cambridge, UK) linked to the N terminus of rat neurofilament protein M, has been described previously (Wang et al., 2000). The purified plasmid (600 μg/ml in 50 mm potassium glutamate, pH 7.0) was injected directly into the nucleus of cultured neurons 2 d after plating using an Eppendorf Scientific (Westbury, NY) InjectMan NI2 micromanipulator and FemtoJet microinjector (Brinkman Instruments, Westbury, NY) as described by Brown (2003a). Micropipettes were pulled from standard thick-wall borosilicate glass tubing (World Precision Instruments, Sarasota, FL) using a P-97 Flaming-Brown pipette puller (Sutter Instruments, Novato, CA). In all experiments, the plasmid was coinjected with 1.25 mg/ml tetramethylrhodamine dextran [molecular weight (Mw), 10,000; Sigma, St. Louis, MO] to allow visual confirmation of the injection procedure.
Live-cell imaging. For live-cell imaging, coverslips were mounted in an RC-21B closed bath imaging and perfusion chamber (Warner Instruments, Hamden, CT) using silicone grease (compound 111; Dow Corning) as the sealant. The imaging medium consisted of culture medium lacking Methocel (Methocel increased the resistance to flow during perfusion). To minimize photobleaching and photodamage during imaging, the medium was depleted of oxygen using EC Oxyrase as described previously (Wang et al., 2000). Cells were observed by epifluorescence and phase-contrast microscopy with a Nikon (Tokyo, Japan) TE300 inverted microscope 3 d after transfection. Image acquisition was performed with a Nikon 100×/1.4 numerical aperture (NA) Plan Apo DM oil immersion objective and an FITC/enhanced GFP filter set (HQ 41001; Chroma Technology, Brattleboro, VT). Images were acquired with a MicroMax 512BFT cooled CCD camera (Roper Scientific, Trenton, NY). The temperature on the microscope stage was maintained at ∼35°C using a Nicholson ASI-400 air stream incubator (Nevtek, Burnsville, VA). For time-lapse imaging, the epifluorescent illumination was attenuated by 70-90% using neutral density filters, and images were acquired at 4 s intervals with 1 s exposures using MetaMorph software (Universal Imaging Corporation, West Chester, PA) as described by Brown (2003a).
Capture and fixation of moving filaments. The cells in the imaging chamber were permeabilized by flowing permeabilization solution under gravity at a rate of 3.8 ml/min for ∼1 min while simultaneously acquiring time-lapse images of the fluorescence as described above. The flow was initiated by removing a mini binder clip on the inlet tubing and stopped by replacing the clip. The permeabilization solution consisted of 0.02% saponin (Sigma) in a solution composed of NPHEM (0.19 m NaCl, 60 mm sodium PIPES, 25 mm sodium HEPES, 10 mm sodium EGTA, 2 mm MgCl2, pH 6.9) and a mixture of protease inhibitors (10 μg/ml Bestatin, 10 μg/ml Leupeptin, and 10 μg/ml E64). In some experiments, we substituted 5 mm CaCl2 for the EGTA in the NPHEM to induce microtubule disassembly (Black et al., 1984; O'Brien et al., 1997). The small internal volume (260 μl) and laminar flow design of the chamber permitted a rapid rate of solution exchange during perfusion. To maintain stable focus during the perfusion, we warmed the permeabilization solution before it entered the chamber using an SH-27B in-line solution heater (Warner Instruments). Five to 10 min after stopping the flow, the cells were fixed by perfusing 3 ml of fixative (>10 chamber volumes) into the chamber at a rate of ∼2 ml/min. For immunostaining, the fixative consisted of 4% (w/v) formaldehyde in NPHEM, and for electron microscopy, it consisted of 2% glutaraldehyde (electron microscopy grade; Polysciences, Warrington, PA) in 150 mm sodium phosphate, pH 7.4 (320 mOsm). During the fixation, the location of the axon of interest was marked using a Leitz (Wetzlar, Germany) diamond scoring object marker. After fixation for 10-20 min, the chamber was removed from the microscope stage, submerged in PBS, and disassembled. The coverslips were then immersed in fresh fixative for another 20-30 min. Subsequently, coverslips for immunostaining were rinsed with PBS, and the cells were demembranated with PBSNT (1% Triton X-100 plus 0.3 m NaCl in PBS) for 15 min [“postfixation extraction” (Brown, 1997)].
Immunostaining captured and splayed filaments. To splay axonal neurofilaments apart from each other, coverslips were rinsed once with PBS, once with NPHEM, and then treated with 0.5% Triton X-100 (Sigma) in NPHEM at room temperature for 5 min. The splayed cytoskeletons were then fixed and processed as described above. To compare the fluorescence intensity of splayed and captured neurofilaments quantitatively, all coverslips for each experiment were from the same culture batch (“sister coverslips”) and were processed identically. To visualize neurofilaments, the cells were stained with a rabbit polyclonal antiserum specific for neurofilament protein L (NFL) (primary antibody) (Trojanowski et al., 1989; Brown, 1998). To avoid the possibility of photobleaching during routine inspection and focusing, the NFL primary antibody was visualized with a goat anti-rabbit secondary antibody conjugated to Rhodamine Red-X (Jackson ImmunoResearch, West Grove, PA) followed by a donkey anti-goat tertiary antibody conjugated to Alexa 488 (Molecular Probes, Eugene, OR). All routine inspection and focusing was performed on the Alexa 488 channel, and the rhodamine channel was reserved exclusively for image acquisition. All images were acquired using a 100×/1.4NA Plan Apo DM oil immersion objective, a Quantix cooled CCD camera (Roper Scientific), and identical exposure times.
Analysis of fluorescence intensity along captured and splayed filaments. To quantify the incorporation of GFP-NFM along individual filaments, splayed axonal cytoskeletons were immunostained using an antibody to NFL as described above, and GFP-NFM was visualized directly using the intrinsic GFP fluorescence, which could still be detected after fixation. Using MetaMorph software, a line was drawn along the medial axis of each filament in the image of NFL fluorescence, and then one or more lines were drawn on the image of the GFP fluorescence corresponding to the portion or portions of each filament that contained GFP-NFM. For each filament, the total length of the line(s) on the GFP-NFM image was divided by the length of the line on the NFL image to determine the percentage of the filament length containing GFP-NFM.
To quantify the fluorescence intensity of captured and splayed filaments, images of immunostained filaments were subjected to flat-field correction using a digital filtering procedure (Brown, 2003a), and the average fluorescence intensity along each filament was measured using MetaMorph software and the segmented mask method described previously (Brown et al., 1992). To select splayed neurofilaments for these measurements, we used the following criteria: (1) the filaments were located in the central 25% of the image area, (2) the fluorescence intensity along the filaments appeared uniform, (3) there were no sharp bends along the filaments (sharp bends gave rise to segmentation artifacts), and (4) the filaments could be traced unambiguously for at least 3 μm. To compare the intensity of single and bundled filaments, we took advantage of the fact that single filaments in the splayed preparations occasionally pair up along part of their length (Brown, 1997). As we have noted previously, this coalignment indicates simply that the filaments are sufficiently close to each other that they cannot be resolved in the light microscope and it does not necessarily imply the existence of any interaction between the filaments (Brown, 1997). Paired filaments were analyzed if the two filaments were coaligned for a distance of at least 2 μm.
Electron microscopy. After fixation, coverslips bearing captured filaments were rinsed twice in sodium phosphate buffer (5 min per rinse) and left in fresh buffer overnight at 4°C. For those experiments involving semithin sectioning, the fixed cells were treated with 0.5% Triton X-100 (Sigma) in sodium phosphate buffer for 5 min to extract membranes and thereby facilitate subsequent detection of the neurofilaments in the electron microscope. To ensure that we could identify the axon of interest unambiguously in the electron microscope, all surrounding axons in the fixed preparations were severed and scraped off the coverslip using a blunt 20- to 30-μm-diameter glass fiber mounted to the Eppendorf InjectMan NI2 micromanipulator. The glass fiber was pulled from 1-mm-diameter borosilicate glass rods (World Precision Instruments) using a Sutter P-97 Flaming-Brown pipette puller. We also severed the axon of interest 30-40 μm proximal and distal to the gap and scraped away the unwanted regions. Six to eight cell bodies were then placed around the isolated axonal segment to mark the location. To do this, the glass fiber was used to sever the axons around nearby cell bodies and then push those cell bodies across the glass coverslip to the area where the axon was located.
After these manipulations, the coverslips were rinsed in sodium phosphate buffer, postfixed in 1% osmium tetroxide (Electron Microscopy Sciences, Fort Washington, PA), rinsed in 3.6% NaCl, then in water, and then stained with 5% aqueous uranyl acetate (Polysciences) in the dark. The cells were then dehydrated through 50, 70, 80, 95, and 100% ethanol. For infiltration, the coverslips were treated first with propylene oxide (Electron Microscopy Sciences), then with a 1:1 mixture of propylene oxide and Poly/Bed 812 epoxy resin (Polysciences), then with a 1:2 mixture, and finally with resin alone. After infiltration, a BEEM capsule was filled with fresh resin and inverted onto the region of the coverslip containing the axon of interest, and the resin was polymerized in a vacuum oven at 65°C for 2 d. After embedding, the coverslip was dissolved from the block using 48% hydrofluoric acid. The area where the axon of interest was located could easily be found in the resin block under phase contrast with the help of the surrounding cell bodies.
Ultrathin sections (silver/gold; ∼80-100 nm) and semithin sections (blue/green; ∼200-300 nm) were cut with a diamond knife using a Reichert-Jung (Vienna, Austria) Ultracut microtome, retrieved on uncoated hexagonal 200 mesh copper grids, and stained with uranyl acetate and lead citrate. The sections were observed using a Phillips CM-12 transmission electron microscope at 80 kV. For each section, overlapping images of the entire gap and flanking regions were acquired on photographic film at a magnification of 22,000× and 45,000× and digitized using a flatbed scanner at a resolution of 1200 dpi. Montages of the axon were constructed from the digitized images using Adobe Photoshop (Adobe Systems, San Jose, CA). Neurofilament diameter was measured using the “calipers” tool in MetaMorph. For each captured filament, we performed 20-35 measurements at intervals of 100 or 300 pixels along the filament.
Results
Visualizing neurofilaments in gaps
Cultured neurons from superior cervical ganglia of neonatal rats frequently exhibit discontinuities in their axonal neurofilament array, resulting in short segments of axon that lack neurofilaments (Wang et al., 2000). In neurons expressing GFP-NFM, these regions are manifested as gaps in the GFP fluorescence. We have observed a total of 145 gaps in the GFP fluorescence, and in all cases, these gaps also corresponded to gaps in the NFL staining, which confirms that the gaps in the GFP fluorescence are devoid of neurofilaments. In the present study, we have taken advantage of these gaps to capture and characterize the structure of single moving filaments. We have shown previously that GFP-NFM coassembles with endogenous neurofilament proteins throughout these neurons and the GFP-NFM incorporation is continuous along some neurofilaments and discontinuous along others (Wang et al., 2000). To quantify the extent of incorporation of GFP-NFM along single neurofilaments, we analyzed splayed axonal cytoskeletons of transfected neurons. All neurofilaments contained GFP-NFM along at least part of their length, and 88% contained GFP-NFM along >50% of their length (Fig. S1, available at www.jneurosci.org as supplemental material). Thus, all neurofilaments in these neurons incorporated GFP-NFM, although in most cases, the GFP fluorescence did not label the entire filament length.
Capturing moving filaments
To capture filaments moving through gaps, we developed a perfusion technique that allows us to rapidly permeabilize neurons during time-lapse movie acquisition. We have shown previously that 0.02% saponin is sufficient to permeabilize axons of cultured neurons (Koehnle and Brown, 1999) and that it causes minimal neurofilament splaying (Brown, 1997), presumably because it permeabilizes the axonal membrane without stripping it away completely. To confirm that 0.02% saponin was sufficient to permeabilize axons in the imaging and perfusion chamber, we injected 10 mg/ml tetramethylrhodamine dextran (Mw, 10,000; Sigma) into the cytoplasm of neurons 5 d after plating. Three hours later, the coverslip containing the microinjected cells was assembled into the imaging chamber, and the loss of fluorescence during the perfusion of permeabilization solution was monitored by time-lapse fluorescence microscopy. One minute after the start of perfusion, the average proportion of the fluorescence that remained in the axon was 2% (minimum, 0.8%; maximum, 3%; n = 14; data not shown). Thus, axons in our imaging chamber were permeabilized within 1 min of starting the flow of perfusate.
Coverslips containing neurons expressing GFP-NFM were mounted in the imaging chamber, and gaps in the GFP fluorescence were observed by time-lapse fluorescence imaging. When the leading end of a fluorescent filament moved into the gap, the binder clip on the inlet tubing was released, initiating flow of permeabilization solution into the chamber and stopping the filament (Fig. 1 and QuickTime movie 1, available at www.jneurosci.org as supplemental material). In total, we analyzed the capture of 42 filaments. Some filaments stopped almost immediately, whereas others continued to move for many seconds before stopping. Five of the filaments could not be tracked unambiguously during the flow of perfusate because of focus changes. For the remaining 37 captured filaments, the average stop time was 11 s (range, 4-36 s). The variability most likely reflects variation in the rate of permeabilization. We do not know the mechanism by which permeabilization leads to cessation of movement, but the most likely possibilities are either loss of soluble factors required for neurofilament movement or disassembly of the cytoskeletal polymer tracks along which the neurofilaments move. We have tried to reactivate the movement of captured filaments by permeabilization in the presence of microtubule stabilizing agents and subsequent addition of ATP, but so far, these attempts have not been successful (data not shown).
Figure 1.
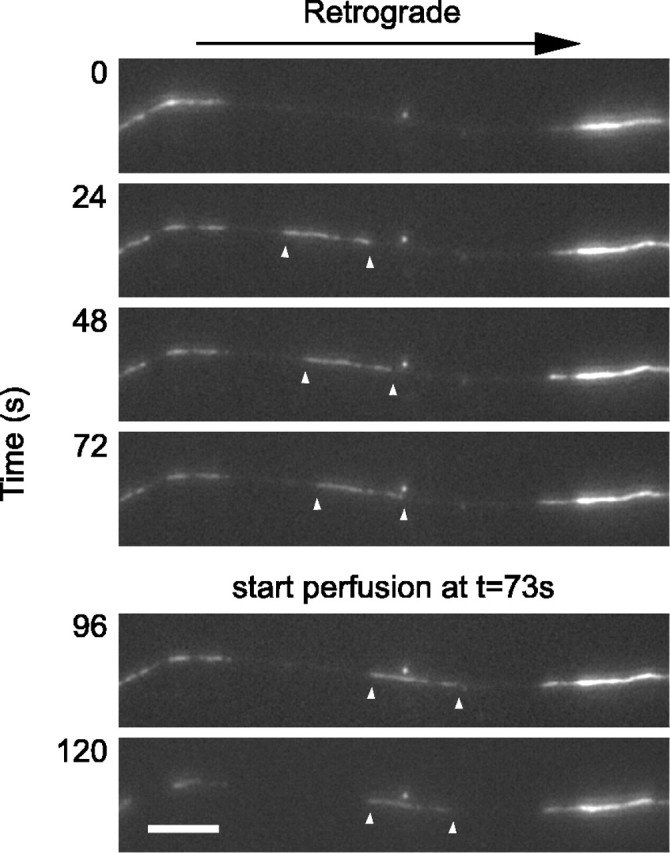
Capture of a moving filament. The images shown here were selected from a time-lapse movie acquired at 4 s intervals. The white arrowheads mark the leading and trailing ends of the moving filament. The filament moved rapidly into the gap, pausing intermittently, and then stopped shortly after the start of the flow of the permeabilization solution. Proximal is right, and distal is left. Scale bar, 6 μm. See also QuickTime movie 1 (available at www.jneurosci.org as supplemental material).
Of the 42 filaments that we analyzed, 25 stopped with both their leading and trailing ends visible within the gap, and 17 stopped with only one end visible. In nine cases, one end of the captured filament was observed to jiggle laterally before fixation, which we attribute to Brownian motion (Brown, 1997). In some cases, the free end was long enough to loop back on itself, giving the filament the appearance of a barb or eye bolt after fixation. We have shown previously that ∼60-80% of the filaments move anterogradely in these neurons (Wang et al., 2000; Uchida and Brown, 2004), but in the present study, we chose to capture similar numbers of each directionality (19 anterograde and 23 retrograde). The lengths of 33 of these filaments ranged from 2.1 to 36.0 μm (mean, 13.3 μm); the remaining nine filaments could not be measured because both ends were never in the gap in the same time-lapse movie frame.
Fifteen of the captured structures were observed in the chamber system on the microscope stage for >10 min after the flow of permeabilization solution was stopped. All of them remained intact without any change in their shape or their position relative to the gap during the period of observation. In six experiments, 2-3 ml of 0.5% Triton X-100 (8-12 chamber volumes) was perfused through the chamber after the filaments had stopped, and the filaments were observed for an additional 5 min. In all cases, the captured filaments remained, and their appearance did not change. Because 0.5% Triton X-100 is sufficient to permeabilize membranous organelles (Lutter et al., 2000), this suggests that the moving filaments do not represent neurofilament protein subunits contained within membranous tubules.
Immunofluorescence microscopy of captured filaments
When cultured neurons are treated with nonionic detergent under certain conditions, the cytoskeletal polymers can be induced to splay apart from each other, permitting direct visualization of single axonal neurofilament polymers by immunofluorescence microscopy (Brown, 1997, 1998). If the captured filaments are neurofilament polymers, then they should immunostain with comparable intensity to neurofilament polymers in these splayed preparations. To test this hypothesis, we used immunofluorescence microscopy with an NFL antibody to compare captured and splayed filaments. In total, we immunostained 17 of the 42 captured filaments mentioned above. Before capture, eight of these filaments were moving anterogradely, and nine were moving retrogradely. Thirteen of the filaments stopped with both ends in the gap (average length, 16 μm; range, 4-34 μm). As expected, the GFP fluorescence was continuous along the length of some of the captured filaments and discontinuous along the length of others. In three instances, the segment of the filament length lacking GFP fluorescence was at one or both ends of the filament, giving rise to an apparent discrepancy between the filament length when comparing the image of the NFL immunofluorescence with the image of the intrinsic GFP fluorescence (for example, see Fig. S2, available at www.jneurosci.org as supplemental material).
Previous studies in our laboratory have shown that neurofilaments in splayed axonal cytoskeletons sometimes appear to pair up along their length and that paired and unpaired filaments can be distinguished by immunofluorescence microscopy based on their intensity of staining using an NFL antibody (Brown, 1997). By visual comparison, the captured filaments appeared to be similar in brightness to single splayed filaments and less bright than paired filaments. To test this quantitatively, we analyzed the fluorescence intensity along the length of captured filaments and along the length of single and paired splayed filaments from sister coverslips. For each culture batch, we typically captured one to three filaments (one captured filament per coverslip) and then processed two additional coverslips for splaying. To permit quantitative comparison of the fluorescence intensities of filaments within each experiment, we stained the coverslips side-by-side to ensure identical treatment. We typically analyzed 10-15 unpaired filaments and two or three paired filaments on each of the two splayed coverslips. The number of paired filaments was far fewer than the number of unpaired filaments because the coalignment of two filaments was relatively rare. In total, we analyzed 213 splayed filaments (169 unpaired and 44 paired).
To compare the data from different experiments, we normalized all the fluorescence intensities for the captured filaments and paired and unpaired splayed filaments from each experiment to the mean of the fluorescence intensity of unpaired splayed filaments for that experiment (Fig. 2). The distributions for the paired and unpaired filaments each matched a Gaussian distribution (p > 0.05 for both sets of data; Kolmogorov-Smirnov goodness of fit test). As expected, the mean of the normalized data for the paired neurofilaments (1.98 ± 0.30 SD) was twice the mean for the unpaired neurofilaments (1.00 ± 0.15 SD) (Brown, 1997). By comparison, the mean of the normalized data for the captured filaments was 1.10 ± 0.35 SD. Statistical comparison of the means shows that the captured filaments are not significantly different from unpaired filaments (p > 0.05; unpaired t test), but they are significantly different from paired filaments (p < 0.05; unpaired t test). These observations indicate that the NFL protein content of the moving filaments is not significantly different from that of single neurofilament polymers in splayed axonal cytoskeletons.
Figure 2.

Quantitative analysis of captured and splayed filaments. A, Histogram of the normalized fluorescence intensities for 169 unpaired filaments from splayed axonal cytoskeletons. B, Histogram of normalized fluorescence intensities for 44 paired filaments from splayed axonal cytoskeletons. The curves represent Gaussian fits of the binned data. C, Histogram of normalized fluorescence intensities for 17 captured filaments. The mean normalized fluorescence intensity of the captured filaments is not significantly different from the unpaired filaments (p > 0.05; unpaired t test), but it is significantly different from the paired filaments (p < 0.05; unpaired t test). The insets in A-C show examples of the NFL immunofluorescence for unpaired, paired, and captured filaments, respectively. The white arrowheads label the unpaired filaments in A and the paired filament in B. Scale bar, 5 μm.
Electron microscopy of captured filaments
To demonstrate unequivocally that the captured filaments are indeed neurofilament polymers, we performed correlative light and electron microscopy. These studies were technically challenging because the axons were typically only 100-200 nm in diameter, and they were contained entirely within the first two or three ultra thin sections to come off the resin block during sectioning. To assist us in locating the axon of interest in the electron microscope, we severed the axons around the gap after glutaraldehyde fixation and cleared them away from the area (see Materials and Methods). We also positioned several nerve cell bodies in the vicinity of the gap to help mark its position. In most cases, we were also able to take advantage of cellular debris and varicosities along the axons to assist us in locating the captured filament.
Initially, we captured moving filaments by perfusing the chamber with 2% glutaraldehyde fixative in 150 mm sodium phosphate, pH 7.4, which typically stopped the movement within 8 s (data not shown). We then processed the axons for transmission electron microscopy using silver/gold (80-100 nm) ultrathin sections. Using this approach, we successfully located three gaps, but in each case, the captured filament was obscured along much of its length by the densely packed microtubules and membranous organelles in these thin axons. To overcome this problem, we captured moving filaments by perfusing the chamber with 0.02% saponin as we did for the light microscopic studies described above, except that we included 5 mm calcium chloride to depolymerize the microtubules (Black et al., 1984; O'Brien et al., 1997). Note that the perfusion solution contained a mixture of protease inhibitors to prevent calcium-dependent proteolysis. The axon was then fixed using 2% glutaraldehyde and processed for transmission electron microscopy using silver/gold (80-100 nm) ultrathin sections. In total, we successfully located three captured filaments using this approach. These filaments measured 5.5, 6.5, and 13.2 μm in length in the images of the GFP fluorescence. Two of the filaments were moving anterogradely, and one was moving retrogradely. In each case, the gap was devoid of neurofilaments except for a single filament in the same location as the captured filament. However, in no case was the entire axon or filament contained within a single section. Two of the axons were contained within two sections, and one was contained within three. In all three axons, the captured filament traced a serpentine course, passing in and out of each section multiple times. Figure 3 shows an example of one of these filaments, which was moving retrogradely at the time of capture. We attempted to serially reconstruct the filaments in adjacent sections but encountered difficulty in aligning the images as a result of differential shrinkage or expansion of the sections during processing and observation.
Figure 3.
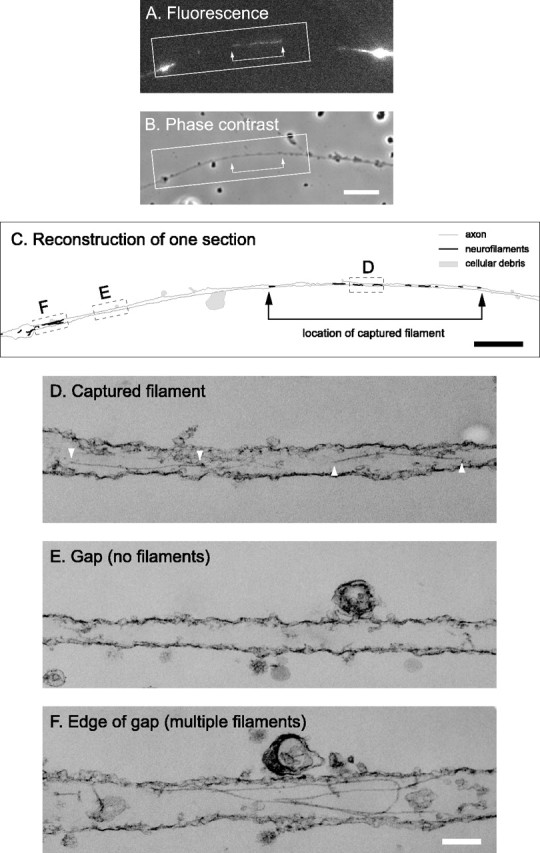
Electron microscopy of a captured filament using ultrathin sectioning. A, GFP fluorescence of a permeabilized axon before fixation, showing a captured filament in a gap. This filament was moving retrogradely at the time of capture. Proximal is left, and distal is right. B, Phase-contrast image of the same axon. The blebs along the axon are a consequence of the saponin treatment. Scale bar, 8 μm. C, Schematic line drawing of the axon and neurofilaments. The filaments and axon were traced from a montage generated from the digitized electron micrographs. Scale bar, 2 μm. The entire axon was contained within three ultrathin (silver/gold) sections. The section shown here was the first to come off the block (i.e., the section immediately adjacent to the glass coverslip). The neurofilaments are represented by the black lines, and the axon outline is represented by the gray lines. The black lines have been thickened to make the location of the filaments visible; therefore, their thickness is not to scale. The shaded regions represent cellular debris, also visible in the phase-contrast image. The varicosities and cellular debris facilitated alignment of the fluorescence image with the electron micrographs. The arrows in A-C mark the ends of the filament. D-F, Electron micrographs of the three boxed regions shown in C. Note the two segments of the captured filament marked by white arrowheads shown in D, the absence of neurofilaments in the gap shown in E, and presence of several filaments in the region flanking the gap shown in F. The membrane is mostly intact, which indicates that saponin perforates the membrane without stripping it away. Note that microtubules are absent from these images because we destabilized axonal microtubules by including 5 mm calcium in the permeabilization solution to permit unambiguous detection of the captured neurofilament. Scale bar, 150 nm.
To avoid the need for serial reconstruction of the captured filament in ultrathin sections, we switched to blue/green (200-300 nm) semithin sections so that the entire axon would be contained in one section. We found that the filament was generally obscured along portions of its length by membranous elements in these thicker sections, so we treated the axons with 0.5% Triton X-100 after glutaraldehyde fixation. Using this approach, we successfully located two captured anterogradely moving filaments. Each axon was contained entirely within one section, and the captured filaments could be traced continuously along their entire length. In both cases, the gap was devoid of neurofilaments except for a single filament in same place as the captured filament. Both filaments measured longer by electron microscopy than was apparent by fluorescence microscopy. One of the filaments (Fig. 4) measured 5.6 μm in the image of the intrinsic GFP fluorescence and 8.9 μm in the electron micrographs, which indicates that it had incorporated GFP-NFM along 63% of its length. The other captured filament (data not shown) measured 6.6 μm in the image of the intrinsic GFP fluorescence and 8.9 μm in the electron micrographs, which indicates that it had incorporated GFP-NFM along 74% of its length. In both cases, the nonfluorescent parts of these two filaments happened to be located at their trailing ends.
Figure 4.
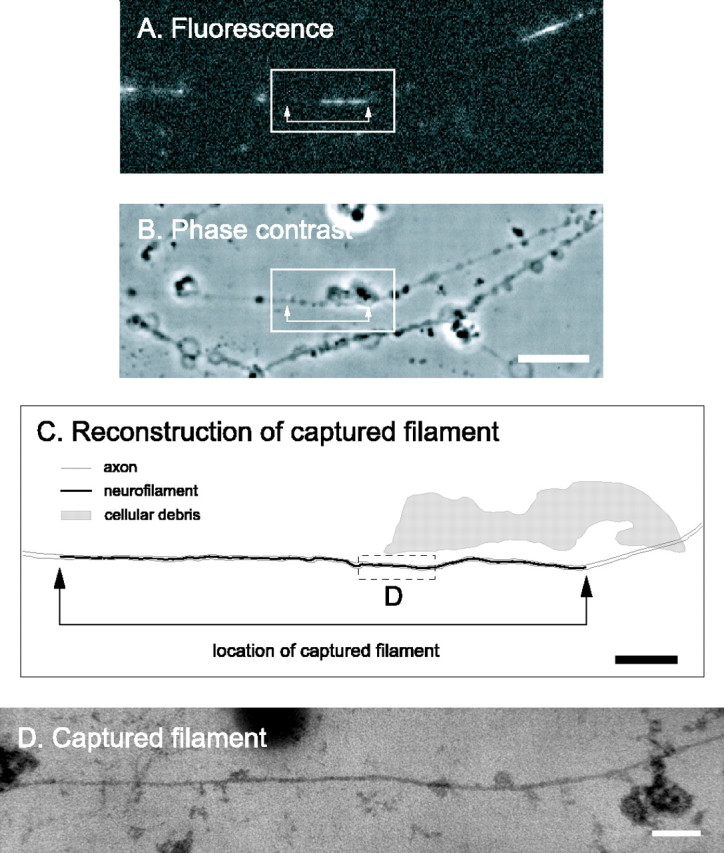
Electron microscopy of a captured filament using semithin sectioning. A, GFP fluorescence of a permeabilized axon before fixation, showing a captured filament in a gap. This filament was moving anterogradely at the time of capture. Proximal is left, and distal is right. B, Phase-contrast image of the same axon. The blebs along the axons are a consequence of the saponin treatment. Scale bar, 8 μm. C, Schematic line drawing of the axon and neurofilaments. The filament was traced from a montage generated from the digitized electron micrographs. Scale bar, 2 μm. The entire axon was contained within one semithin (blue/green) section that was the first to come off the block (i.e., the section immediately adjacent to the glass coverslip). The neurofilament is represented by the black line. This line was thickened to make the location of the filament visible; therefore, it is not to scale. The axon membrane was extracted for semithin sectioning (see below); therefore, the outline of the axon was drawn artificially based on the phase-contrast image and is represented by the gray lines. The shaded region represents a large piece of cellular debris, also visible in the phase-contrast image, which facilitated alignment of the fluorescence image with the electron micrographs. The arrows in A-C mark the ends of the filament. One end of the filament extended further in the electron micrographs than in the image of the GFP fluorescence, indicating that this neurofilament had not incorporated GFP-NFM along its entire length. D, Electron micrograph of the boxed region shown in C. The axon membrane is not present because we treated with 0.5% Triton X-100 after glutaraldehyde fixation to permit unambiguous detection of the neurofilament along its entire length. Note the continuity of the captured filament here, comparing to the discontinuity in ultrathin section in Figure 3. Scale bar, 100 nm.
To confirm that the captured filaments were neurofilament polymers, we measured their diameters at 20-35 evenly spaced points along their length and also performed similar measurements on filaments in regions flanking the gaps. The average diameter of the three captured filaments was 10.2 ± 0.7 nm in the ultrathin sections and 10.5 ± 0.8 nm in the semithin sections. In comparison, the average diameter of filaments flanking the gaps was 10.4 ± 0.8 nm in the ultrathin sections and 10.3 ± 0.8 nm in the semithin sections. We estimate that our calibration of the magnification in the electron microscope was accurate to within ±10%. Thus, the captured filaments were single, continuous 10-nm-diameter neurofilament polymers.
Discussion
Previous studies on the axonal transport of GFP-tagged neurofilament protein in cultured rat sympathetic and cortical neurons by ourselves and others have demonstrated that neurofilament proteins in these cells move predominantly in a filamentous form (Roy et al., 2000; Wang et al., 2000; Wang and Brown, 2001; Ackerley et al., 2003; Uchida and Brown, 2004). In the present study, we tested the hypothesis that these filamentous structures represent single neurofilament polymers. We used a rapid permeabilization technique to capture moving filaments as they moved through naturally occurring gaps in the axonal neurofilament array. Because these gaps have no other neurofilaments, they permitted us to identify unambiguously the captured filament and to examine its structure by immunofluorescence and electron microscopy. We found that the captured filaments were resistant to extraction with nonionic detergent and had an NFL protein content indistinguishable from single neurofilaments in detergent-splayed axonal cytoskeletons.
To confirm that the captured filaments were neurofilament polymers, we performed transmission electron microscopy. Because the captured filaments were the only filaments in the gap, we were able to identify them unambiguously in the electron microscope. We successfully located three captured filaments in ultrathin sections. In all cases, we observed a neurofilament polymer in the location of the captured filament, but each filament traced a serpentine course through adjacent sections so it was not possible to confirm that the polymer was continuous. To observe the entire captured filament in a single section, we performed semithin sectioning. Using this approach, we successfully located two captured filaments and confirmed that they were indeed single continuous 10-nm-diameter neurofilament polymers. Thus, we conclude that neurofilament polymers are indeed cargo structures of slow axonal transport. Because ≥97% of the GFP-NFM in cultured rat sympathetic neurons moves in the form of filamentous structures (Wang et al., 2000; Wang and Brown, 2001; Uchida and Brown, 2004), these data indicate that neurofilament polymers are also the predominant transport form in these cells.
The debate regarding the form in which cytoskeletal proteins are transported along axons has become polarized between those that advocate for the movement of assembled polymers and those that advocate for the movement of unassembled subunits, although it should be noted that these perspectives are not necessarily mutually exclusive. In cultured sympathetic neurons, ∼3% of the moving structures are punctate in shape, and it is possible that these structures represent unassembled neurofilament protein (Uchida and Brown, 2004). In neuronal cell lines, punctate structures predominate at early times after neurite initiation, whereas both punctate and filamentous structures are observed at later times (Yabe et al., 2001; Helfand et al., 2003). Based on these observations, Yabe et al. (1999, 2001) have proposed that neurofilament proteins may be capable of movement in both polymerized and unpolymerized forms, that the predominant form varies depending on the differentiation state of the cell, and that the punctate structures observed in these studies represent motile precursors of neurofilament assembly. The fact that our own studies on neurofilament transport have been conducted exclusively in cultured neurons that have extended axons for several days may explain why the number of puncta that we have observed is so much lower than in studies on neuronal cell lines. Alternatively, the large number of neurofilament puncta observed in neuronal cell lines could be a result of the overexpression of GFP-tagged neurofilament protein relative to endogenous neuronal intermediate filament protein levels in these cells. Whatever the case, our results put to rest the argument that neurofilament polymers do not move at all (Hirokawa et al., 1997; Terada and Hirokawa, 2000; Terada, 2003).
The hypothesis that cytoskeletal polymers can translocate along axons was first proposed some 30 years ago when little was known about the mechanism of axonal transport (Hoffman and Lasek, 1975; Lasek and Hoffman, 1976). Since that time, it has become clear that axonal transport represents the movement of numerous distinct types of membranous and nonmembranous cargo structures, each propelled by motor proteins that move along cytoskeletal tracks (Brown, 2003b). Our data indicate that neurofilament polymers are one of these cargo structures and that they can be translocated along axons at remarkably fast rates. This has obvious implications for our understanding of how neurofilaments are delivered to axons, but it also may have equally important implications for how they are organized. In fact, the role of motor-driven movements in the organization of cytoskeletal polymers in cells has emerged as a recurring theme in the cytoskeletal repertoire of all eukaryotic cells, and there are now many known examples of cytoskeletal organization and rearrangement that are the product of the coordinated action of molecular motors. Thus, it is attractive to speculate that the highly asymmetric linear overlapping array that characterizes neurofilament organization in axons may be molded actively by the dynamic forces of neurofilament polymer translocation that act on these long and flexible polymers to distribute and align them along the axon as well as to transport them toward the axon tip.
Footnotes
This work was supported by a grant to A.B. from the National Institutes of Health. We thank Lei Wang, Atsuko Uchida, and Kitty Jensen in the Brown laboratory and Dick Burry, Kathy Wolken, and Brian Kemmenoe of the Ohio State University Central Microscopy and Imaging Facility for their help during this project.
Correspondence should be addressed to Dr. Anthony Brown, The Ohio State University, Center for Molecular Neurobiology, Rightmire Hall, 1060 Carmack Road, Columbus, OH 43210. E-mail: brown.2302@osu.edu.
Copyright © 2005 Society for Neuroscience 0270-6474/05/257014-08$15.00/0
References
- Ackerley S, Thornhill P, Grierson AJ, Brownlees J, Anderton BH, Leigh PN, Shaw CE, Miller CC (2003) Neurofilament heavy chain side arm phosphorylation regulates axonal transport of neurofilaments. J Cell Biol 161: 489-495. [DOI] [PMC free article] [PubMed] [Google Scholar]
- Baas PW, Brown A (1997) Slow axonal transport: the polymer transport model. Trends Cell Biol 7: 380-384. [DOI] [PubMed] [Google Scholar]
- Black MM, Cochran JM, Kurdyla JT (1984) Solubility properties of neuronal tubulin: evidence for labile and stable microtubules. Brain Res 295: 255-263. [DOI] [PubMed] [Google Scholar]
- Brown A (1997) Visualization of single neurofilaments by immunofluorescence microscopy of splayed axonal cytoskeletons. Cell Motil Cytoskeleton 38: 133-145. [DOI] [PubMed] [Google Scholar]
- Brown A (1998) Contiguous phosphorylated and non-phosphorylated domains along axonal neurofilaments. J Cell Sci 111: 455-467. [DOI] [PubMed] [Google Scholar]
- Brown A (2000) Slow axonal transport: stop and go traffic in the axon. Nat Rev Mol Cell Biol 1: 153-156. [DOI] [PubMed] [Google Scholar]
- Brown A (2003a) Live-cell imaging of slow axonal transport in cultured neurons. Methods Cell Biol 71: 305-323. [DOI] [PMC free article] [PubMed] [Google Scholar]
- Brown A (2003b) Axonal transport of membranous and nonmembranous cargoes: a unified perspective. J Cell Biol 160: 817-821. [DOI] [PMC free article] [PubMed] [Google Scholar]
- Brown A, Slaughter T, Black MM (1992) Newly assembled microtubules are concentrated in the proximal and distal regions of growing axons. J Cell Biol 119: 867-882. [DOI] [PMC free article] [PubMed] [Google Scholar]
- Galbraith JA, Reese TS, Schlief ML, Gallant PE (1999) Slow transport of unpolymerized tubulin and polymerized neurofilament in the squid giant axon. Proc Natl Acad Sci USA 96: 11589-11594. [DOI] [PMC free article] [PubMed] [Google Scholar]
- Helfand BT, Loomis P, Yoon M, Goldman RD (2003) Rapid transport of neural intermediate filament protein. J Cell Sci 116: 2345-2359. [DOI] [PubMed] [Google Scholar]
- Hirokawa N, Terada S, Funakoshi T, Takeda S (1997) Slow axonal transport: the subunit transport model. Trends Cell Biol 7: 384-388. [DOI] [PubMed] [Google Scholar]
- Hoffman PN, Lasek RJ (1975) The slow component of axonal transport: identification of major structural polypeptides of the axon and their generality among mammalian neurons. J Cell Biol 66: 351-366. [DOI] [PMC free article] [PubMed] [Google Scholar]
- Koehnle TJ, Brown A (1999) Slow axonal transport of neurofilament protein in cultured neurons. J Cell Biol 144: 447-458. [DOI] [PMC free article] [PubMed] [Google Scholar]
- Lasek RJ, Hoffman PN (1976) The neuronal cytoskeleton, axonal transport and axonal growth. In: Cell motility (Goldman R, Pollard T, Rosenbaum J, eds), pp 1021-1049. Cold Spring Harbor, NY: Cold Spring Harbor Laboratory.
- Lutter M, Fang M, Luo X, Nishijima M, Xie X, Wang X (2000) Cardiolipin provides specificity for targeting of tBid to mitochondria. Nat Cell Biol 2: 754-761. [DOI] [PubMed] [Google Scholar]
- Nixon RA (1998) Dynamic behavior and organization of cytoskeletal proteins in neurons: reconciling old and new findings. BioEssays 20: 798-807. [DOI] [PubMed] [Google Scholar]
- O'Brien ET, Salmon ED, Erickson HP (1997) How calcium causes microtubule depolymerization. Cell Motil Cytoskeleton 36: 125-135. [DOI] [PubMed] [Google Scholar]
- Prahlad V, Helfand BT, Langford GM, Vale RD, Goldman RD (2000) Fast transport of neurofilament protein along microtubules in squid axoplasm. J Cell Sci 113: 3939-3946. [DOI] [PubMed] [Google Scholar]
- Roy S, Coffee P, Smith G, Liem RKH, Brady ST, Black MM (2000) Neurofilaments are transported rapidly but intermittently in axons: implications for slow axonal transport. J Neurosci 20: 6849-6861. [DOI] [PMC free article] [PubMed] [Google Scholar]
- Shah JV, Cleveland DW (2002) Slow axonal transport: fast motors in the slow lane. Curr Opin Cell Biol 14: 58-62. [DOI] [PubMed] [Google Scholar]
- Terada S (2003) Where does slow axonal transport go? Neurosci Res 47: 367-372. [DOI] [PubMed] [Google Scholar]
- Terada S, Hirokawa N (2000) Moving on to the cargo problem of microtubule-dependent motors in neurons. Curr Opin Neurobiol 10: 566-573. [DOI] [PubMed] [Google Scholar]
- Terada S, Nakata T, Peterson AC, Hirokawa N (1996) Visualization of slow axonal transport in vivo. Science 273: 784-788. [DOI] [PubMed] [Google Scholar]
- Theiss C, Napirei M, Meller K (2005) Impairment of anterograde and retrograde neurofilament transport after anti-kinesin and anti-dynein antibody microinjection in chicken dorsal root ganglia. Eur J Cell Biol 84: 29-43. [DOI] [PubMed] [Google Scholar]
- Trojanowski JQ, Kelsten ML, Lee VM-Y (1989) Phosphate-dependent and independent neurofilament protein epitopes are expressed throughout the cell cycle in human medulloblastoma (D283 MED) cells. Am J Pathol 135: 747-758. [PMC free article] [PubMed] [Google Scholar]
- Uchida A, Brown A (2004) Arrival, reversal and departure of neurofilaments at the tips of growing axons. Mol Biol Cell 15: 4215-4225. [DOI] [PMC free article] [PubMed] [Google Scholar]
- Wang L, Brown A (2001) Rapid intermittent movement of axonal neurofilaments observed by fluorescence photobleaching. Mol Biol Cell 12: 3257-3267. [DOI] [PMC free article] [PubMed] [Google Scholar]
- Wang L, Ho C-L, Sun D, Liem RKH, Brown A (2000) Rapid movement of axonal neurofilaments interrupted by prolonged pauses. Nat Cell Biol 2: 137-141. [DOI] [PubMed] [Google Scholar]
- Yabe JT, Pimenta A, Shea TB (1999) Kinesin-mediated transport of neurofilament protein oligomers in growing axons. J Cell Sci 112: 3799-3814. [DOI] [PubMed] [Google Scholar]
- Yabe JT, Chan WK-H, Chylinski TM, Lee S, Pimenta A, Shea TB (2001) The predominant form in which neurofilament subunits undergo axonal transport varies during axonal initiation, elongation and maturation. Cell Motil Cytoskeleton 48: 61-83. [DOI] [PubMed] [Google Scholar]